Munich Personal RePEc Archive
Reducing Out of School Children in
India: Lessons from a Micro Study
Mukherjee, Dipa
Department of Economics, Narasinha Dutt College
2010
Online at
https://mpra.ub.uni-muenchen.de/35047/
Reducing Out of School Children in India: Lessons from a Micro Study
[preprint version, in Journal of Educational Planning and Administration, Vol. 25, No. 2, April, 2011]
Abstract
Throughout the world ensuring formal education to all children has been an area of lively debate for about a decade with many different viewpoints on the issue. Sadly, Universalisation of Elementary Education is still a distant prospect in substantial parts of the globe, including India. Under such circumstances, Sarva Shiksha Abhiyan (SSA) was launched in India in 2001 to extend useful and quality elementary education to all children in the age group of 6-14 years before the end of 2010. It has been able to bring the children to school but has failed to retain them and high incidence of drop out emerges to be the most critical problem facing the Indian education scenerio. The present paper explores the trends in school drop out, reasons behind leaving schools, how programmes and policies have fared in reducing school drop-out, and how to make these policies more effective. To bring to light factors that push children out of school and thereby suggest policies, we have undertaken a Field Survey in selected rural areas of West Bengal. Low level of income emerges to be the most crucial factor responsible for the incidence of out of school children. Other factors include insufficient educational infrastructure, lucrative earning opportunities for the children, lack of consciousness among the parents etc. It seems that time has come to refocus and reorient the operation of SSA, transforming it from an infrastructure based approach to a facilitating approach. A targeted approach should be taken whereby different policies should be formed for retention of different age-groups of children in schools. The gender and regional dimension should also be taken into consideration and policies must reflect local socio-economic conditions. A concerted approach with economic growth, poverty eradication and expansion of elementary education going hand in hand is the need of the hour.
Key Words: Education, Elementary Education, Out of School Children. JEL Classification: H52, I20, I21, I22, I28, P36.
___________________________________
I. INTRODUCTION
Throughout the world ensuring formal education to all children has been an area of lively debate for
about a decade with many different viewpoints on the issue. The Millennium Development Goals
(MDG) also speaks of Universalisation of Primary Education and Promoting Gender Equality in
Education. In spite of all the rhetoric, universal access to basic education still remains an unfulfilled
pledge in many parts of the world, despite pronouncements at various international fora. The World
Declaration on Education for All, the Framework for Action to Meet Basic Learning Needs, the E9
Declaration for Education for All, and the 40-year old Universal Declaration of Human Rights were
aimed at giving prominence to basic education. The Jomtien Conference of 1990 established the goal
of achieving basic Education for All (EFA) by the year 2000 and provided an expanded vision for
basic education, to include early childhood care and education, programs for out-of-school children
and literacy programs for adults. The Declaration laid emphasis on equity in providing access to every
child, youth and adult as also quality in schooling to ensure acceptable learning levels. The
non-Governmental organizations, the private sector, and local communities. Sadly, Universalisation of
Elementary Education (UEE) is still a distant prospect in substantial parts of the globe, including
India. About a decade back, in 1999-2000, only 69 per cent of rural children (aged 6-14 years) and 83
per cent of urban children in India were going to school, the percentages being further lower if we
include children up to 16 years, the age by which students complete school education in India. Under
such circumstances, Sarva Shiksha Abhiyan (SSA) was launched in India in 2001 to extend useful and
quality elementary education to all children in the age group of 6-14 years before the end of 2010.
While it has been fairly successful in improving the Enrolment rates, only marginal dent has been
made in the Drop-out rates. The core issue is therefore now is how to retain children in schools and
reduce the magnitude of Out of school children (OOSC). The present paper, using both secondary
data at national level and primary data from selected areas of rural West Bengal, explores the trends in
school drop out, reasons behind leaving schools, how programmes and policies have fared in reducing
school drop-out, and how to make these policies more effective.
II. TRENDS IN ENROLMENT AND DROP OUT
As has been mentioned, SSA has been flagship programme to achieve the MDG of Universalisation
of Elementary Education (UEE). This programme includes specific schemes for the development of
pre-primary education, education of female children, education of children belonging to SC/ST
community, education of mentally and physically challenged children, education of the school
dropouts and the education of the displaced children. School lunch programme, Computer education
at the elementary level, activity oriented education, education through ‘Bridge Courses’, ‘Remedial
Courses’ and ‘Back to School Camps’ are some of its other schemes. The Government of India
implements the Sarva Shiksha Abhiyan (SSA) in partnership with the State Governments/ Union
Territories and the local self- Governments. The modus operandi of SSA was to start informal
educational centres in regions and hamlets not served by formal schools, run short-term camps for Out
of School Children so that they can be brought back to formal schools, improve infrastructure in
existing formal schools to make it a better and attractive place for children, and fund appointment of
Shikhsa Sahayikas to supplement the number of teachers. The SSA targeted the Physical factors like
school infrastructure – both physical and human. During ten years of its operation since 2000, Rs5700
billion has been allocated to SSA through Union Budgets from 1999-2000 to 2009-10. This has
enabled the SSA to finance construction of 248465 school buildings and 978738 additional
classrooms in existing schools by March 2009. To equip more and more schools with basic amenities,
189729 schools were provided with drinking water facilities and 263899 schools with toilet facilities.
986 thousand new teachers were recruited during this period to solve the problem of under-staffed
schools and high student-teacher ratio. The scheme succeeded to a large extent, and by 2004-05
prevalence of elementary school attendance among corresponding age-group children increased to
Survey). In addition, another 1.6 million children were going to school in a subsidiary capacity,
mostly to informal centres under SSA, after completing their principal activity outside school. It is
observed that over the period 2001-2008, Net Enrolment Ratio increased from 64.2 to 98.6 percent at
the primary level and from 49 percent to 56 percent at the middle level (Table 1). The drop-out rate on
the other hand has decreased from 40 percent to 25 percent at the primary level and from 56 percent to
46 percent at the middle level during this period. Thus the success of SSA has mainly been
concentrated to the area of enrolment, and that too at the Primary level, with transition to Middle level
remaining poor. It is evident that there is no significant improvement in the area of dropout, both at
the Primary and Middle levels, but more so at the latter stage. A state level analysis shows that more
than 70 percent students drop out in the states of Bihar and Assam, and more than 60 percent drop out
in the states of Rajasthan, Orissa, West Bengal, Sikkim, Mizoram and Meghalaya before completing
Middle level of schooling. In Andhra Pradesh and Arunachal Pradesh this figure exceeds 50 percent.
More than 40 percent of the students drop out even before completing the primary level of education
in the states of Bihar, Assam, Manipur, Meghalaya, and Mizoram. Drop-out rates at Primary level are
more than 30 percent in West Bengal and Uttar Pradesh. Thus the goal of SSA to provide quality
education to all children in the age group of 10-14 years by the year 2010 has yet to travel a long
distance. Positive correlation between spatial spread of primary schools (measured by number of
primary schools per thousand square km) and incidence of School Attendance seems to indicate that indeed physical infrastructure has a major role to play in retaining children in schools (Table 2). That
current policies and programmes like SSA has been fairly successful in bringing children to
educational centres is therefore acceptable. The question that arises now is how to retain the children
in formal schools after they come out of the ambit of informal centres run by SSA. This is an
important issue since the purpose of SSA will be defeated if children continue dropping out of formal
schools and swell the numbers of OOSC, perpetuating the clientele of such alternate institutions
which are typically short term and remedial in nature.
III. WHY CHILDREN DROP OUT?
It is argued that in developing countries with inadequate educational infrastructure, poverty,
inequality, social norms, credit-land-labour market imperfections, high fertility and unpredictable
employment scenario, children drop out of schools at an early age. Schools are too far, often in
dilapidated buildings if any, with handful of teachers and dearth of facilities like drinking water and
toilets, making education an ordeal for the children. Timings of formal schools are rigid and often in
conflict with other activities of children, especially in rural areas. Even when children do go to school,
they do not find any incentive in completing school stages since post-school employment scenario is
bleak and there are no significant additional returns to school education. All these factors interplay to
This has expanded the school education system by a substantial magnitude and increased the
enrolment and attendance among children to 97 per cent in Primary stages and 55 per cent for Upper
Primary stages in 2009.
The success of SSA in creating more educational centres and bringing children to school over the last
decade vindicates this view. However, will this be sufficient in ensuring full term schooling among
children? Perhaps not, as SSA has failed to address the social and economic issues related to school
drop out. A significantly negative association between levels of Poverty and incidence of School Attendance at the macro level indicates that poor children are more often not sent to school in spite of the infrastructure being in place. Thus fulfilling only the physical targets as set by SSA are not
sufficient to ensure that the children complete schooling. More comprehensive policy formulation
addressing issues like poverty alleviation, employment generation for adults, discouraging child
labour, flexible formal school timings, with emphasis on retention are crucial in achieving the MDG
of Universalising Education.
IV. OUT OF SCHOOL CHILDREN – INTERPLAY OF SEVERAL FACTORS
1. Survey Background
As has been already noted, apart from the areas targeted by SSA, various other factors keep children
out of school. To bring to light these factors that push children out of school we have undertaken a
Field Survey in selected rural areas of West Bengal. This would help us in identifying the problems
faced by the stakeholders and their actual requirement. We interacted with the out of school children,
their parents, NGOs, Self Help Groups and Administrators of several programs to elicit information
and arrive at policy conclusions. The first part of the Field Survey (Survey-I) was carried on in
selected rural areas of four districts of West Bengal – Bardhaman, Birbhum, Bankura, and Purulia.
While Bardhaman is considered as a developed district, Birbhum and Bankura are moderately
developed districts, while Purulia is a declared backward district. Such a selection enables us to
understand the role of economic condition in affecting children’s schooling status. Survey was
conducted through a set of Structured Questionnaires in the Households, mainly to identify children
engaged in different activities. The second part of the survey (Survey-II) was a more intensive one
and was undertaken in Bardhaman and parts of Purulia district to critically examine the situation of
children who are out of formal schools, their background characteristics, their reasons for not
attending formal schools etc. In addition, various stakeholders like Government Officials, NGOs,
members of SHGs and PRIs, and Administrators of Formal Schools and Informal education centres
running under various schemes of the government were interviewed to elicit information and opinion.
The broad findings and their implications are discussed below. But first we discuss some background
2. Children in Formal Schools
If we consider secondary data obtained from District Information on School Education (DISE, 2009), it is observed that the in the densely populated district of Bardhaman, which is highly developed in
both agriculture and industry, the spread of schools per thousand population is low compared to other
districts. This results in lower enrolment ratio both at primary and middle levels. Though the basic
amenities of the existing schools are better compared to other districts but that seems to be of lesser
importance in attracting children to school. The availability of job in the highly developed agricultural
sector and high incidence of land ownership may also have some contribution in this regard. In
addition, enrolled students have a higher drop out rate compared to the other districts. On the other
hand, in the comparatively less populated and less developed district of Puruliya the spread of schools
per thousand population is higher, leading to higher enrolment. Though this district lags behind
Bardhaman with respect to the basic amenities in the existing schools but that does not seem to have
much impact on the incidence of enrolment in the district. However, drop out at the primary stage is
also very high in Purulia, indicating that students get enrolled but very often leave school before
completing primary schooling. Though surprising, higher enrolment in Purulia can also be attributed
to some extent to the underdeveloped nature of the district with very little availability of alternative
job opportunities whereas in Bardhaman such opportunities are quite common. It thus seems that the
availability of alternative job opportunities is an important factor in determining the children’s
schooling status. Availability and accessibility of educational infrastructure especially in terms of
distribution of schools per thousand population also emerges to be another important factor. The other
two districts of Bankura and Birbhum exhibit enrolment figures in between Purulia and Bardhaman
for the primary stage, and higher enrolment for the middle stage. Drop out rates in Bankura and
Birbhum are lower than the other two districts for primary stage and at par for the middle stage.
However these findings are based on DISE data, which reflects mostly the formal schooling system
since reporting under DISE by private schools is very rare in West Bengal. In our field survey we
have also taken into consideration the informal schooling system under SSA and hence obtained a
marginally different picture. These we discuss in the next section. The descriptive structure of the
Field Data is depicted in Table 4.
3. Survey Findings
i) Estimates of OOSC
Table 5 provides estimates of OOSC from Survey-I field data. It is observed that about 19 per cent of
our surveyed children are out of school, of which two-fifths are working while the rest are neither
going to school nor working. In sharp contrast to the enrolment figures obtained from DISE, the
incidence of OOSC is highest in the backward district of Purulia, followed by Bankura and Birbhum,
and least in the developed district of Bardhaman. The informal wing of the SSA is found to be
Camps, etc. As a result the quantum of OOSC reduces to a large extent when informal schooling is
taken into consideration. In the district of Purulia on the other hand, intense poverty dominates over
all other factors and children are withdrawn from school. It is also found that while incidence of work
is more among boys compared to girls, being ‘Nowhere’ is more among girls than boys, especially for the 10-14 year age group. It is thus evident that girls are sooner withdrawn from schools while boys
continue their education a bit longer.
ii) Linkage with School Infrastructure
We examined whether the incidence of OOSC is related with the lack of school infrastructure –
absence of schools, distance of schools, lack of facilities in schools, etc. It was earlier noted that when
only enrolment and drop out from formal schooling system was considered on the basis of DISE data,
educational infrastructure in terms of distribution of schools per thousand population emerged as an
important factor in determining the educational status of the children but other amenities seemed to be
of lesser importance. But when we consider informal schooling system also and look at the OOSC, we
find that magnitude of OOSC seems to be negatively linked with school facilities in the district.
Districts with better facilities are also those with lesser incidence of OOSC. It may also be noted that
many of the informal schools share the infrastructure of the formal schools. As most of them have
flexible schooling hours, such sharing can be done very conveniently. Such pooling of resources is a
novel experiment of SSA and needs to be replicated elsewhere. Lack of educational infrastructure
emerges to be another major problem. However it seems that we have crossed the stage of acute
shortage of basic physical infrastructure. Most of the schools have their own buildings and mid-day
meals are served in most of them. The problems being faced right now are qualitative in nature. In an
overwhelming majority of the primary schools there is acute shortage of teachers. Most of them go to
private tutors to succeed in their class exams. This schooling system can hardly develop any interest
among the students towards their studies. Most of the students come to school for the purpose of
having the mid-day meal. It seems that the schools are failing to serve their actual purpose. Perhaps
this is leading to high dropout rates. A more effective schooling system with adequate number of
teachers and a better rapport between the teachers and the students can make the process of imparting
quality education easier. A favourable teacher student ratio and more initiative on the part of the
teacher can play a very vital role in this respect. --- Table
iii) Linkage with Poverty
During the field visits, it was evident that the parents generally want their children to attend school
and continue education but are most often left helpless because they lack adequate income. Thus
poverty seems to have a very vital role in determining the status of the children. Field experience
suggests that rather than incidence of poverty (most often measured by Head Count Ratio), intensity of poverty is more important in pulling children out from school. This is supported by the fact that
poverty, indicated by Income Gap Ratio, is much higher (Table 6). Moderate level of poverty prepares the ground forwithdrawing children from school but may not ensure that she will be engaged as child
labour and can do so only in presence of factors like lack of educational infrastructure, availability of
earning opportunities for the children (where income earned is directly proportional to the labour
hours spent, as the parents intend to earn as much as possible by maximising the family labour, e.g. in
the mining areas and the brick kilns of Bardhaman district). On the other hand, acute poverty of the
nature observed in Purulia is sufficient to remove children from schools. In this case the children are
engaged in some or other remunerative jobs even in presence of accessible educational infrastructure
and in absence of lucrative earning opportunities for the children. Even if they are provided free
education and incentives to continue education through various government schemes like National
Child Labour Mission, alternative educational centres under SSA, etc. they are often found to attend
only the non-formal centres, and tend to drop out again when they are put into formal schools on
completion of such courses.
Lack of local earning opportunities also affects children’s schooling through the process of migration.
In backward districts of Bankura and Purulia, people migrate to neighbouring districts during busy
agricultural season in search of employment. The children often accompany their family as both
parents migrate and therefore discontinue schooling. Once they return the child can not keep pace
with the formal school and drop out.
It is therefore evident that intensity of poverty is an important factor responsible for the persistence of
OOSC, any employment-generating scheme that augments earning of the parents would be immensely
helpful in combating this problem. Effective operation of NREGS, Formation and successful
operation of SHGs, Proper implementation of SGSY, etc. may be very helpful. In this respect
collaborative approach with the governmental and non-governmental organisations working together
can make the operation highly successful.
From our study, low level of income emerges to be the most important factor responsible for the
incidence of out of school children. Thus income generation at the local level appears to be the most
important policy implication of this study. Various income-generating schemes are already in
operation – National Rural Employment Guarantee Scheme being most significant among them.
However in many cases it cannot be implemented properly due to various factors. In the developed
regions the market daily wage rate is higher than the wage rate paid by NREGS leading to lack of
labour supply. This not only causes non-utilisation of funds but also deprives the region of the
infrastructure that are supposed to be built under this scheme. In the underdeveloped regions on the
other hand the supply of labour outstrips the labour demand generated by the scheme. This mismatch
between demand and supply of labour acts as a detrimental factor to successful operation of this
scheme. Moreover in many cases the households suffering from acute poverty and lack of
employment have not been able to get the Job Cards due to various local factors and hence are not
directly to Bank Accounts or Post Office Accounts of the labourer, in many cases there are instances
of late payments. More effective operation of these schemes can go a long way in solving the problem
of school drop out through income generation to the parents and creation of local earning
opportunities and tackling migration.
Different regions have different comparative advantages depending on the availability of natural
resources. A decentralised approach of income generation depending on the potential of the specific
region is the need of the hour. For example, in agriculturally developed areas stress may be given on
animal husbandry, handicrafts, and textiles; whereas in mono-cropping dry land areas schemes must
focus on creation of check-dams, rain-water harvesting and watershed development for
multi-cropping. Formation of various Self Help Groups may also play a very vital role in this respect. A
co-ordinated approach between governmental and nongovernmental organisations is the need of the hour.
Though some instances of success are already there, they should be more widely replicated.
iv) Children’s Job Availability
While poverty creates an enabling atmosphere, lucrative earning opportunities also attract children out
of school in some regions. For example in the mining areas, the children are often found to be
engaged in illegal collection of coal etc. As a result, during Survey-II, it was observed that in the
western region of Bardhaman, which is predominantly a mining area, more than 32 per cent of the
boys are out of school because of their engagement in earning opportunities (Table 7a and 7b). Most
of the jobs being of illegal mining, engagement of girls is not that high here. On the other hand, in
agriculturally developed areas, there are twin roles of children – either they are working themselves in
the field or they are engaged in domestic duties while their parents are working in the field. As a
result, both Household work and Working to earn are important reasons for being out of school. It is
however to be noted that while common perception is that Domestic duties would be an important
reason for Girls being out of school, in our survey Financial problem emerges to be the main culprit.
It appears that the parents perceive that they are not financially sound enough to spend both for
educating their daughters as well as their marriage. As a result they sacrifice the former for the latter.
In the regions with dense forest cover children are often found to be engaged in firewood collection
and collection of different kinds of leaves both for self-consumption as well as for the purpose of
selling. This also induces parents to withdraw children from schools. In some cases the cartels are so
strong that administrative intervention are also unable to resist the forces effectively. Apart from lack
of educational infrastructure, lucrative earning opportunities for the children is encouraging them to
drop out and become child labourer, as evident from our field survey. In these cases not only are the
children deprived of their childhood and blooming of their inherent potential but also face severe
health hazards. Thus both their physical and mental developments are adversely affected. Stronger
enforcement of the child labour prevention acts is necessary. There is no dearth of such laws but we
role of enforcing the laws on one hand and also build up consciousness among the people regarding
the evil effects of the incidence of child labour should be put in place. Some compensation scheme for
rehabilitation of the working children can make the job easier. Awareness building by children
themselves, like the few girls in Purulia who have been able to create a wave of admiration and
emulation, is also an important part of the strategy.
v) School System and Child Labour
Apart from poverty, a major reason behind high incidence of school dropout and therefore No-where
children is the inefficiency of the formal schooling system. The children very often are utterly
disinterested to go the nearby primary schools and are often scared of the teachers. In many cases
these schools suffer from acute shortage of teachers also, and for a single teacher to manage 4-5
classes becomes an impossible feat. Students learn nothing and teachers wield the stick just to
maintain some sort of discipline. Thus even the provision of mid-day meals cannot prevent the
children from dropping out. In our survey, 18 per cent of boys and 12 per cent of girls in Bardhaman
district say that poor school environment and ill treatment by teachers are reasons for their dropping
out.
The informal schooling system (e.g. Sishu Shikhsa Kendras, NCLP schools, Bridge Course Centres)
on the contrary is found to be much more effective not only in developing interest among the students
but also motivating the dropouts to join these schools and continue their education. The personal
rapport of the students with the teachers plays a pivotal role in successful operation of these informal
schooling systems. There are 605 Bridge Course Centres in Bardhaman district operating under Sarva
Shikhsa Mission. Managed by the Gram Panchayats and Village Education and Health Committees,
they have been tutoring 13 thousand of the total 35 thousand out of school children in 2007-08. So far
they have been able to mainstream 5000 of these children. Given the fact that these centres operate
only for 9 months a year there is no doubt that they are doing a very good job. Most significant
success of the scheme is that the learners are now attracted towards education and they want to
continue their studies. In Purulia district, working ‘out of school ‘children have been brought under
the National Child Labour Project and it is found that the NCLP schools are doing a very good job in
bringing the out of school working children back to school, who ultimately are mainstreamed and
admitted to formal schools. Various innovative techniques are used by these schools to provide not
only general education but also some amount of vocational training. In 90 special schools under this
scheme, quality education is provided to the withdrawn child labourers through participatory learning
methods. The objective is to make the special schools child friendly and to make learning joyful to the
students. As a result, in less than two years, more than 1000 students have been mainstreamed, and
there is not a single case of drop out from formal schools among the students coming from NCLP
schools so far. The NCLP schools have been able to motivate the children to fight social evils as well.
obtaining special prize from the Honourable President of India. They are now working actively to
create awareness against child work and early marriage.
V. CONCLUDING COMMENTS
It is thus evident from our Field Study that the crucial areas that require intervention are Employment
creation & Income generation for the adults, Revitalising the Education system through out of the box
non-formal methods, and Prevention of engagement of children in work. While various policies have
been adopted in these areas and numerous schemes are operative, some modifications and
streamlining seems necessary to make them more effective. Some of them are discussed below.
The problem of Out of School Children is deeply rooted in the socio-economic structure of our nation.
Children are out of school because of various reasons – poverty and lack of educational infrastructure
emerging to be most important among them. Factors like availability of lucrative job opportunities for
the children, lack of consciousness among the parents, gender discrimination, etc. are also very much
prevalent. The reasons vary across regions. Whereas in the agriculturally developed regions out of
school children substitute adult labour doing domestic duties and also working in family farms, in the
backward areas they emerge to be Nowhere Children who neither have the economic condition to carry on their education, nor have sufficient employment opportunities. While SSA has been able to
improve enrolment situation it has not been able to stem drop out as evident from high incidence of
Out of School Children.
It was also observed during field visits that some groups or classes are disadvantaged compared to
others. Special schemes for these backward classes whereby their characteristics are both preserved
and modernised, and schemes are tailor-made to suit their livelihood pattern may go a long way in
removing this disparity.
While boys are withdrawn from school and sent to work, the initial brunt falls on the girls who are
withdrawn much before their brothers to simply stay at home and help their mothers. Thus incidence
of No-where children is much more among girls. To do away with such gender disparity, building up
consciousness among the people in general and the parents in particular is necessary.
At the conclusion it may be stated that it is now necessary to refocus and reorient the operation of
SSA, transforming it from an infrastructure based approach to a facilitating approach. Rather than
merely improving entry, the focus must now shift to retention. A targeted approach should be taken
whereby different policies should be formed for retention of different age-groups of children in
schools. The gender and regional dimension should also be taken into consideration and policies must
reflect local socio-economic conditions. A concerted approach with economic growth, poverty
eradication and expansion of elementary education going hand in hand is the need of the hour and
perhaps better coordination between Rural Development Schemes, NREGS, Sarva Shikhsa Abhiyaan
and child labour eradication programme through spread of NCLP schools will succeed in securing a
_______________________
[Major part of the Field Survey was undertaken by the author during 2008 and 2009. The author acknowledges
Financial Support received from University Grants Commission for this Research Project. For some of the data
used in the paper, the author is grateful to Professor Pinaki Chakraborti and Dr Rajarshi Majumder of University
of Burdwan for permitting the use of some Field Data from projects under their supervision. Responsibilities for
the analysis and inferences drawn are of the author.]
References
NSSO (2005) - Unit Level Records on Seventh Quinquennial Survey on Employment and Unemployment in India 2004-05, NSS 61st Round - July 2004-June 2005, National Sample Survey Organisation, Government Of India;
MHRD (2002) – Selected Educational Statistics, Ministry of Human Resource Development, Government of India (2001-02); [from http://www.educationforallinindia.com/selected-educational-statistics-2000-2001.pdf, accessed on 20th December, 2009]
DISE (2009) – District Information System for Education, State Report Cards, NUEPA [from http://www.dise.in/src.htm, accessed on 20th December, 2009]
Table 1
Enrolment and Drop Out Rates in Primary and Middle Levels
States
Net Enrolment Ratio Drop Out Rate 2000-01 2008-09 2000-01 2008-09 Pr Mid Pr Mid Pr Mid Pr Mid
A & N Islands 82.7 53.7 66.8 60.3 5.6 33.4 6.4 9.0 Andhra Pradesh 58.2 30.0 79.4 58.1 40.3 66.5 24.0 56.7 Arunachal Pradesh 71.2 38.8 - 75.1 50.2 64.9 30.4 54.0
Assam 77.9 43.5 - 71.7 33.7 69.8 44.3 73.6
Bihar 63.1 31.6 - 43.4 57.3 77.6 51.6 76.1
Chandigarh 65.5 68.1 72.8 59.2 0.0 0.0 22.5 36.9
Chhattisgarh 98.0 54.7 25.3 0.0
Dadra & Nagar Haveli 72.2 31.1 - 54.2 31.5 57.0 34.3 44.0
Daman & Diu 80.2 52.2 75.9 57.1 3.6 3.1 5.0 12.8
Delhi 76.8 81.7 90.6 70.5 5.7 15.2 0.0 23.5
Goa 78.9 57.3 56.3 44.4 8.6 10.1 - -
Gujarat 76.1 56.1 86.0 41.9 29.5 61.0 25.7 49.3
Haryana 67.8 50.4 71.6 51.1 14.6 31.0 9.3 0.0
Himachal Pradesh 82.3 64.1 91.2 80.7 35.4 26.4 6.8 4.5 Jammu & Kashmir 52.1 47.6 95.2 67.6 51.8 37.6 12.5 41.2
Jharkhand - 54.2 41.9 0.0
Karnataka 78.2 48.5 98.6 60.0 28.9 62.5 11.9 38.8
Kerala 77.2 82.0 65.3 66.0 0.0 0.0 0.0 0.0
Lakshadweep 87.6 54.3 84.6 64.7 2.7 24.9 - 0.0
Madhya Pradesh 76.3 37.2 - 64.2 19.0 47.2 0.0 48.4
Maharashtra 70.9 47.6 88.0 67.9 20.3 29.6 2.6 21.9
Manipur 89.6 67.3 - 69.0 43.3 43.1 45.7 41.2
Meghalaya 56.4 28.2 - 51.0 57.4 77.7 44.1 60.4
Mizoram 77.4 43.0 - 80.8 51.6 65.8 49.6 62.6
Nagaland 47.1 25.7 - 62.6 46.7 40.3 20.2 38.6
Orissa 72.9 43.9 95.5 61.4 36.1 62.8 27.8 62.6
Puducherry 90.7 87.2 85.2 79.4 -6.3 0.3 0.0 0.0
Punjab 72.6 54.6 59.7 49.6 22.5 29.9 9.9 29.9
Rajasthan 55.7 35.4 - 57.3 52.5 44.9 40.7 62.3
Sikkim 56.7 21.1 98.0 35.8 58.9 70.3 24.3 65.9
Tamil Nadu 78.1 86.9 99.3 90.5 41.1 43.2 8.0 0.0
Tripura 91.8 48.4 - 80.6 49.5 68.2 18.2 50.5
Uttar Pradesh 47.6 40.6 - 43.3 56.6 53.0 31.1 44.2
Uttarakhand 91.2 64.3 18.6 0.0
West Bengal 50.1 31.0 84.5 54.6 54.1 70.9 30.1 61.4
All States 64.2 44.8 98.6 56.2 40.3 54.5 25.4 46.0
Source: Author’s calculation based on DISE (2009), MHRD (2002). Table 2
Correlation of Children’s Status with Causal Variables Proportion of
Children
Povertya Primary Schoolsb
1993 1999 2004 1993 1999 2004
School Going -0.62* -0.64** -0.68** 0.31 0.17 -
Child Labour 0.09 - 0.18 -0.30 -0.27 -0.36*
Nowhere Children 0.66** 0.66** 0.65** -0.21 -0.10
Note: Based on State level data for the year 2004-05. ** indicates significant at 1% level, * indicates significant at 10% level, coefficients with significance level above 20% are not reported. a – Percentage of people below poverty line; b – Primary Schools per 1000 Square KM.
Table 3
District Profile - Schooling Facilities and Schooling Performance
Indicators Purulia Bankura Birbhum Bardhaman All WB
Primary Schools per 1000 pop 1.30 1.11 0.80 0.61 0.76
Middle Schools per 1000 pop 0.13 0.14 0.25 0.12 0.13
Villages with Primary School (%) 79.50 69.48 71.43 85.25 69.09
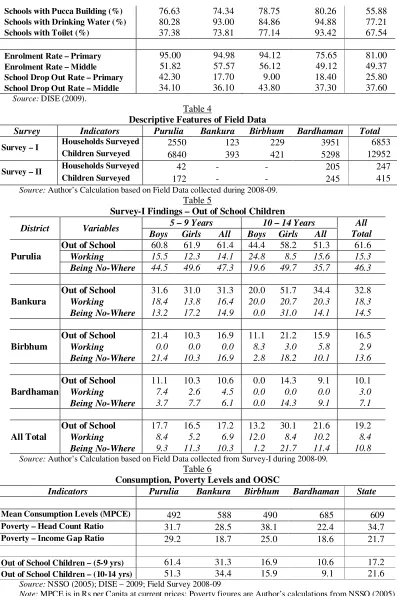
Schools with Pucca Building (%) 76.63 74.34 78.75 80.26 55.88
Schools with Drinking Water (%) 80.28 93.00 84.86 94.88 77.21
Schools with Toilet (%) 37.38 73.81 77.14 93.42 67.54
Enrolment Rate – Primary 95.00 94.98 94.12 75.65 81.00
Enrolment Rate – Middle 51.82 57.57 56.12 49.12 49.37
School Drop Out Rate – Primary 42.30 17.70 9.00 18.40 25.80
School Drop Out Rate – Middle 34.10 36.10 43.80 37.30 37.60
[image:14.612.108.505.62.658.2]Source: DISE (2009).
Table 4
Descriptive Features of Field Data
Survey Indicators Purulia Bankura Birbhum Bardhaman Total
Survey – I Households Surveyed 2550 123 229 3951 6853
Children Surveyed 6840 393 421 5298 12952
Survey – II Households Surveyed 42 - - 205 247
Children Surveyed 172 - - 245 415
Source: Author’s Calculation based on Field Data collected during 2008-09.
Table 5
Survey-I Findings – Out of School Children
District Variables 5 – 9 Years 10 – 14 Years All Total Boys Girls All Boys Girls All
Purulia
Out of School 60.8 61.9 61.4 44.4 58.2 51.3 61.6
Working 15.5 12.3 14.1 24.8 8.5 15.6 15.3
Being No-Where 44.5 49.6 47.3 19.6 49.7 35.7 46.3
Bankura
Out of School 31.6 31.0 31.3 20.0 51.7 34.4 32.8
Working 18.4 13.8 16.4 20.0 20.7 20.3 18.3
Being No-Where 13.2 17.2 14.9 0.0 31.0 14.1 14.5
Birbhum
Out of School 21.4 10.3 16.9 11.1 21.2 15.9 16.5
Working 0.0 0.0 0.0 8.3 3.0 5.8 2.9
Being No-Where 21.4 10.3 16.9 2.8 18.2 10.1 13.6
Bardhaman
Out of School 11.1 10.3 10.6 0.0 14.3 9.1 10.1
Working 7.4 2.6 4.5 0.0 0.0 0.0 3.0
Being No-Where 3.7 7.7 6.1 0.0 14.3 9.1 7.1
All Total
Out of School 17.7 16.5 17.2 13.2 30.1 21.6 19.2
Working 8.4 5.2 6.9 12.0 8.4 10.2 8.4
Being No-Where 9.3 11.3 10.3 1.2 21.7 11.4 10.8
Source: Author’s Calculation based on Field Data collected from Survey-I during 2008-09.
Table 6
Consumption, Poverty Levels and OOSC
Indicators Purulia Bankura Birbhum Bardhaman State
Mean Consumption Levels (MPCE) 492 588 490 685 609
Poverty – Head Count Ratio 31.7 28.5 38.1 22.4 34.7
Poverty – Income Gap Ratio 29.2 18.7 25.0 18.6 21.7
Out of School Children – (5-9 yrs) 61.4 31.3 16.9 10.6 17.2
Out of School Children – (10-14 yrs) 51.3 34.4 15.9 9.1 21.6
Source: NSSO (2005); DISE – 2009; Field Survey 2008-09
Note: MPCE is in Rs per Capita at current prices; Poverty figures are Author’s calculations from NSSO (2005)
Table 7a
Financial Problem 12.1 3.8 18.0 10.0
Household Work 18.1 34.6 8.0 20.0
Working to Earn 26.7 23.1 24.0 32.5
Poor Performance 3.4 7.7 4.0 0.0
Lack of Interest / Incentive 15.5 11.5 20 12.5
Parents not interested 6.0 3.8 10 2.5
Poor School environment / Ill
Treatment by Teachers 18.1 15.4 16.0 22.5
[image:15.612.135.479.196.320.2]Source: Field Survey, 2008.
Table 7b
Survey Findings (II) – Reasons for being Out of Formal School – Girls in Bardhaman Percent of Learners Total East Central West Left due to
Financial Problem 40.8 20.0 60.0 22.5
Household Work including Sibling Care 10.0 15.0 8.3 10.0
Working to Earn 10.8 25.0 6.7 10.0
Poor Performance 3.3 5.0 5.0 0.0
Lack of Interest / Incentive 10.0 15.0 6.7 12.5
Parents not interested 13.3 10.0 8.3 22.5
Poor School environment / Ill Treatment
by Teachers 11.7 10.0 5.0 22.5