A survey of enterprises
shows that benchmarking
will pay off.
W
e often take it on faith that best prac-tices yield better outcomes, but when it comes to best practices for managing application performance, do they? That is the question we set out to answer in Net-Forecast’s recent survey of 329 enterprises.The answer is: Yes indeed they do! Those who follow the best practices we identified for manag-ing application performance tell us they experi-ence significantly better application response times, faster performance problem resolution times and improved application availability. They are also more likely to uncover application perfor-mance problems before users call the help desk, and application performance is more likely to meet their business needs.
What Is APM?
Application performance management (APM) entails monitoring and managing the performance of software applications. With applications increasingly vital to business, it is important to manage and improve—not simply measure— application performance.
When all is said and done, it is the user’s expe-rience with an application that really matters, and the performance functions that users care about most are application availability and response time. Users must reach the application to do their work, and once there, they must be sufficiently satisfied with application interactions to remain productive and happy. Effective application per-formance management optimizes application availability and response time—and best practices help that happen.
APM Best Practices And Benchmarking
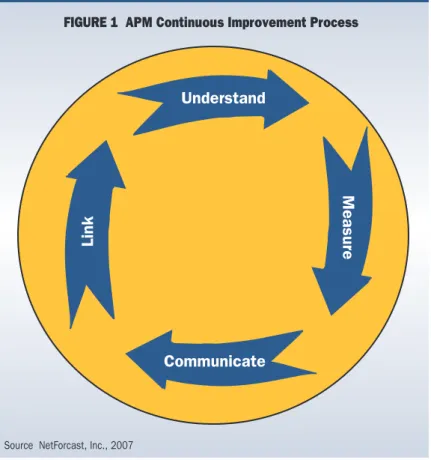
The four application performance management best practices shown in Figure 1 require an
enter-prise to understand, measure and communicate about application performance—as well as to link application performance to the business. Under-standing application performance entails knowing your applications and their requirements, your users and their requirements and your infrastruc-ture environment. This understanding needs to be coupled with accurately measuring key aspects of application performance, sharing relevant perfor-mance information with management, and ulti-mately working with business managers to make sure performance aligns with business goals.
The goal of APM best practices is to improve the performance outcome, and for the best out-come these best practices cannot stand alone. Each must be embedded into a continuous improvement process that ensures that application performance meets your business needs (as shown in Figure 1).
The process begins by understanding your user and application needs. Then you must measure data that reflects your understanding. The data is of little value unless you report it to relevant staff within your organization. Finally, the reports serve as input to link performance to key business needs. At that point, your IT and business groups engage in dialogue that improves your IT staff’s understanding of what is important and how to measure against the new objectives—and at that point the cycle restarts.
Dialogue is vital because the business group injects a contextual understanding about what really matters for application users, and that understanding enables you to measure the right things and set thresholds that will help you opti-mize performance where it counts most.
Benchmarking APM best practices provides a useful tool to assess how well you are doing. A benchmark score shows on a numerical scale how well you are implementing the four best practices shown in Figure 1. Benchmarking allows you to compare your own best practice implementations with the industry norm and with those who are executing well and achieving best results.
Peter Sevcik is president of NetForecast and is a leading authority on Internet traffic, performance, and technology. He can be reached at peter@ netforecast.com. Rebecca Wetzel is an associate of NetForecast and a veteran of the data networking industry. She can be reached at rebecca@
netforecast.com.
Application Performance
Management:
Best Practices Do Work
Peter Sevcik and Rebecca Wetzel
The APM Benchmarking Survey
In February of 2007, NetForecast surveyed 329 enterprises to characterize their current APM practices and to assess the results of those prac-tices. The participating enterprises represented more than 20 industries including: manufacturing, finance, government, health care, education and communications. Of the enterprises, about one-third have fewer than 500 employees, a one-third have 500 to 10,000 employees, and the remaining third have more than 10,000 employees. The survey was administered via the Web using an online sur-vey tool.
To determine the APM benchmarks, we asked enterprises a number of questions. We probed each of the four best practice areas with specific process or methodology questions. Among the questions were: how important a number of poten-tial performance attributes are to assessing appli-cation performance within the respondent’s orga-nization; whether they measure those attributes; and whether they set thresholds for their measure-ments.
We asked respondents who in their enterprises knows which applications and users are mission critical and how that information is communicat-ed within the organization. We also askcommunicat-ed respon-dents to describe their application performance tracking and reporting methodology, how and with whom performance information is shared, whether they apply application performance SLAs, and how they link application performance management to business priorities.
We analyzed each respondent’s answers to for-mulate an APM benchmark score for each of the four best practices on a 10-point scale, with 10 the best (highly organized and formal approach to performing the best practice) and 0
the poorest (no attempt to perform this best practice). We then aggre-gated the four individual best prac-tice benchmark scores into an overall best practice score for that enterprise. In the interest of brevi-ty, this article presents only the overall scores.
APM Survey Benchmark Results Figure 2 shows the distribution of the overall APM benchmark scores. The aggregated benchmark score for all surveyed enterprises is 4.3—just shy of the halfway point between 0 and 10. There is signifi-cant room for improvement within the surveyed population as a whole, but individual scores vary widely. Some enterprises already have relatively strong APM best practices in place while others have barely started down the path. Of the 329 enterprises
sur-veyed, just one receives top honors with a bench-mark score of 9, and three are at the bottom with scores of 1 or less. The survey population seg-ments into three groups: the bottom performers with scores of 3 or less, the middle, with scores between 3 and 5, and the top, with scores greater than 5. Each of these groups represents about one-third of the total survey population.
Understand
Measur
e
Link
Communicate
FIGURE 1 APM Continuous Improvement Process
Source NetForcast, Inc., 2007
0% 5% 10% 15% 20% 25%
9-10 8-9 7-8 6-7 5-6 4-5 3-4 2-3 1-2 0-1
Benchmark Value
Per
cent Enterprise
Bottom Third Middle Third Top Third FIGURE 2 Distribution Of APM Benchmark Scores
Higher Benchmark Scores Reflect Better APM Implementation
The survey results show positive correlations between benchmark scores and the best practices implementation. To illustrate differences in APM best practices implementation, let’s examine how our top and bottom benchmark scorers follow up to measure and set thresholds for perfor-mance attributes they describe as important.
We asked enterprises to rate the impor-tance of a number of performance attributes in assessing application performance. We then asked them if they measure those attrib-utes and if they set thresholds for them.
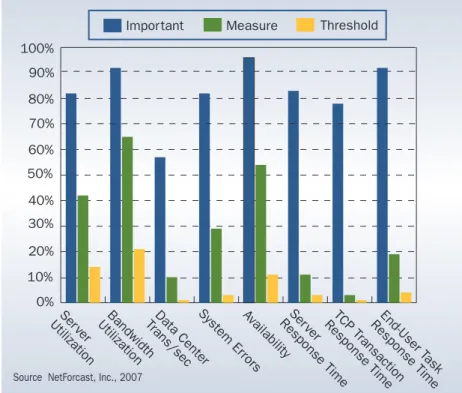
Figure 3 shows the answers for the top group, and Figure 4 shows the answers for the bottom group. The blue bars show the percent of respondents who rate each attribute as very or somewhat important, the green bars show the percent that actually measures the attribute, and the yellow bars show the percent that sets thresholds for the attribute.
Differences among the three bars indicate gaps between what enterprises say is impor-tant and their follow-through in measuring and setting thresholds that allow them to make practical use of the measurements.
The difference in APM follow-through between the top and bottom groups is strik-ing. To demonstrate this, look at Figures 3 and 4 and focus on gaps of 50 percent or more between the respondents who rate an individual performance attribute as impor-tant, and who also measure and set thresholds for that attribute. We see that there is a diver-gence between the top and bottom groups.
Figure 3 shows that in the top group only two 50-percent gaps occur—one for end-user response time (see far right) and one for serv-er response time. In the case of end-usserv-er response time, 95 percent of the top group cites this as an important APM function, while 58 percent measure it (a 37 percent gap), and only 38 percent set a threshold (a 57 percent gap).
In contrast, Figure 4 shows a different story for the bottom group. Data for the bot-tom group reveals a dozen gaps of 50 percent or more between what the group defines as important and the group’s follow-through! In fact, all the attributes have a 50 percent or greater gap between importance and thresh-old setting, and half have 50 percent gaps between importance and measurement.
These results reinforce the validity of benchmarking in assessing APM follow-through, because they show that poor bench-mark scores reflect weak best practices. The greater the gap between determining impor-tance and measuring performance, and then linking performance to business require-Because we collected more data than we have
available space in which to describe it, this article focuses exclusively on the bottom and top groups of performers. The overall benchmark score for the bottom group is 2.2, and for the top group it is 6.6.
0% 20% 40% 60% 80% 100%
End -User T
ask Response Time TCP T
ransaction Response Time Ser
ver Response Time
Availability
System Er
rors
Data Center Trans/sec Bandwidth Utilization Ser
ver Utilization
90%
70%
50%
30%
10%
Impor tant Measure Threshold
FIGURE 3 APM Implementation Follow-Through—Top Benchmark Group
Source NetForcast, Inc., 2007
0% 20% 40% 60% 80% 100%
End-User T
ask Response Time TCP T
ransaction Response Time Ser
ver Response Time Availability
System Er
rors
Data Center Trans/sec Bandwidth Utilization Ser
ver Utilization
90%
70%
50%
30%
10%
Impor tant Measure Threshold
FIGURE 4 APM Implementation Follow-Through—Bottom Benchmark Group
ments using thresholds, the weaker the APM best practices.
The data also illustrates that even the top per-formers have yet to fully integrate all four best practices into the APM improvement process shown in Figure 1. With the exception of band-width utilization, the bars for measuring and set-ting thresholds are markedly lower than the bars for importance.
Bandwidth utilization is perhaps the best understood, measured and linked function because it has been in the limelight the longest and has the greatest number of tools to measure it. It also has clear and direct costs associated with it, i.e. circuit lease charges.
Higher Benchmark Scores = Better Results The survey data shows that compared with their low-scoring counterparts, enterprises with the highest APM benchmarking scores provide better IT performance. They correct problems faster, experience faster application response times, experience better application availability, are more likely to find that application performance meets their needs, and are more likely to discover prob-lems proactively rather than reactively from users’ help desk calls.
(Note that the APM data shown here did not factor into the benchmark scores. The benchmarks rate the organization, while the results serve as independent assessments of conventional perfor-mance metrics.)
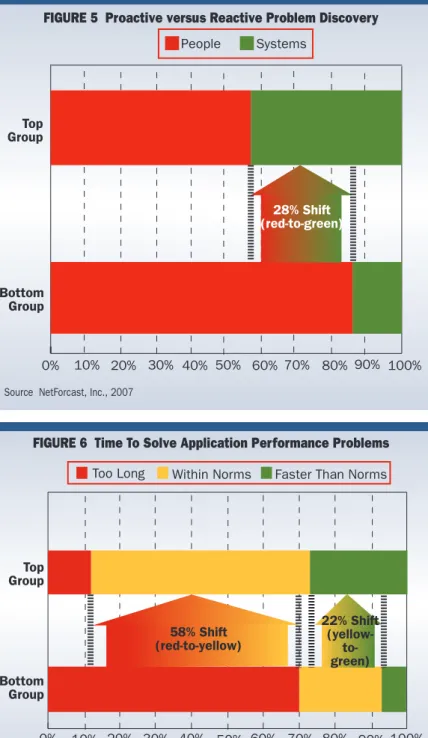
As Figure 5 shows, the bottom group learns about application performance problems using automated systems a mere 14 percent of the time, compared to a whopping 86 percent of the time in which they learn about problems from user calls. Once performance is so degraded that users reach for the telephone, user productivity and satisfac-tion are already diminished—not a desirable out-come.
The top group has a much better story to tell. They learn about application performance prob-lems from systems 43 percent of the time—a 28 percent improvement over the bottom group—and in contrast, the group learns about application per-formance problems from user calls 57 percent of the time.
In assessing time to correct application perfor-mance problems, the top group boasts dramatical-ly better results, as Figure 6 shows. In fact, the top group delivers this APM function 80 percent bet-ter than the bottom group!
Only 6 percent of the bottom group believes their application performance problem solving times exceed industry norms, compared to 28 per-cent of their top group counterparts—a 22 perper-cent positive shift from the bottom to the top group. A striking 70 percent of the bottom group feels that problem correction times are too long, compared to only 12 percent of the top group—a 58 percent positive shift.
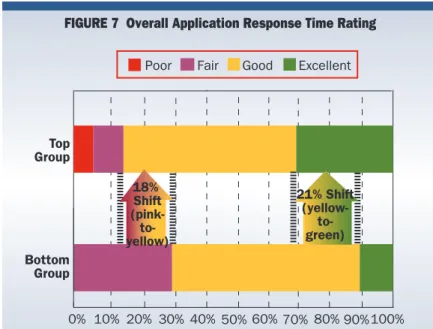
The survey results also show that the top group is delivering much more effective results for per-formance attributes directly affecting business productivity. For example as Figure 7, (p. 26) shows, only 11 percent of the bottom group rates overall response times for important applications as excellent, compared to 32 percent for the top group—a 21 percent positive shift between the bottom and top groups.
Another 18 percent positive shift exists between those in the bottom and the top groups who rate their overall application response times as only fair. In aggregate, response time ratings
0% 20% 40% 60% 80% 100%
28% Shift (red-to-green)
10% 30% 50% 70% 90%
Top Group
Bottom Group
People Systems
FIGURE 5 Proactive versus Reactive Problem Discovery
Source NetForcast, Inc., 2007
0% 10% 20% 30% 40% 50% 60% 70% 80% 90% 100%
58% Shift (red-to-yellow)
22% Shift
(yellow- to-green) Top
Group
Bottom Group
Too Long Within Norms Faster Than Norms
FIGURE 6 Time To Solve Application Performance Problems
0% 10% 20% 30% 40%50%60%70% 80%90%100% 18%
Shift
(pink- to-yellow)
21% Shift
(yellow- to-green) Top
Group
Bottom Group
Poor Fair Good Excellent
Source NetForcast, Inc., 2007
FIGURE 7 Overall Application Response Time Rating
0% 10% 20% 30% 40% 50% 60% 70% 80% 90% 100%
Top Group
Bottom Group
28% Shift (yellow-to-green) 22% Shift
(red & pink-to-yellow)
Deteriorated Not Met Our Needs Met Our Needs Improved
Source NetForcast, Inc., 2007
FIGURE 8 Business-Critical Application Peformance History
improve 39 percent for the top group compared to the bottom group.
It is worth noting that the top group appears more demanding regarding business-critical appli-cations performance than the bottom group, because some of them do report poor overall response times, while none in the bottom group report a poor showing. It is curious that none in the bottom group, which generally falls short delivering application performance, reports poor overall response time performance.
Figure 8 shows a 50 percent aggregate improvement in the ability of the top group to deliver application performance that meets busi-ness needs. When asked to look back at the past two years and assess the performance of their business-critical applications, 26 percent of the
bottom group says performance has improved and now meets the needs of their business, compared to 54 percent of the top group—a 28 percent pos-itive shift.
Thirty percent of the bottom group says the performance of their business-critical applications has not consistently met the needs of their busi-ness or has deteriorated so that it no longer meets their business needs. This compares to only 8 per-cent of the top group—a 22 perper-cent positive shift from the bottom to the top group.
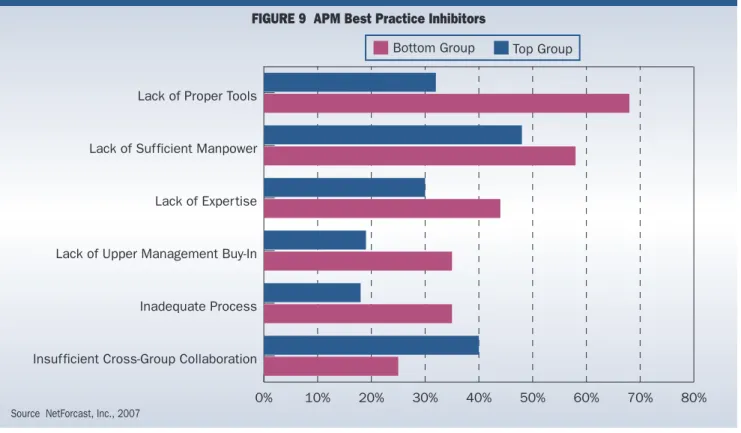
Impediments To Implementing APM Best Practices
We asked enterprises to identify impediments to improving application performance within their enterprise. Figure 9 shows the relative ranking of those impediments. Not surprisingly, the top group has more tools. But even though the top group is doing relatively well compared to the bot-tom group, they also encounter impediments.
In particular, they see the need for more staff and better cross-group collaboration as hampering APM best practices implementation. Notice that the bottom group does not perceive as strong a need for better collaboration, perhaps because they are not far enough along in their application performance best practices to uncover this as a problem area.
Conclusions
The NetForecast survey results indicate that we are in the early days of implementing APM best practices—and the state of the art is therefore far from exemplary. The overall APM benchmark is under 5, at 4.2, and even within the top group, benchmark scores fall off steeply. The overall benchmark for the top group is 6.6 while the bot-tom group is 2.2, with differences between the groups representing a 44 percent shift on the benchmark scale.
The survey shows a compelling relationship between better benchmark scores and better enter-prise business application performance. This indi-cates a worthwhile return on the investment required to improve your benchmark score. Our data reveals that the 44 percent higher benchmark scores for the top group are accompanied by 49 percent better business-critical performance results.
Also noteworthy is the relative ranking of the best practices within the bottom and top groups. As expected, all the individual best practice benchmark scores for the top group exceed the bottom group: however; within each group, the bottom group scores best at understanding while the top group is best at communicating.
Not only is it smart to implement APM best practices, it is important to benchmark your progress. But don’t expect too much at the outset. Most APM best practice implementations are nascent, and have vast room for improvement.
Even the top group has a long way to go to achieve benchmark scores of 9 or 10, but we pre-dict that it will happen with time, and that for these enterprises, it will be worth the effort. In
fact, we predict that the effectiveness shifts demonstrated in this study will become even more dramatic when the top group benchmark scores improve—as they will
0% 10% 20% 30% 40% 50% 60% 70% 80%
Insufficient Cross-Group Collaboration Inadequate Process Lack of Upper Management Buy-In Lack of Exper tise Lack of Sufficient Manpower Lack of Proper Tools
Bottom Group Top Group
Source NetForcast, Inc., 2007