Content-Based Image Retrieval
Using Multiple Features
Chi Zhang and Lei Huang
School of Economics and Management, Beijing Jiaotong University, Beijing, China
Algorithms of Content-Based Image Retrieval (CBIR)
have been well developed along with the explosion of information. These algorithms are mainly distinguished based on feature used to describe the image content. In this paper, the algorithms that are based on color feature and texture feature for image retrieval will be presented. Color Coherence Vector based image retrieval algorithm is also attempted during the implementation process, but the best result is generated from the algorithms that weights color and texture. 80% satisfying rate is achieved.
Keywords: CBIR, color histogram, texture, color coher-ence vector, color feature
1. Introduction
With the development of Internet technology in the past 10 years, more effort is required in the process of using information due to the infor-mation explosion. The development of search engine is a nice evidence of this. Google has be-come the world’s most innovative and dynamic IT Company because of their advanced search algorithms. However, most search engines are based on text retrieval. With the in-depth study in recent years, search algorithms have basi-cally been able to meet the needs of people on text information retrieval. Content-based im-age retrieval, on the other hand, is not quite satisfying due to high technical requirements. The existing image retrieval methods are mostly done by manually entering keywords, which is trivial for untagged image search. Especially with the popularity of handheld image acquisi-tion devices, people want to find similar images and learn about the details through their pho-tographed image instead of typing the keyword. Content-based image retrieval (CBIR) has be-come critical.
1.1. Introduction of CBIR
Content-based image retrieval (CBIR), also known as query by image content (QBIC) [6] and content-based visual information retrieval (CBVIR), are the applications of computer vi-sion techniques to the image retrieval problem, that is, the problem of searching for digital images in large databases. Content-based im-age retrieval is opposed to concept-based ap-proaches. The main research techniques include feature extraction, similarity measurement, im-age matching and user feedback[4].
“Content-based” means that the search analyzes the contents of the image rather than the meta-data such as keywords, tags, or descriptions as-sociated with the image. The term “content” in this context might refer to colors, shapes, tex-tures, or any other information that can be de-rived from the image itself. CBIR is desirable because searches that rely purely on metadata are dependent on annotation quality and com-pleteness. Having humans manually annotate images by entering keywords or metadata in a large database can be time consuming and may not capture the keywords desired to describe the image. The evaluation of the effectiveness of keyword image search is subjective and has not been well-defined. In the same regard, CBIR systems have similar challenges in defining suc-cess.
The term “content-based image retrieval” seems to have originated in 1992 when it was used by T. Kato to describe experiments in automatic retrieval of images from a database, based on the colors and shapes present [1]. Since then,
the term has been used to describe the process of retrieving desired images from a large collec-tion on the basis of syntactical image features. The techniques, tools, and algorithms that are used originate from the fields such as statis-tics, pattern recognition, signal processing, and computer vision[3].
The interest in CBIR has grown because of the limitations inherent in metadata-based systems, as well as the large range of possible uses for efficient image retrieval. Textual information about images can be easily searched using exist-ing technology, but this requires humans to man-ually describe each image in the database. This can be impractical for very large databases or for images that are generated automatically, e.g. those from surveillance cameras. It is also pos-sible to miss images that use different synonyms in their descriptions. Systems based on catego-rizing images in semantic classes like “cat” as a subclass of “animal” can avoid the miscatego-rization problem, but will require more effort by a user to find images that might be “cats”, but are only classified as an “animal”. Many stan-dards have been developed to categorize images, but all still face scaling and miscategorization issues[1].
Initial CBIR systems were developed to search databases based on image color, texture, and shape properties. After these systems were de-veloped, the need for user-friendly interfaces became apparent. Therefore, efforts in the CBIR field started to include human-centered design which tried to meet the needs of the user performing the search. This typically means inclusion of query methods that may allow de-scriptive semantics, queries that may involve user feedback, systems that may include ma-chine learning, and systems that may understand user satisfaction levels[3].
1.2. CBIR Techniques
Many CBIR systems have been developed, but the problem of retrieving images on the basis of their pixel content remains largely unsolved.
Query techniques. Different implementations
of CBIR make use of different types of user queries.
Query by example is a query technique that in-volves providing the CBIR system with an ex-ample image that it will then base its search
upon. The underlying search algorithms may vary depending on the application, but result images should all share common elements with the provided example.
Options for providing example images to the system include:
A preexisting image may be supplied by the user or chosen from a random set.
The user draws a rough approximation of the image he is looking for, for example with blobs of color or general shapes.
This query technique removes the difficulties that can arise when trying to describe images with words.
Semantic retrieval. The ideal CBIR system
from a user perspective would involve what is referred to as semantic retrieval, where the user makes a request like “find pictures of Abraham Lincoln”. This type of open-ended task is very difficult for computers to perform – pictures of Chihuahuas and Great Danes look very differ-ent, and Lincoln may not always be facing the camera or be in the same pose. Current CBIR systems therefore generally make use of lower-level features like texture, color, and shape, al-though some systems take advantage of very common higher-level features like faces. Not every CBIR system is generic. Some systems are designed for a specific domain, e.g. shape matching can be used for finding parts inside a CAD-CAM database.
Other query methods. Other query methods
include browsing for example images, navigat-ing customized/hierarchical categories, query-ing by image region(rather than the entire im-age), querying by multiple example images, querying by visual sketch, querying by direct specification of image features, and multimodal queries(e.g. combining touch, voice, etc.) CBIR systems can also make use of relevance feedback, where the user progressively refines the search results by marking images in the re-sults as “relevant”, “not relevant”, or “neutral” to the search query, then repeating the search with the new information.
Content comparison using image distance
mea-sures. The most common method for
similarity of two images in various dimensions such as color, texture, shape, and others. For ex-ample a distance of 0 signifies an exact match with the query, with respect to the dimensions that were considered. As one may intuitively gather, a value greater than 0 indicates vari-ous degrees of similarities between the images. Search results can then be sorted based on their distance to the queried image. Many measures of image distance have been developed[11].
Color. Computing distance measures based
on color similarity is achieved by computing a color histogram for each image that identifies the proportion of pixels within an image holding specific values(that humans express as colors). Current research is attempting to segment color proportion by region and by spatial relationship among several color regions. Examining im-ages based on the colors they contain is one of the most widely used techniques because it does not depend on image size or orientation. Color searches will usually involve comparing color histograms, though this is not the only technique in practice.
Texture. It measures visual patterns in images
and how they are spatially defined. Textures are represented by Texel which are then placed into a number of sets, depending on how many textures are detected in the image. These sets not only define the texture, but also where in the image the texture is located.
Texture is a difficult concept to represent. The identification of specific textures in an image is achieved primarily by modeling texture as a two-dimensional gray level variation. The rel-ative brightness of pairs of pixels is computed so that degree of contrast, regularity, coarse-ness and directionality may be estimated [7]. However, the problem is in identifying patterns of co-pixel variation and associating them with particular classes of textures, such as silky, or rough.
Shape. It does not refer to the shape of an
image but to the shape of a particular region that is being sought out. Shapes will often be determined first by applying segmentation or edge detection to an image. Other methods like [8] use shape filters to identify given shapes of an image. In some cases accurate shape de-tection will require human intervention because methods like segmentation are very difficult to completely automate.
1.3. Individual Understanding of CBIR
Our group considers that the CBIR requires more than the match of features of the whole im-age. Special cases need to be treated individu-ally.
Under some circumstances, we are more in-terested in specific object in the foreground or background. Meanwhile, we may also be inter-ested in detailed information in an inconspicu-ous corner instead of the whole image. These cases sometimes are extremely important clues for police to solve a certain case. If we blindly pursue whole features matching, features we are really interested in may be overshadowed by other irrelevant details. This may lead to non-match in the end.
Hence interactive image retrieval is more likely to meet the needs. The interactivity requires you to not only select the most satisfying results among a plurality of results in the end, but also operations (such as the mouse click) to select the interesting area or even a symbol. It can also be used to choose the most satisfying area in the results or to speculate on the user’s purpose, to adjust the relevant weight, to do more targeted search and produce more humanlike results.
Correct selection of appropriate features and the use of the mix of them is the key to feature-matching.
2. Feature Extraction
Feature extraction is a concept in computer vi-sion and image processing. In computer vivi-sion and image processing, a feature is a piece of information which is relevant for solving the computational task related to a certain applica-tion. Features may be specific structures in the image such as points, edges or objects. Features may also be the result of a general neighborhood operation or feature detection applied to the im-age.
Other examples of features are related to mo-tion in image sequences, to shapes defined in terms of curves or boundaries between different image regions, or to properties of such a region. The feature concept is very general and the choice of features in a particular computer vi-sion system may be highly dependent on the specific problem at hand.
2.1. The Selection of the Color Space
An important step of image processing is to choose the description method of image fea-ture. In terms of choosing description method and feature description, it is fundamental to de-termine the image color space.
A color model(e.g. RGB or CMYK)is an ab-stract mathematical model describing the way colors can be represented as tuples of numbers, typically as three or four values or color compo-nents. However, a color model with no mapping function associated to an absolute color space is a more or less arbitrary color system with no connection to any globally understood system of color interpretation.
Adding a certain mapping function between the color model and a certain reference color space results in a definite “footprint” within the ref-erence color space. This “footprint” is known as a gamut, and in combination with the color model, it defines a new color space. For exam-ple, Adobe RGB and sRGB are two different absolute color spaces, both based on the RGB model.
In the most generic sense of the definition above, color spaces can be defined without the use of a color model. These spaces, such as Pantone, are in effect a given set of names or numbers which
are defined by the existence of a corresponding set of physical color swatches.
Color space, in accordance with the basic struc-ture, can be divided into two categories, the primary color space and bright separate color space. The former includes RGB, the most typ-ical one, and other types such as CMY, CMYK, CIE and XYZ etc. The latter includes YCC / YUV, Lab, as well as a number of hue-based color spaces. Here is a simple comparison be-tween RGB color space and HSV space[10].
RGB Color Space. The RGB color space is an
additive color space in which red, green, and blue lights are added together in various ways to reproduce a broad array of colors. The name of the model comes from the initials of the three additive primary colors, red, green, and blue. The main purpose of the RGB color space is sensing, representation, and displaying images in electronic systems, such as television and computer, though it has also been used in con-ventional photography. Before the electronic age, the RGB color space already had a solid theory behind it, based on human perception of colors.
RGB is a device-dependent color space: differ-ent devices detect or reproduce a given RGB value differently, since the color elements(such as phosphors or dyes)and their response to the individual R, G, and B levels vary from man-ufacturer to manman-ufacturer, or even in the same device over time. Thus an RGB value does not define the same color across devices without some kind of color management.
Typical RGB input devices are color TVs, video cameras, image scanners, and digital cameras. Typical RGB output devices are TV sets of var-ious technologies (CRT, LCD, plasma, etc.), computer and mobile phone displays, video projectors, multicolor LED displays, and large screens such as Jumbo Tron. Color printers, on the other hand, are not RGB devices but sub-tractive color devices (typically CMYK color space).
This paper discusses concepts common to all the different color spaces that use the RGB color space, which are used in one implementation or another in color image-producing technology.
HSV Color Space. HSV is the most common
today in color pickers, in image editing soft-ware, and less commonly in image analysis and computer vision.
The representation rearranges the geometry of RGB in an attempt to be more intuitive and perceptually relevant than the Cartesian (cube) representation, by mapping the values into a cylinder loosely inspired by a traditional color wheel. The angle around the central vertical axis corresponds to “hue” and the distance from the axis corresponds to “saturation”. These first two values give the two schemes the ’H’ and ’S’ in their names. The height corresponds to a third value, the system’s representation of the perceived luminance in relation to the satura-tion.
In each cylinder, the angle around the cen-tral vertical axis corresponds to “hue”, the dis-tance from the axis corresponds to “saturation”, and the distance along the axis corresponds to “lightness”, “value” or “brightness”. Note that while “hue” in HSV refers to the same attribute, their definitions of “saturation” differ dramati-cally. Because HSV are simple transformations of device-dependent RGB models, the physi-cal colors they define depend on the colors of the red, green, and blue primaries of the de-vice or of the particular RGB space, and on the gamma correction used to represent the amounts of those primaries. Each unique RGB device therefore has unique HSV spaces to accompany it, and numerical HSV values describe a differ-ent color for each basic RGB space.
As it can be seen by both RGB and HSV color spaces designed that RGB is the “machine-oriented” color space, whose purpose is to en-able the machine to accurately describe the color, while HSV should belong to the “user-oriented” color space. After the test, HSV color space using the basic color histogram gave an amazing result, in the search of a single basic color, single object image. It produced more than 15 correct results in the search for a poker match on black background. The accuracy rate was also high in the search for an eagle or air-craft in the blue sky and the “error” result was the same basic color as the original image, the differences lay in the foreground objects. So here we choose HSV color space.
2.2. Image Feature Selection
In image processing, the concept of feature is used to denote a piece of information which is relevant for solving the computational task re-lated to a certain application. More specifically, features can refer to the result of a general neigh-borhood operation(feature extractor or feature detector) applied to the image, specific struc-tures in the image itself, ranging from simple structures such as points or edges to more com-plex structures such as objects.
Other examples of features are related to mo-tion in image sequences, to shapes defined in terms of curves or boundaries between different image regions, or to properties of such a region. A specific image feature, defined in terms of a specific structure in the image data, can often be represented in different ways. For example, an edge can be represented as a Boolean vari-able in each image point that describes whether an edge is present at that point. Alternatively, we can use a representation which provides a certain measure instead of a Boolean statement of the edge’s existence and combine this with information about the orientation of the edge. Similarly, the color of a specific region can ei-ther be represented in terms of the average color or a color histogram.
Color feature, texture feature, shape feature and characteristics of spatial relationship are com-monly used image features[9].
Color Feature. Color feature is the most
intu-itive and obvious feature of the image, and gen-erally adopts histograms to describe it. Com-monly used methods are based on color features: color histogram matching method, the color sets, color moments, color coherence vector, color related maps. Color histograms method has the advantages of speed, low demand of memory space and insensitivity to the images’ changes of the size and rotation, it consequently wins extensive attention.
Texture Feature. When it refers to the descrip-tion of the image’s texture, we usually adopt texture’s statistic feature and structure feature as well as the features based on special domain that are changed into frequency domain. This method uses Haar wavelet transform to extract the image texture features, which uses wavelet basis instead of Fourier basis to observe a whole signal space by scaling or shifting. The disad-vantage of the Fourier transform is its inability to reflect the local characteristics of the signal. Using Matlab’s own function, wavelet statisti-cal features in HSV space are statisti-calculated as basic texture features. Then we choose the appropri-ate distance metric (for metric see details) to obtain a more similar image as a result.
Besides the above-mentioned disadvantages of texture features, we still choose texture features as the image feature for the following reasons: 1. In this experiment, the problems listed above
were not a problem, because the images in the search image database were specially se-lected, with resolution 384∗256 or 256∗384. Effects of the same resolution on the actual results can be negligible.
2. The texture changes are affected by the light generated. The V property in HSV color space is the color of the bright. This “bright” does not mean the light intensity. There is no way to overcome this shortcoming tem-porarily. But later tests showed interesting results. After a preliminary color character-istics screening, the use of the texture fea-tures is better than the use of color feature or texture feature alone. Texture is an effec-tive approach when the search images have great differences in thickness, density, etc. Texture features are usually very difficult to accurately reflect human visual percep-tion between different textures. When the thickness, density and other texture informa-tion which are easy to distinguish are very close, the actual tests found that when all the images are part of an object (such as cell photomicrograph), adding texture infor-mation search results is significantly better than the color information alone. It also found that, in some cases, search results after adding texture information are worse than by using only color feature approach. These cases mainly occur in the search that has obvious difference between foreground and background. The background texture
information will lead to the search results to have the same background and different prospects. This problem is more serious than only occasionally using the color feature. In search of some oil painting images, which have a strong sense of reality, the texture in-formation will mislead the method to search the oil painting content instead to only search paintings.
Of course, different evaluation criteria of the search have different results. When you want to search for the oil content, the result is better. While for the other paintings, the same results will become poor. This situation exists in vari-ous methods.
Color Coherence Vector. As the depth
applica-tion of the color features, color coherence vector (CCV)[5]not only takes into account the num-ber of pixel points in different colors, but also the relative position information of the pixels [10]. Most of the early color features reflect the color information, but not the color spatial distribution. The effect is different for differ-ent distribution of pixels of the same color and quantity. Based on this consideration, the im-age feature information of the CBIR polymer-izes with color vector as an alternative feature [4].
Color coherence vector is an improved conven-tional histogram. The pixel points belonging to color bucket of the same color histogram are divided into coherence and incoherence, which refers to pixels of the same color distributed over the same area.
We can obtain color coherence vector through statistics of pixels of more or less the same color than the threshold value in each color. Algo-rithm uses eight colors of red, green, blue, yel-low, purple, blue, white and black.
3. Similarity Measure
This method is to rank previous search results by calculating the eigenvector distance of two images.
3.1. Taxicab Geometry
or metric of Euclidean geometry is replaced by a new metric in which the distance between two points is the sum of the absolute differences of their Cartesian coordinates. The taxicab metric is also known as rectilinear distance, L1 distance or 1norm, city block distance, Manhattan
dis-tance, or Manhattan length, with corresponding variations in the name of the geometry. The latter names allude to the grid layout of most streets on the island of Manhattan, which causes the shortest path a car could take between two intersections in the borough to have length equal to the intersections’ distance in taxicab geome-try.
The taxicab distance, d1, between two vectors
p,qin ann-dimensional real vector space with fixed Cartesian coordinate system, is the sum of the lengths of the projections of the line seg-ment between the points onto the coordinate axes. More formally,
d1(p,q) =||p−q||1=
n
i=1
|pi−qi| (1)
p = (p1,p2, . . . ,pn)and q = (q1,q2, . . . ,qn).
For example, in the plane, the taxicab distance between(p1,p2)and(q1,q2)is|p1−q1|+|p2− q2|.
The following chart shows search results in three methods with Manhattan distance: test1 is a painting of trees and peaks; test21 is a puppet on the white background; test33 is a micro-scopic structure of a cell; test38 is poker king; test64 is several flower mushrooms in the forest; and test212 is a beauty.
Test Color Color + Texture CCV
Test1(painting) 5 5 1
Test21(puppet) 14 14 8
Test33(cell) 2 2 0
Test38(poker king) 11 11 3 Test64(mushrooms) 6 6 1
Test212(beauty) 2 4 2
Table 1.Search results in three methods with Manhattan distance.
3.2. Euclidean Distance
In mathematics, the Euclidean distance or Eu-clidean metric is the “ordinary” distance be-tween two points that one would measure with
a ruler, and is given by the Pythagorean formula [2].
The Euclidean distance between points p and q is the length of the line segment connecting them(pq).
In Cartesian coordinates, ifp= (p1,p2, . . . ,pn)
andq = (q1,q2, . . . ,qn)are two points in
Eu-clidean n-space, the distance from p to q, or fromqtopis given by:
d(p,q) =d(q,p)
=(q1−p1)2+(q2−p2)2+. . .+(qn−pn)2
=
n
i=1
(qi−pi)2 (2)
The position of a point in a Euclideann-space is a Euclidean vector. So, p and q are Eu-clidean vectors, starting from the origin of the space, and their tips indicate two points. The Euclidean norm, or Euclidean length, or mag-nitude of a vector measures the length of the vector:
||p||=p2
1+p22+. . .+p2n=√p·p (3)
The following chart shows search results in three methods with Euclidean distance.
Test Color Color + Texture CCV
Test1(painting) 4 4 1
Test21(puppet) 11 11 7
Test33(cell) 6 6 0
Test38(poker king) 10 9 3 Test64(mushrooms) 2 2 4
Test212(beauty) 3 3 0
Table 2.Search results in three methods with Euclidean distance.
4. CBIR Using Multi Features
components by removing the square of Eu-clidean distance, while Manhattan distance con-siders more colors in search results, by with-drawing the reward towards less differentiated colors. In comparison to Euclidean distance, the Manhattan distance is preferable.
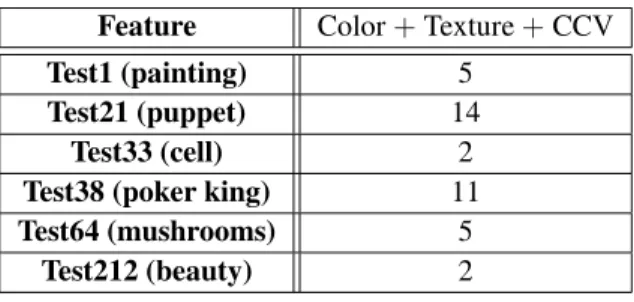
Using Manhattan distance as a measure, color features, texture features and color coherence vector as criteria(Color feature has an exagger-ation of 20 times, texture feature 4 magnifica-tion, distance of color coherence vector remains constant), the results are as follows:
Feature Color+Texture+CCV
Test1 (painting) 5
Test21 (puppet) 14
Test33 (cell) 2
Test38 (poker king) 11
Test64 (mushrooms) 5
Test212 (beauty) 2
Table 3. Search results in the integration of three methods in Manhattan distance.
In addition, due to the inconsistency in color and texture features metric, the calculation of the Euclidean distance will cause some addi-tional effects.
Therefore, Manhattan distance is chosen to mea-sure the distance. It is recommended to apply the measurement of methods’ similarity based on calculating the cosine value. More formally,
Sim(X,X) = X·X
|X| · |X|
X = (x1,x2, . . . ,xm), X = (x1,x2, . . . ,xm)
X·X =
m
i=1
xixi (4)
Several tests show the following results:
Remark 1. Color feature outperformed the other
features in relatively simple background and clear foreground objects, but texture features perform well when the photograph is part of an object.
Remark 2. Based on the selected criteria, color
and texture fused method performs better than others. Some search results of fused method
and single method have the same feature num-ber, but the ranked result of fused method has better feature under our requirements (When searching for poker King, high on the list are poker Jack, Queen, King). Experimental re-sults reveal that adding CCV does not improve the accuracy. It also shows that CCV com-putational experiments are based on the RGB color space at first, which failed to produce a satisfactory answer. Extraction process is time-consuming and the effect is not obvious, there-fore, CCV feature is removed(it took 3 days to extract 9500 images, each image only extracted 16-dimensional vector).
5. Image Matching
Feature extraction of selected images has been done previously and results are saved to .mat files.
Two options were considered during image match-ing:
1. Add appropriate weight values for distance calculation. Then matching results are de-termined by distance.
2. Obtain several former images as search re-sults using distance calculation with color feature and texture feature.
In “weights strategy” matching test, color fea-ture vector distance is magnified 10 times, tex-ture featex-ture vector distance remains unchanged. Color feature vector distance is magnified 20 times, texture feature vector distance is magni-fied 5 times. Color feature vector distance is magnified 20 times, texture feature vector dis-tance remains unchanged. The second method achieved the best results in the test.
In “priority color” matching test, 900, 500, 300, 100 and 50 are tested to select “n”. Searching
Strategy “Weightsstrategy” “Prioritycolor”
Test1 (painting) 5 4
Test21 (puppet) 16 16
Test33 (cell) 2 4
Test38 (poker king) 19 15
Test64 (mushrooms) 5 4
Test212 (beauty) 4 2
results become better as “n” decreases, which shows that color feature plays a more important role in selecting color and texture feature. Table 4 contains the results of different match-ing strategy.
6. Conclusions
Most of the experimental results are explained in the method selection process, the following section is brief review.
Figures 1 and 2 below show the screenshot of search results. Figure 1 is the result of the poker
Figure 1.The search results of Test38.
Figure 2.The search results of Test211.
King, and figure 2 is the result of the Six-color flag. Both of them have simple background. Satisfactory results are achieved when search-ing image is with simple background. But background contributes more to the result when searching object is in complex background. Ac-cording to Figure 3, searching results mostly have different foreground and similar back-ground.
Figure 3.The search results of Test55.
The method used in the experiment is relatively simple, and the model is conservative.
In this paper, we proposed a multi feature model for the Content-Based Image Retrieval System by combining the color, texture, and Color Co-herence Vector. Users were given options to select the appropriate feature extraction method for best results. The results are quite good for most of the query images which have simple background and it is possible to improve them further by tuning the threshold and adding rele-vance feedback. In this dissertation the Man-hattan distance is calculated between the two pixels of the matching images.
Acknowledgments
References
[1] J. EAKINS, M. GRAHAM,Content-based Image
Re-trieval. University of Northumbria at Newcastle, 2014.
[2] E. F. KRAUSE, Taxicab Geometry: Adventure in Non-Euclidean Geometry. Dover Publications Inc, January, 1987.
[3] M. S. LEW, N. SEBE, C. DJERABA, Content-based
multimedia information retrieval: State of the art and challenges. |it ACM Transactions on Multime-dia Computing, Communications, and Applications
(TOMCCAP),2(1) (2006), 1–19.
[4] F.-J. MENG, B.-L. GUO, Research on Content-Based
Image Retrieval Technology.Application Research of Computers,21(7) (2004).
[5] G. PASS, R. ZABIH, J. MILLER, Comparing images
using color coherence vectors.Proceedings of the fourth ACM International Conference on Multime-dia, ACM,(1997)pp. 65–73.
[6] Y. RUI, T. S. HUANG, S. F. CHANG, Image retrieval:
Current techniques, promising directions, and open issues.Journal of Visual Communication and Image Representation,10(1) (1999), 39–62.
[7] H. TAMURA, S. MORI, T. YAMAWAKI, Textural
fea-tures corresponding to visual perception.Systems, Man and Cybernetics, IEEE Transactions on,8(6) (1978), 460–473.
[8] F. TUSHABE, M. H. F. WILKINSON, Content-based
image retrieval using combined 2D attribute pattern spectra, Advances in Multilingual and Multimodal Information Retrieval. Springer Berlin Heidelberg, 2008.
[9] X. WANG, F. HU, H. YANG, Region-Based Color Image Retrieval Using Color and Texture Fea-tures.Journal of Chinese Computer Systems,28(2) (2007).
[10] Y. ZHANG, Y. XU, H. BAO, Offline Handwritten
Sig-nature Recognition Method Based on Multifeatures. JCIT,8(5) (2013), 538–546.
[11] H. EIDENBERGER, Fundamental Media
Understand-ing.Atpress,(2011).
Received:October, 2013 Revised:April, 2014 Accepted:July, 2014
Contact addresses: Chi Zhang School of Economics and Management Beijing Jiaotong University Beijing, 100044 China
e-mail:[email protected]
Lei Huang School of Economics and Management Beijing Jiaotong University Beijing, 100044 China
e-mail:[email protected]
CHIZHANGis a PHD candidate at the School of Economics and Man-agement of Beijing Jiaotong University. He was born in Zhengzhou, Henan, in 1990. He graduated from the Department of Automation En-gineering of the School of Electronic and Information EnEn-gineering at Beijing Jiaotong University in 2008. Since 2012, his main research in-terest has been Information management. His PhD mentor is Professor Huang.
LEIHUANGis a professor and PhD mentor at the School of Economics