http://www.sciencepublishinggroup.com/j/ajnc doi: 10.11648/j.ajnc.20170602.12
ISSN: 2326-893X (Print); ISSN: 2326-8964 (Online)
Design of Low Power WSN Node in Wild Environment
Lu Guoxiu
Department of Information Science, Beijing University of Technology, Beijing, China
Email address:
[email protected]To cite this article:
Lu Guoxiu. Design of Low Power WSN Node in Wild Environment. American Journal of Networks and Communications. Vol. 6, No. 2, 2017, pp. 47-53. doi: 10.11648/j.ajnc.20170602.12
Received: March 14, 2017; Accepted: April 6, 2017; Published: April 12, 2017
Abstract:
This paper proposes a wireless sensor node design method with anti-jamming and low power consumption, to achieve in the field of data collection and data processing. The overall block diagram of the node and the hardware design and software flow design are given. The field environment acquisition system is used as the application scenario. The wireless sensor network node designed by this method can effectively realize the function of the system and ensure the low power consumption and stability of the network. Experiments show that, through hardware design and software design, such nodes are deployed in wireless sensor network (wsn) particularly low power consumption, interference, stability, etc. This method can solve the problem of satisfying the deployment of WSN in the field environment for longer periods of time. It is hoped that the design of this paper will provide some reference value and significance for the later wireless sensor network deployment.Keywords:
Wireless Sensor Network(WSN), Node Design, Low Power Consumption1. Introduction
With the increasing use of wireless sensor network, wireless sensor networks need to be deployed in a large number of field environments and can be used to monitor specific environments in the field. In the wild environment after the first deployment of wireless sensor networks, the battery can not be replaced at any time and can not always maintain the network. The energy consumption of the node is greatly challenged, and the process of network work will be disturbed by the changing factors of the environment. Some of the environmental factors such as obstacle, vegetation, noise and electromagnetic interference are more prominent in the wireless sensor network The Therefore, to overcome the interference to provide battery life to reduce network power should be given priority to the problem. This paper can not only reduce the installation and maintenance cost of the wireless sensor network, but also increase the node time and provide the accuracy of the work of the node. The design of the wireless sensor network node is designed to reduce the cost of the wireless sensor network. [1]
2. Design of Anti - Jamming Low Power
Wireless Sensor Node
2.1. Overall Design
Based on the overall design of the node, the paper puts forward the basic principles and requirements of the node design. First, we study wireless sensor network nodes from hardware and software. In terms of hardware, the design choice of low-power devices maybe power modules design. In order to weaken the effects of interference factors in the environment, in the power module to achieve a reasonable cycle of battery and solar energy resources. On the software side, the more pieces of solutions more diversified. [2]
For the communication module, the paper uses the node sleep, wake-up mechanism, do not need to carry out data transmission when the node sleep, close the RF transceiver and other processor peripheral modules.
is crucial. According to the function and characteristics of low power node of wireless sensor network, low-power processor node is divided into modules, ZigBee RF modules,
sensor modules, power modules.[3] The overall hardware design of the node hardware is shown in the following figure:
Figure 1. Node hardware structure.
The wireless sensor nodes mainly include data acquisition modules (sensors, A / D converters), data processing and control modules (microprocessors, memory), wireless communication modules (wireless transceivers) and power supply modules (batteries, energy converters) compositions. As shown in Figure 1, the processor unit is the core of the sensor node, and other units together to complete the data collection, processing and send and receive. [4] The microprocessors used in this paper not only meet the needs of the entire data processing, but also reduce power consumption and improve network utilization. Microprocessor module is connected between the other modules via the bus peripheral interface or GPIO, the connection relationship between modules are summarized as Table 1:
Table 1. Connections between modules.
External module Internal modules
RF module UCB2 / GPIO / External interrupt
Sensing module UCB0 / USB1 / External interrupt
Energy module 1-wire single-bus (GPIO analog)
Other modules UCA0/UCB3
According to the characteristics of WSN, node design mainly considers the following 5 points:
(1) miniaturization: the application of the sensor nodes to a high degree of integration, to ensure that the characteristics of the target system will not be affected.
(2) low power consumption: because the network is often
deployed in unattended places, nodes using battery power, how to reduce power consumption is the primary problem.
(3) low cost: the number of nodes deployed in the network is huge, so the cost of each node can not be too high.
(4) high robustness: the sensor network is distributed in a wide area, maintenance is very difficult, therefore, requires the node has a certain resistance to destruction.
(5) high scalability: the sensor node according to the different tasks, equipped with a variety of sensors, so the node reserved interface must be able to meet the requirements.
2.2. Hardware Design
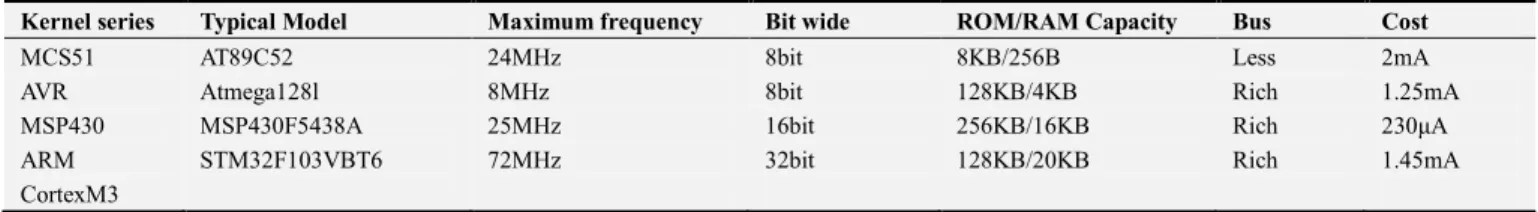
The background of the application of the field environment, this paper uses IT company MSP430F 149 ultra-low power microcontroller as a wireless sensor node processor. Also use its integrated 12-bit analog-to-digital converter to collect platinum resistance PT1000 En degrees information and battery power information. The microprocessor module is the core computing unit of the wireless sensor network node, which directly controls the operation of the whole node, including task scheduling, sensor data acquisition and information processing, the operation of the whole sensor node protocol stack, processing packet transmission and reception, and routing another node data packet. [5] [6] Comparison between commonly-used MCUs as Table 2:
Table 2. Comparison between commonly-used MCUs.
Kernel series Typical Model Maximum frequency Bit wide ROM/RAM Capacity Bus Cost
MCS51 AT89C52 24MHz 8bit 8KB/256B Less 2mA
AVR Atmega128l 8MHz 8bit 128KB/4KB Rich 1.25mA
MSP430 MSP430F5438A 25MHz 16bit 256KB/16KB Rich 230µA
ARM STM32F103VBT6 72MHz 32bit 128KB/20KB Rich 1.45mA
CortexM3
MSP430F 149 microcontroller is a 16 low-power signal processor, for the practical application needs, multi-analog circuits, digital circuits and microprocessors integrated in a chip, providing “one-chip” solution, highlighting the advantages of low power supply voltage, ultra-low power
data communication structure shown in Figure 2:
Figure 2. Processor circuit structure.
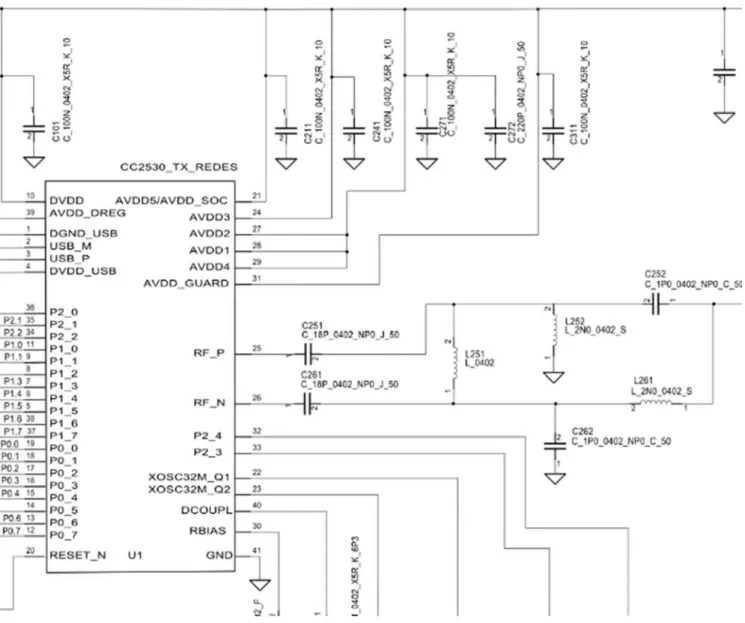
CC2530 integrates an optimized low-power 8051 controller core and a high-performance RF transceiver,
support Z-Stack protocol to meet the various types of sensors and CPU connections. It is an RF transceiver for IEEE805.15.4 and ZigBee applications, requiring only two RF-N and RF-P external capacitor capacitors, with the appropriate antenna to form a wireless communication module, simplifying the wireless module design. At the same time, CC2530 has a proprietary or standard compatible network protocol stack to simplify development. [7] These features make the CC2530 suitable for use in the field monitoring environment, the external circuit as shown:
Figure 3. Processor circuit structure.
2.2.1. Solar Power Design
Energy management module provides energy to other module node that contains the battery and the voltage converter, according to actual needs and design nodes, may also contain a battery management chip. Existed batteries mainly include dry batteries, nickel pot batteries, mirror oxygen batteries, lead-acid batteries and lithium-ion batteries.
Comparison of the above several batteries, the lithium battery is the best performance, specific capacity, small size, low self-discharge rate, no memory effect, discharge voltage stability.
charging mode, the charging voltage is set by an external resistor divider network setting. In the constant current charging mode, by an external resistor to control the charging current. For the battery voltage is below CN3722 constant voltage value 66.7%, CN3722 will be with trickle charge, the charging current is set to 15% constant current. For the battery voltage is below CN3722 constant voltage value 66.7%, CN3722 will be with trickle charge, the charging current is set to 15% constant current. [9] [10]
In order to make the node manager to work continuously, the design of its energy using solar cell supply uses 10W polysilicon solar panels that photoelectric conversion efficiency is about 16%, generally using tempered glass and waterproof resin packaging, so Its service life is generally up to 15 years, up to 25 years mostly.
2.2.2. Node Antenna Selection and Testing
Antenna main performance indicators are particularly large, several typical performance indicators of the 24Ghz antenna are described in detail as follows:
(1) Pattern. According to the direction of the wireless antenna can be divided into omnidirectional antenna and orientation of the world, omnidirectional antenna and directional antenna pattern is very different.
(2) Directionality coefficient. The radiation pattern of the ideal antenna is a standard sphere, but the actual antenna pattern in the direction of the electric field strength is inconsistent.
(3) Antenna gain. In general, the gain value in the maximum gain direction is taken as the gain value of the antenna.
(4) Return loss. Return loss reflects the size of the incident wave in the device by the model, can be used as an antenna performance indicator to study. For the antenna, the return loss is like VSWR, which is the degree of reflection of the incident wave, the formula is RL = 10lg [P reflection / P incidence], the physical meaning of the reflected wave power than the incident wave power. For systems with antenna load, the return loss RL must be negative. The smaller the value is, the smaller the standing wave ratio is, the smaller the energy reflection, so the smaller the RL value, the better the absolute value Bigger and better. RL and VSWR conversion formula:
RL = 20lg [| (VSWR-1) | (VSWR + 1)] (1)
Omnidirectional antenna is a kind of antenna that can becuniform radiation within 360 degrees in the horizontal plane, the general omnidirectional antenna has many features, like as transmission distance, coverage, and cheap. Based on the above information, the Zigbee network is a low-cost network, the nodes are randomly different from each other, and the communication distance is short and so on. This paper chooses the omnidirectional antenna as the antenna type used by the low power node hardware platform. Installed omnidirectional antenna and directional antenna as shown in the physical map:
Figure 4. Node physical map.
3. Software Design
3.1. Terminal Node Sleep Mechanism
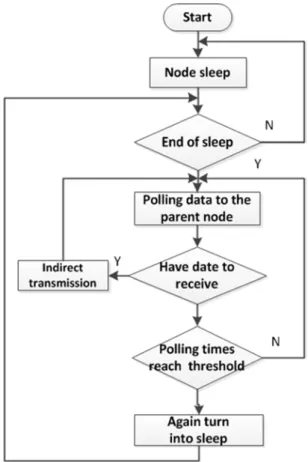
Wireless sensor network nodes in the wild environment use sleep-wake-sleep mode of work to reduce energy consumption. ZigBee network nodes are not always working in the state, only whenever control commands when the work into the state to complete the data collection and forwarding work, only when received control commands the network turn into work state to complete the data collection and forwarding work. [11] Only sending the data to the protocol stack, the protocol stack will automatically be responsible for finding the path, then send the data to the destination address, so just to complete the common node and management node software design. In low-power protocol stack of the application layer design period, the terminal nodes use sleep strategy. The case of a terminal node is not a long time for data transmission, it goes to sleep, the sleep cycle is generally about 5-10 minutes, RF transceiver and other peripheral devices Sleep node closed, to reduce node power consumption purposes. Terminal node sleep mechanism as shown:
The Sink node scans the valid frame data in the channel and waits for the network to join the request frame. Upon receipt of the request, the Sink node broadcasts the routing frame to establish the network within the channel and sends the received routing table information to the server through serial synchronization. When the terminal node joins the network, the corresponding network flag is set to high level, the node starts to send data and route maintenance. In the node communication, the corresponding packets are encapsulated according to the different frame types, and the MAC layer is called. The encapsulation function organizes the MAC data frame, wherein the source address of the data frame is the address of the device and the destination address is the address information of the next hop node calculated by the corresponding routing algorithm. After the frame data is organized, the data frame is sent to the next hop node, and the next hop node is responsible for receiving and forwarding the data packet until the Sink section point. In order to reduce energy consumption, the same level of interrupt nodes intermittently to sleep.
Figure 6. Terminal node sleep mechanism workflow.
3.2. Sensor Module Design
The sensor output results need to be calculated by the formula to get the specific environmental parameters, taking into account the calculation formula is more complex, involving floating-point multiplication and power operation, the calculation on the node will consume the microprocessor module energy and time. Therefore, design the sensor output node will send raw data directly, not calculated. The
calculation environment parameter task is done by the remote server. The sensor data acquisition module is mainly to read and process the sensor data regularly. The sensor node has a timer sleep function, the sleep time interval can be adjusted, mainly to protect the node in the case of battery power can be used for a longer time. Every 10-15 minutes’ terminal nodes will collect environmental information and send the host computer one time. [12]
3.3. Management Node Software Design
The management node in the wireless sensor network functions as a coordinator in the network and realizes the remote communication of the data information. After the system starts work, firstly initialize the hardware and protocol stack, then establishes the network primitive. The gateway node scans and selects a suitable channel to build ZigBee network and design PANID and short address. When a new node applies to join the network, the management node is responsible for assigning a 16-bit short address to the common node and allowing it to join the network, and then enter the dormant state. When the management node receives the wireless control command, it starts to receive the data collected by the sensor node for data processing, and then transmits the data to the remote monitoring center through 3G, and the software work flow of the management node is as follows: When the management node receives the wireless control command, it starts to receive the data collected by the sensor node for data processing, and then transmits the data to the remote monitoring center through 3G, and the software work flow of the management node is as follows:
Figure 7. Management node software work flow.
manager will start GPRS module and the host computer to establish GPRS connection, exchange data. First, the node manager and the host computer terminal network, send networking commands, network node after the success of the host will wait for the order issued by the host computer, and then the node manager to respond to different commands to respond to the data, including the upload routing table. The neighbor table, the collection of data, the node manager will SD card on the various types of data required to upload to the host computer terminal, at this point, the network node to reach the terminal important data in the terminal after a series of processing can be displayed to the user. The host computer can also send commands to manage the acquisition nodes, including setting the sleep interval and acquisition interval, setting the acquisition node sensor status, and so on. The node manager forwards these commands to each node in the network. The nodes to complete their work again after the sleep state, waiting for the next wake up, again networking.
4. Node Test and Analysis Results
4.1. Test Environment
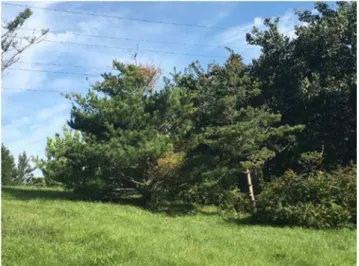
In the field environment including complex terrain and denser irregular distribution forest, to achieve the purpose of experiment, this area selected as test environment is as follows:
Figure 8. Field experiment environment.
4.2. Results
The nodes designed in this paper can be deployed for a long time, and the power consumption is low and the real-time performance is high. In the course of the use, but also according to the actual needs of the sensor module to monitor the field to monitor other parameters. In this chapter, the low-power target design of the node from hardware to software is carried out, and the verification experiment is carried out. Compared with the wireless sensor network which selects the general node and the design node.
In order to compare the design of this node with other typical sensor nodes Consumption situation, lists the current typical wireless sensor network node energy consumption situation.
In certain experimental period of nodes, network energy consumption has been compared. The test time is 24 hours each time, respectively tests the node's power consumption and average power test as Table 3:
Experiments show that the nodes designed in this paper have the following characteristics:
(1) low power consumption, good stability, high precision, battery power can work more than 120 days, the node itself without failure
(2) within the transmission distance can be free to move, any placement detection location, to achieve any time and space scale detection.
(3) can achieve fast self-organizing and multi-hop routing. (4) transmission distance, between the two nodes in the open area of the farthest transmission distance of up to 200 m.
(5) scalability, according to the specific needs of different sensors mounted.
Table 3. Each node average power consumption (mAh).
Using state A1 A2 A3 A4 A5 Total
Use 769.2 782.7 770.2 769.6 771.3 3863
not use 936.9 950.1 937.3 942 941.5 4707.8
5. Conclusion
A low power wireless sensor network node design method, using CC2530 chip, based on ZigBee technology to achieve wireless sensor network self-group and monitoring data automatically aggregated. The overall block diagram of the node design and the hardware design module and the software design flow are given. The experiment results show that the nodes designed with this method have the characteristics of low power consumption and high precision. The design of this paper avoids the complicated communication protocol. The network is convenient and fast to set up. The wireless transmission mode is limited by the geographical environment, and it is suitable for long-term field use. The paper has completed the low-power node hardware design. A ZigBee low power node based on MSP430F 149 and CC2530 RF module is designed, and the node antenna and the node itself are tested. At the same time, achieved the development of low power node software of wireless sensor network. The experiment proved that the power consumption of the whole network was reduced by 15.3%, which verified the effectiveness and energy saving of the design.
Acknowledgements
References
[1] Cui Xunxue, Zhao Zhan, WANG Cheng. Application and Design Technology of Wireless Sensor Network [M]. Beijing: National Defense Industry Press, 2009, 15-16.
[2] Yan Zhenya, Zheng Baoyu. Wireless sensor networks [J]. Computer Engineering and Applications, 2005, 41 (15): 20-23.
[3] Vrushabendra C, Sic lingam K, Znati T. Wireless sensor networks [N]. Springer, 2004.
[4] Mainwaring A, Pilaster J, Szczuka R, et al. Wireless sensor networks for habitat.
[5] ZigBee PRO Protocol Stack [EB/0L]. [2014].
[6] http://www. Jennica. com/products/protocol stacks/zigbee_pro.
[7] jennet user guide [EB/OL]. [2014].
[8] XIANG H, LEI B. Design of temperature/humidity control system of ammunition storehouse based on intellectual sensor SHT15 [J]. International Electronic Elements, 2006, 1: 019.
[9] Steer D. C, Baptlsta A, et al. Research challenges in environmental observation and forecasting system. Proc.6 ACM/IEEE MobiCOM [C]. NewYork, 2000, 8: 292-299.
[10] D. Culler, D. Estrin, M. Srivastave. Overview of Sensor Networks [J]. IEEE Com Puter, 2004: 41-49.
[11] Jiang Ting, Zhao Chongjin. Purple Bee Technology and Its Application [M]. Beijing: Beijing University of Posts and Telecommunications Press, 2006. 25-27.