PERFORMANCE EVALUATION & AVAILABILITY ANALYSIS OF
FEEDING SYSTEM IN A SUGAR INDUSTRY
Gaurav Sharma* Dr. Rajiv Khanduja**
ABSTRACT
This paper discusses the performance evaluation and availability analysis of feeding system of a sugar plant. The sugar industry is a complex and repairable engineering system comprises of various units viz. feeding, crushing, evaporation, refining and crystallization etc. One of the most important functionaries of a sugar industry is feeding system. This system consists of four subsystems arranged in series configuration. For the evaluation of performance and analysis of availability, a performance evaluating model has been developed with the help of mathematical formulation based on Markov Birth-Death process using probabilistic approach. The findings of this paper are therefore, considered to be useful for the analysis of availability and determination of best possible maintenance strategies in a sugar industry concerned.
Keywords: Feeding system; Steady state availability; Markov birth-death process, Probabilistic approach.
*P.G. Student, Department of Mechanical Engineering, Yamuna Institute of Engineering & Technololgy (YIET), Gadholi, Yamuna-Nagar, Haryana, India
I.
INTRODUCTION
A system is kept failure free (as far as possible) under the given operative conditions to achieve the goal of production and long run availability. During the last 25 years reliability technology has been extensively used in various technological fields. The technology has also been used in industry and transportation problems for satisfactory operations [1]. A major challenge to process industries in this highly competitive global market is to produce high quality products with less energy and resources consumed. To ensure higher productivity and more consistent quality product, the efficiency of the production equipment must be maintained at the optimum level. The reliability prediction of engineering systems is becoming increasingly important because of factors such a cost, risk of hazard, competition, public demand and usage o new technology [2]. A probabilistic analysis of the system under the operative conditions is helpful in the design modification for minimum failure run of the system and thus to optimize the system performance [3, 5]. In the sugar industry, we have various systems feeding, crushing, steam generation, refining, crystallization, evaporation. One of the important functions of the sugar industry, on which the quality of sugar and hence the profit of the industry depends is the feeding system.
In a sugar mill juice is produced and this juice is heated through some processes. The failure of feeding system will adversely affect the production. Here, the cane moves from storage to the cane carrier using cane unloader. The cane carrier is a moving belt which carries the cane to the cutter and leveler. A kicker unit is mounted on the cane carrier to remove the excess cane and to maintain a specified cane level. The cane cutter is having a set of knives used to cut the cane into small pieces. The leveler is used to increase cane compactness. It ensures minimum void among the cane pieces and hence maximum juice extraction while crushing. The compact cane pieces are fed to the crushing system by a chain conveyor for juice extraction.
II
. LITERATURE REVIEW
The available literature reflects that several approaches have been used to analyze the system performance in term of reliability and availability. Lim et al. (2000) dealt with analysis of
system reliability and dependent repair models. Clark et al. (2002) dealt with the turning
research into results: a guide to selecting the right performance solutions. Blishke et al. (2003)
multiple system governed by a quasi-birth-and-death process. Sassion et al. (2006) dealt with a
conceptual integration of performance analysis, knowledge management and technology: from concept to prototype. Kumar et al. (2007) discussed with simulated availability of CO2 cooling
system in a fertilizer plant. Khanduja et al. (2008) dealt with availability analysis of bleaching
system of paper plant. Khanduja et al. (2009) also discussed the steady state behavior and
maintenance planning of the bleaching system in a paper plant. Kumar et al. (2009) dealt with
the performance evaluation and availability analysis of ammonia synthesis unit of a fertilizer plant. Gupta et al. (2011) dealt with performance modeling of power generation system of a
thermal plant. Tewari et al. (2012) discussed the performance evaluation and availability
analysis of steam generating system in a thermal power plant. III. SYSTEM DECRIPTION
Feeding system is comprised of four subsystems as follows:
(i) Subsystem Ai, called the cane unloader, comprises of three cane units in parallel. Failure of
one reduces the capacity of the system. Complete failure occurs when all the three units fails. (ii) Subsystem Bj,called the cane carrier & kicker, consists of two units in series. Failure of
any one causes complete failure of the system.
(iii) Subsystem Ck, called the cane cutter and leveler, comprises of two units in series. Failure
of any one causes complete failure of the system.
(iv) Subsystem D, called the chain conveyor, failure of which causes complete failure of the system.
IV.
ASSUMPTIONS
The assumptions used in the probabilistic model are as follows:
1. Failure & repair rates are statistically independent and are constant over time. [6] 2. A repaired unit is, performance wise, exactly same as new unit, for a specified duration. 3. Repair facilities are provided sufficiently, means, waiting time to start the repairs is zero. 4. Standby units are of the same nature as that of the active units [4].
5. System may work at a reduced capacity. 6. There are no simultaneous failures.
V
. NOTATIONS
: Indicates the system in workings state
: Indicates the system in reduced capacity state. : Indicates the system in failed State.
A¡, Bj, Ck, D : Represent good working states of cane unloader, cane carrier, cane cutter,
conveyor.
a, b, c, d : Represent failed states of cane unloader, cane carrier, cane cutter, conveyor. P0(t) : Probability of the system in working with full capacity at time t.
P1(t), P2(t) : Probabilities of the system in reduced capacity (working) state.
P3(t)-P12(t) : Probabilities of the system in failed state.
Фi, i=1-4 : Mean failure rates of A¡, Bj, Ck and D respectively.
λi, i=1-4 : Mean constant repair rates of A¡, Bj, Ck and D respectively.
d/dt : Represents derivative w.r.t time (t).
VI.
PERFORMANCE MODELING
The performance modeling is an activity in which the performance of a system is characterized by a set of performance parameters (repair and failure rates) whose quantitative values are used to find the system’s availability [7]. This is done by using simple probabilistic considerations and differential equations associated with the transition diagram (figure1) are developed on the basis of Markov birth-death process. Steady state availability is then determined by solving these equations. The Chapman-Kolmogorov differential equations are developed [9] on the based on the transition diagram as shown in figure 1, which are as follows:
P0(t)(d/dt+Φ1+Φ2+Φ3+Φ4) = P1(t)λ1 + P10(t)λ2 + P11(t)λ3 + P12(t)λ4...1
P1(t)(d/dt + Φ1+Φ2+Φ3+ Φ4) = P2(t)λ1 + P7(t)λ2 + P8(t)λ4 + P9(t)λ3.……....…...2
P2(t)(d/dt+Φ1+Φ2+Φ3 + Φ4) = P5(t)λ1 +P6(t)λ2 + P3(t)λ3+ P4(t)λ4...…….………...…..3
P3(t)(d/dt+λ3) =
P2(t)Φ3……….………...……….4
P4(t)(d/dt+λ4) =
P2(t)Φ4……….………...………...…5
P5(t)(d/dt + λ1) =
P2(t)Φ1………...……..…...6 P6(t)(d/dt+λ2) =
P2(t)Φ2………..……….…………...7 P7(t)(d/dt+λ2) =
P1(t)Φ2….……….………...8 P8(t)(d/dt+λ4) =
P1(t)Φ4………....…….………...……….………9
P9(t)(d/dt+λ3) = P1(t)
P10(t)(d/dt+λ2) =
P0(t)Φ2……….………...11 P11(t)(d/dt + λ3) =
P0(t)Φ3……….………...12 P12(t)(d/dt + λ4) =
P0(t)Φ4………...13
VII.
STEADY STATE ANALYSIS
As the sugar plant is a process industry, so every concerned system should remain available for a long duration. The steady state behavior [5] of the system can be analyzed by setting t →∞ and d/dt→ 0. The limiting probabilities from equations (1) – (11) are:
P0Φ1 = P1λ1 P7λ2 = P1Φ2 P1Φ1 = P2λ1 P8λ4 = P1Φ4 P3λ3 = P2Φ3 P9λ3 = P1Φ3 P4λ4 = P2Φ4 P10λ2 = P0Φ2 P5λ1 = P2Φ1 P11λ3 = P0Φ3 P6λ2 = P2Φ2 P12λ4 = P0Φ4 Solving these equations recursively, we get:
P1 = P0K1 P7 = P0K1K2 P2 = P0(K1)2 P8 = P0K1K4
P3 = P0(K1)2K3 P9 = P0K1K3
P4 = P0(K1)2K4 P10 = P0K2
P5 = P0(K1)3 P11 = P0K3 P6 = P0(K1)2K2 P12 = P0K4
Where, Ki = Φi / λi i =1, 2, 3, 4.
Using normalizing condition i.e. sum of all the state probabilities is equal to one
We get,
P0 [1+ K1 + K12 + K12K3 + K12K4 + K13 + K12K2 + K1K2 + K1K4 + K1K3 + K2 + K3 + K4] = 1
P0 [1+ K1 (1 + K1 + K1K3 + K1K4 + K12 + K1K2 + K2 + K4 + K3) + K2 + K3 + K4] = 1 P0 = 1 / [1+ K1 (1 + K1 + K1K3 + K1K4 + K12 + K1K2 + K2 + K4 + K3) + K2 + K3 + K4] P0 = 1 / N
Where,
N = [1+ K1 (1 + K1 + K1K3 + K1K4 + K12 + K1K2 + K2 + K4 + K3) + K2 + K3 + K4] Now, the steady state availability (AV) of the feeding system is given by summation of all the full working and reduced capacity states probabilities.
AV = P0 + P1 + P2 AV = P0 + P0K1 + P0K12 AV = P0 (1+ K1 + K12) AV = (1 / N) (1+ K1 + K12)
AV = (1+ K1 + K12) / [1 + K1 (1+K1+K1K3+K1K4+K12+ K1K2+K2+K4+K3) + K2 + K3 + K4]
VIII.
PERFORMANCE ANALYSIS OF FEEDING SYSTEM
The availability or performance of feeding system in a sugar plant is mainly affected by the failure and repair rates of each subsystem of the system [3, 9]. For the simplicity of performance evaluation and availability analysis [6], the failure rates of various subsystems are assumed to follow exponential distribution. These system parameters ensure the high availability of feeding system. This model is used to implement the maintenance policies for feeding system in sugar plant [7]. The various availability levels may be computed for different combinations of failure and repair rates [8]. On the basis of analysis, the best possible combination of optimal maintenance strategies (фi, λi) may be selected. The availability matrices prepared are given in
the tables below:
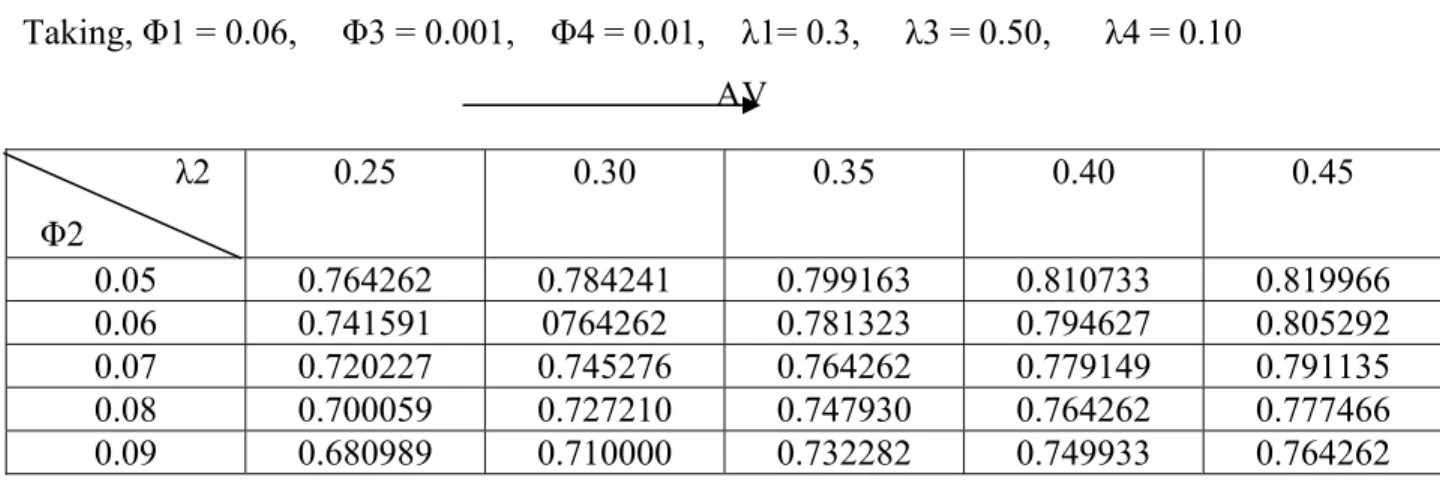
Table 1 Availability matrices for ‘Cane Unloader’ subsystem of Feeding system
Taking, Φ2 = 0.01, Φ3 = 0.001, Φ4 = 0.01, λ2 = 0.10, λ3 = 0.50, λ4 = 0.10
AV
λ1
Φ1
Figure 2. Effect of failure and repair rate of ‘cane unloader’ subsystem on system
availability
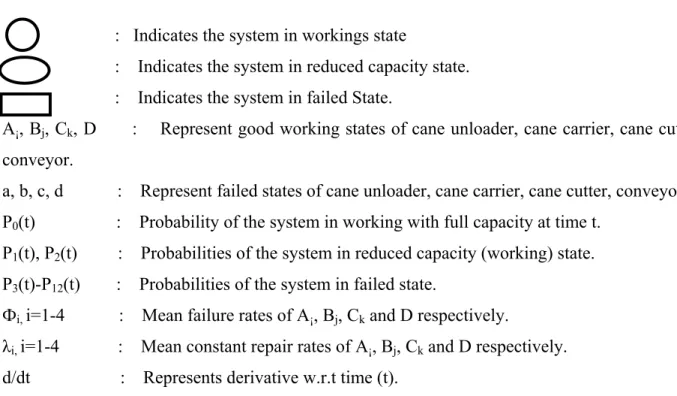
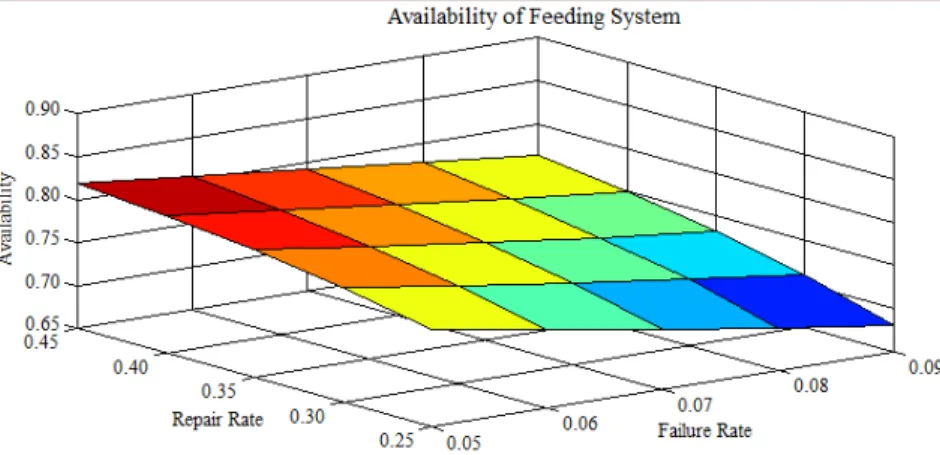
Table 2 Availability matrices for ‘Cane Carrier’ subsystem of Feeding system
Taking, Φ1 = 0.06, Φ3 = 0.001, Φ4 = 0.01, λ1= 0.3, λ3 = 0.50, λ4 = 0.10 AV
0.01 0.827505 0.831324 0.831755 0.831865 0.831904 0.02 0.804489 0.827505 0.830524 0.831324 0.831621 0.03 0.762077 0.818716 0.827505 0.829959 0.830894 0.04 0.708298 0.804489 0.822250 0.827505 0.829562 0.05 0.651324 0.785282 0.814570 0.823788 0.827505
λ2 Φ2
0.25 0.30 0.35 0.40 0.45
Figure 3. Effect of failure and repair rate of ‘cane carrier’ subsystem on system availability
Table 3 Availability matrices for ‘Cane Cutter’ subsystem of Feeding system
Taking, Φ1 = 0.06, Φ2 = 0.01, Φ4 = 0.01, λ1= 0.3, λ2 = 0.10, λ4 = 0.10 AV
Figure 4. Effect of failure and repair rate of ‘cane cutter’ subsystem on system availability
λ 3 Φ 3
0.15 0.20 0.25 0.30 0.35
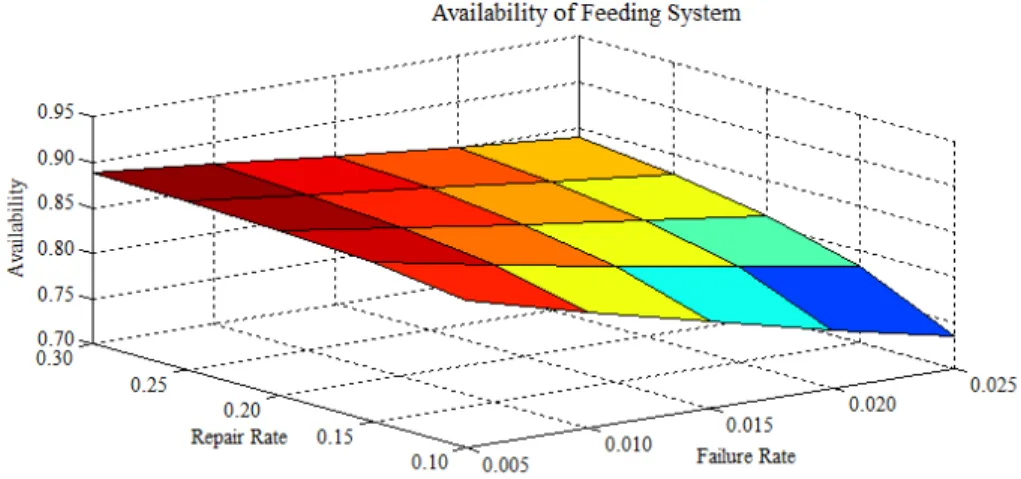
Table 4 Availability matrices for ‘Conveyor’ subsystem of Feeding system
Taking, Φ1 = 0.06, Φ2 = 0.01, Φ3 = 0.001, λ1 = 0.3, λ2 = 0.10, λ4 = 0.50 AV
λ4 Φ4
0.10 0.15 0.20 0.25 0.30
0.005 0.863221 0.875822 0.882261 0.886170 0.888795 0.010 0.827505 0.850978 0.863221 0.870738 0.875822 0.015 0.794627 0.827505 0.844986 0.855833 0.863221 0.020 0.764262 0.805292 0.827505 0.841431 0.850978 0.025 0.736132 0.784241 0.810733 0.827505 0.839078
Figure 5.Effect of failure and repair rate of ‘conveyor’ subsystem on system availability
IX.
RESULTS AND DISCUSSION
Table 1 and figure 1 reveals the variation of system availability with change in failure rate and repair rate of cane unloader subsystem.. As failure rate of cane unloader (Φ1) increase from 0.01 (once in 100 hrs) to 0.05 (once in 20 hrs), the availability of the system decreases drastically by 17%. Also, as the repair rate (λ1) increases from 0.05 (once in 20 hrs) to 0.25 (once in 4 hrs), availability of the system increases merely by 1%.
Table 3 and figure 3 reveals the variation of system availability with change in failure rate and repair rate of cane cutter subsystem. As failure rate of cane cutter (Φ3) increases from 0.01 (once in 100 hrs) to 0.05 (once in 20 hrs), the availability of the system decreases marginally 13%. Similarly, as the repair rate (λ3) increases from 0.15 (once in 6 hrs) to 0.35 (once in 3 hrs), availability of the system increases considerably by 3%.
Table 4 and figure 4 illustrates the variation of system availability with change in failure rate and repair rate of conveyor subsystem. As failure rate of conveyor (Φ4) increases from 0.005 (once in 200 hrs) to 0.025 (once in 40 hrs), availability of the system decreases marginally by 13%. Similarly, as the repair rate (λ4) increases from 0.10 (once in 10 hrs) to 0.30 (once in 3 hrs), availability of the system increases merely by 3%.
X.
CONCLUSION
Performance model is successfully developed for making performance evaluation of feeding system of sugar plant under study. The model analyzed and presented here provides a useful tool in making maintenance planning and decisions. The system availability has been excellent, mainly because of the low failure rate, supported by the state of the art repair facilities. It can thus be concluded that this model provides the various availability levels for different combinations of failure and repair rates for every subsystem of feeding system. It is evident from table 1, that as failure rate of various subsystems of feeding system increases, the availability deceases and as repair rate increases, the availability goes on increasing. One may select the best possible combination of failure events and repair priorities for each subsystem. The developed model helps in determining the optimal maintenance strategies, which will ensure the maximum overall availability of feeding system. Such result are found highly beneficial to the plant management for making futuristic maintenance decisions.
REFERENCES
[1] Lim, T.J., and Chang, H.K., Analysis of system reliability and dependent repair models,
IEEE Trans Reliab,Vol 49, No 2, (2000),153-162.
[2] Clark,R. and Estes, F., Turning Research into Results: A guide to selecting the right performance solutions,CEP Press, Atlanta, GA, (2002).
[4] Ocean,R.P.and Cazorla, D.M., A multiple system governed by a quasi-birth-and-death process, Reliability engineering and system safety, vol. 84, (2004), 187-196.
[5] Sassion, J. and Douglas, I., A conceptual integration of performance analysis, knowledge management and technology: from concept to prototype, journal of knowledge management, vol. 1, no.6, (2006), 81-99.
[6] Kumar, S., Tewari P.C. and Sharma,R., Simulated availabilityof CO2 cooling system in a
fertilizer plant. Industrial engineerinjournal,(Indian Institution of Industrial Engineering, Mumbai), vol. 36, no. 10, (2007), 19-23.
[7] Khanduja,R., Tewari, P.C., and Kumar, D., (2008) Availability analysis of bleaching system of paper plant. Journal of Industrial Engineering, Udyog Pragati, N.I.T.I.E. Mumbai (India), 32(1), 24-29.
[8] Khanduja, R., Tewari, P.C. and Kumar, D.(2009), Steady state behavior and maintenance planning of the bleaching system in a paper plant. J.Ind. Eng. Int., 7 (12), 39-44, Winter 2011, ISSN: 17355702.
[9] Kumar, S., Tewari, P.C., and Kumar, S., (2009), Performance evaluation and availability analysis of ammonia synthesis unit of a fertilizer plant. Journal of Industrial Engineering International June 2009, vol.5, No. 9, 17-26.
[10] Gupta, S and Tewari, P.C., (2011), Performance modeling of power generation system of a thermal plant. IJE Transactions A: Basics,Vol. 24, N0.3, September 2011. pp. 239-248.