EVALUATING CARTILAGE HEALTH USING MULTIPLE IMAGING MODALITIES IN INDIVIDUALS WITH KNEE OSTEOARTHRITIS
Steven J. Pfeiffer
A dissertation submitted to the faculty of The University of North Carolina at Chapel Hill in partial fulfillment of the requirements for the degree of Doctor of Philosophy in the Curriculum
of Human Movement Science in the School of Medicine.
Chapel Hill 2020
ABSTRACT
Steven J. Pfeiffer: Evaluating Cartilage Health Using Multiple Imaging Modalities in Individuals with Knee Osteoarthritis
(Under the direction of Dr. Brian Pietrosimone)
Context: Imaging modalities, such as MRI, are able to detect changes within the cartilage that are indicative of knee osteoarthritis progression. However, MRI is costly, has long acquisition times, and is difficult to assess in conjunction with movement assessments. Ultrasound (US) may serve as a feasible alternative to MRI, due to low-cost, portability, and short acquisition time. Objective: To determine the differences in US outcomes of femoral cartilage prior to and following a 3,000-step treadmill walking protocol in individuals with knee OA, compared to healthy controls. Additionally, this dissertation sought to determine the associations of US outcomes of femoral cartilage with T1 MRI relaxation times, as well as walking biomechanics, in individuals with knee OA. Methodology: Cross-sectional area (CSA) and echo-intensity (EI) measures of femoral cartilage were assessed prior to and following a 3,000-step treadmill
walking protocol. Additionally, percent change scores were calculated for CSA and EI following the treadmill walking protocol. Walking biomechanics and T1 MRI relaxation times were collected for the involved limb during separate laboratory sessions. Statistical Analysis: A one-way ANOVA was used to determine differences in US outcomes between individuals with knee OA and young healthy controls. Separate linear regressions were conducted to determine the change in R2 (∆R2) between T1 MRI relaxation times and US outcomes after accounting for
in R2 (∆R2) between US outcomes and walking biomechanics and accounting for covariates.
ACKNOWLEDGEMENTS
To my advisor Brian Pietrosimone, I can remember a conversation in my first year when you told me what to expect during my time at UNC working with you. You said, “It is going to be challenging and it is going to push you. I’m going to push you. But it is my hope that at the end of this, on Graduation Day, you give me a big hug because you realized it was all worth it.” I
can unequivocally say that both parts of this statement are true. You have pushed me to become better than I thought I could ever become. It has been harder than I could have imagined. But I can honestly say I would not want to change any part of my time in this program with you as my advisor. Your passion for helping people through the research we do is an inspiration and it has helped cultivate a desire in myself to continue to help people. I know that the success I will have in career will be traced back to my time working for you and the lessons you have taught me will always resonate with me. I cannot express this with enough emphasis for it to fully ring true. Thank you Brian.
To my committee member Dr. Daniel Nissman, thank you for collaborating with Brian. If it had not been for your collaborative efforts, I would not have had the opportunity to get
involved in imaging research and found something I am truly passionate about. Thank you for being an incredible resource for me over the past 4 years.
part of your research efforts that brought us to this point. Thank you for always being so supportive.
To my committee member Dr. Troy Blackburn, who has served as a second advisor to me through the past 4 years. Thank you for working with Brian to continue to further the research in traumatic knee injuries at UNC, such that you have created opportunities for young investigators like myself to grow and learn. Thank you for always having your door open when I have random questions about normalizing data or statistical analyses. Your support has meant the world to me.
To my committee member Dr. Erik Wikstrom, whom I have known for the longest amount of time out of anyone at UNC. Thank you for helping to guide me into the world of research during our time at UNC Charlotte. Thank you for being a familiar face for me when I arrived at UNC and for always being willing to provide guidance in every aspect of the PhD journey.
To my research assistants, and other research assistants, who helped with the organization and completion of this project. It could not have been completed without you. (Rachel Sorensen, Julia Drahzal, Brianna Cook, Annie Wandishin, and Kyle Wallace).
To the previous members of the Human Movement Science Curriculum who served as guide through my first few years at UNC, thank you. Specifically, to Dr. Barnett Frank, thank you for always having your door open for questions related to lab techniques, data analysis, or anything else. To Dr. Laura Pietrosimone, thank you for always being the most positive voice in our lab who, no matter what stage of dissertation work or wedding planning, was always
my first year at UNC. You both provided me with an incredible example of the hard work it was going to take to be successful, but also what it looked like to become incredible scientists after working with Brian. You both paved the way so that I could continue to be successful in working with Brian following your hard work to help get his research up and running at UNC.
To my fellow members of my graduating class, thank you for serving as outlets to
express stress, frustration, excitement, and for being so supportive of each other. We were a large cohort but it always felt small because of the support that was shared through the group. (Hope Davis-Wilson, Chris Johnston, Jacob Mota, Katie Hirsch, Malia Blue, Tricia Roby, Tina Vander Vegt, and Jordan Lee).
To my research sister Dr. Hope Davis-Wilson, thank you for being such a great partner to work with during our time at UNC. I can remember a conversation at the beginning of our program where Drs. Matt Harkey and Brittney Luc-Harkey told us that the best way for us to succeed is to rely on each other. I can honestly say I could not have had a better person to rely on for support during our time working together. I have always respected you in so many ways and cannot wait to see the incredible scientist you continue to develop into. You’re a star!
Finally, and most importantly, to my beautiful wife Alleigh. I could live 10 lifetimes and not have enough time to show you how much your support has meant to me. When we came to visit UNC, we had lunch at Med Deli with Brian and he looked at you and said, “He is going to want to quit at some point. You can’t let him.” There were absolutely times, not just in the first
TABLE OF CONTENTS
LIST OF TABLES...xii
LIST OF FIGURES...xiv
LIST OF ABBREVIATIONS...xv
CHAPTER I...1
Introduction...1
Imaging Modalities and Knee OA...3
Assessing Cartilage Health Using Ultrasound...4
Statement of Purpose...5
Specific Aims...5
Specific Aim 1 - Cartilage Ultrasound Comparison in Individuals with Knee OA and Healthy Controls...5
Specific Aim 2 – Ultrasound and T1 MRI Comparison...6
Specific Aim 3 – Ultrasound and Walking Biomechanics...6
CHAPTER II: LITERATURE REVIEW...8
Knee Osteoarthritis...8
Epidemiology and Progression of Knee Osteoarthritis...8
Posttraumatic Knee Osteoarthritis Pathogenesis...9
Imaging Modalities and Knee OA...13
Radiography as a Diagnostic Tool...13
Limitations of X-Rays in Early Detection of Knee OA...14
Magnetic Resonance Imaging and Cartilage Health...15
T1 Relaxation Times and Cartilage Health...17
T1 MRI following ACLR...19
T2 Relaxation Time and Cartilage Health...20
T2 Relaxation Times and Knee OA...21
T2 Relaxation Time and PTOA...22
Limitations of MRI...22
Measuring Cartilage Composition Using Ultrasound...23
Assessing Changes in Cartilage Structure Following Activity...25
Assessing Cartilage Structure in Pathological Populations...27
Walking Biomechanics and Knee OA...29
Alterations in Mechanical Loading During Walking: Implications for Knee OA...29
Medial Compartment Loading: Knee Adduction Moment...30
Sagittal Plane Kinetics and Kinematics...32
CHAPTER 3: EXPERIMENTAL DESIGN AND METHODS...34
Overview: Aims 1-3...34
Experimental Procedures: Aims 1-3...35
Statistical Analysis...45
Specific Aim 1...51
Specific Aim 2...53
Specific Aim 3...56
CHAPTER 5: MANUSCRIPT 1...59
CHAPTER 6: MANUSCRIPT 2...84
LIST OF TABLES Table
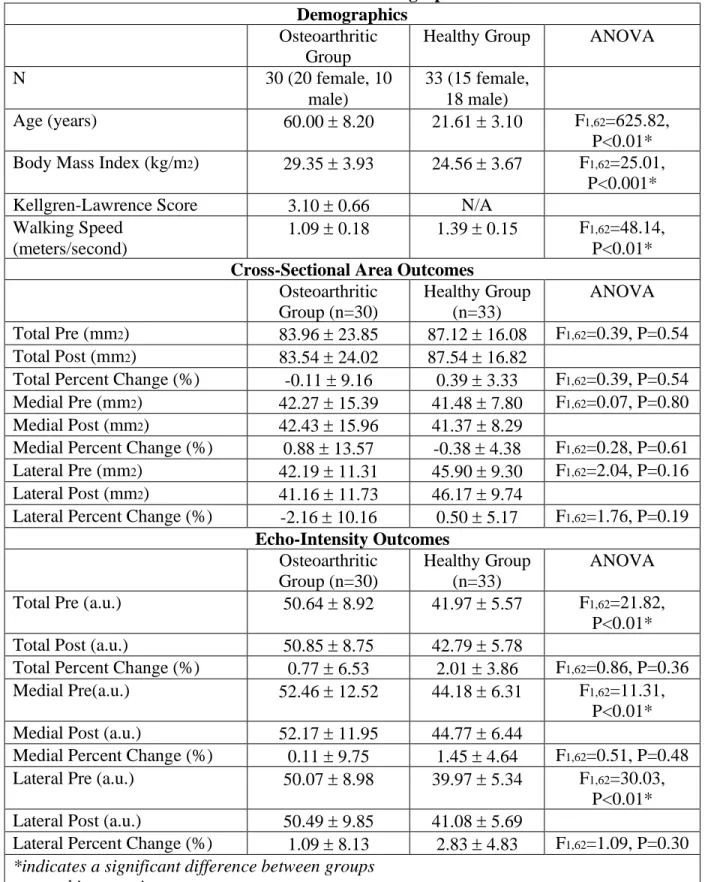
1. Means Standard Deviations for all Demographic and
Ultrasound Outcomes (Manuscript 1)...79 2. Intra-session reliability, precision, and minimal detectable
change for individuals with knee OA ...80 3. Comparisons of Ultrasound Outcomes between Individuals with
OA and Healthy Controls after Accounting for Individual Covariates ...81 4. Chi-Square Contingency Tables ...82 5. Supplementary Table 1 - Means standard deviations, as well as
between-flexion angle differences, for resting and absolute
change in US outcomes at 140 and 130 degrees of knee flexion ...83 6. Means Standard Deviations for all Demographic and
Ultrasound Outcomes (Manuscript 2)...103 7. Means Standard Deviations for T1 MRI Relaxation Times...104 8. Unadjusted comparisons between US outcome measures and
T1 MRI relaxation times in the medial femur ...105 9. Unadjusted comparisons between US outcome measures and
T1 MRI relaxation times in the lateral femur ...106 10. Adjusted comparisons between US outcome measures and
T1 MRI relaxation times ...107 11. Means Standard Deviations for all Demographic and Ultrasound
Outcomes for the Entire Cohort, as well as the CSA Decreaser and
CSA Increaser Groups...129 12. Means Standard Deviations for Walking Biomechanics
of the Involved Limb for the Entire Cohort, as well as the
CSA Decreaser and CSA Increaser Groups...130 13. Associations between Walking Biomechanics and US outcomes
Classified as CSA Decreasers ...132 15. Associations between Walking Biomechanics and US outcomes after
Accounting for Walking Speed and KL Score in Individuals Classified
LIST OF FIGURES
Figure 1. Diagram of the extracellular matrix of articular cartilage.
Macromolecules such as proteoglycans (aggrecan) and collagen (Type II), along with chondrocytes, are responsible for maintaining the structural integrity of articular
cartilage. Chen, 2006 & Sophia-Fox, 2009 ...12 Figure 2. Radiographic images (X-rays) of the progression of knee OA:
KL Grade 1 (A), KL Grade 2 (B), KL Grade 3 (C), KL
Grade 4 (D). Hayashi 2016...14 Figure 3. Maximum score attainable using the Whole-Organ Magnetic Resonance
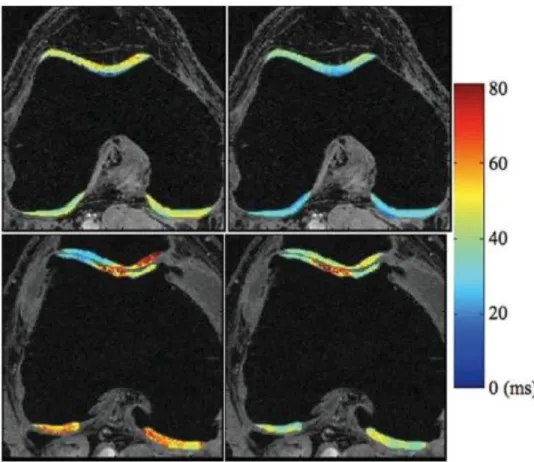
Imaging Score (WORMS). Peterfy, 2004...17 Figure 4. T1 (left) and T2 (right) of a healthy control (upper row)
and osteoarthritic individual (lower row). Both imaging sequences
demonstrated elevated values in the OA individual. Li, 2009...19 Figure 5. T1 MRI of an anterior cruciate ligament reconstructed
knee (left) and contralateral knee (right). Pfeiffer, 2017...20 Figure 6. Ultrasonographic images of healthy (upper image) and
damaged (lower image) femoral articular cartilage. Naredo, 2009...26 Figure 7. Ultrasonographic image of healthy (left image) and
LIST OF ABBREVIATIONS
% in CSA Percent change in cross-sectional area % in EI Percent change in echo-intensity
a.u. Arbitrary unit
ACL Anterior cruciate ligament
ACLR Anterior cruciate ligament reconstruction ANCOVA Analysis of covariance
ANOVA Analysis of variance
ASIS Anterior superior iliac spine
BLOKS Boston-Leeds Osteoarthritis Knee Score
BMI Body mass index
BW Body weight
BW/s Body weight per second CSA Cross-sectional area ECM Extracellular matrix
EI Echo-intensity
FLASH Fast Low Angle Shot
GAG Glycosaminoglycan
KFE Knee flexion excursion KFM External knee flexion moment
KL Kellgren-Lawrence
KOSS Knee Osteoarthritis Scoring System LFC Lateral femoral condyle
mm2 Square millimeter
MDC Minimal detectable change MFC Medial femoral condyle MMP-3 Matrix metalloproteinase-3 MOAKS MRI Osteoarthritis Knee Score MRI Magnetic resonance imaging
OA Osteoarthritis
PTOA Posttraumatic knee osteoarthritis SEM Standard error of the measurement
TE Echo time
TR Repetition time
TSL Spin lock time
vGRF Vertical ground reaction force
CHAPTER I Introduction
Knee osteoarthritis (OA) affects over 29 million adults in the United States annually with an economic burden of over $165 billion.32,100 Effective treatment strategies for knee OA can be
difficult as there are numerous risk factors that can encompass different knee pathogeneses to end stage knee OA.114,115 Additionally, knee OA has been characterized as a disease of the whole
joint, affecting numerous structures within the joint such as ligaments, subchondral bone,
synovium, and the infrapatellar fat pad.137 These changes within the joint can lead to a wide array
of changes in overall function, proprioception, and the onset of knee pain.137 While there are
various joint tissue changes found in individuals with knee OA, declines in articular cartilage health is a hallmark sign of knee OA onset and progression.60 Articular cartilage is composed of
a dense extracellular matrix that, along with water, contains a distribution of collagen,
proteoglycans, as well as other noncollagenous proteins and glycoproteins that serve to maintain the structural integrity of articular cartilage.155 As the main purpose of cartilage is to facilitate the
transmission of loads placed through the knee joint, preserving the homeostatic nature of the extracellular matrix is paramount for maintaining cartilage health and preventing knee OA onset.155
Relationship between Articular Cartilage and Mechanical Loading
of loading.31 However, alterations in loading, whether greater or lesser, can elicit injurious
changes in articular cartilage structure and metabolism. Previous animal research has
demonstrated that greater mechanical loading of cartilage leads to increased shear stress101 and
surface fissuring of the cartilage. Conversely, when lesser amounts of loading are placed upon the articular cartilage, increases in inflammation139 and the expression of degenerative enzymes
(matrix metalloproteinase-3 [MMP-3])85 have been observed. While mechanical loading can
influence the response of the articular cartilage, the composition of the articular cartilage directly relates to the ability of cartilage to withstand mechanical loading and, therefore, can directly relate to the risk of cartilage breakdown and subsequent knee OA development.
Some of the earliest compositional changes within the cartilage, that may precede knee OA onset, include depletion of proteoglycans35,141,144 and a disorganization of collagen
fibers117,171 within the extracellular matrix. These compositional changes can reduce the ability
of the cartilage to respond to mechanical loading;88 therefore, structural changes that associate
with knee OA development may be preceded and governed by compositional changes.36
Additionally, assessing the resting composition of the articular cartilage, as well as testing the response of the articular cartilage to mechanical loading, may allow for earlier detection of cartilage changes associated with knee OA development. Multiple imaging modalities have previously been utilized to assess the composition of articular cartilage,50 along with the response
Imaging Modalities and Knee OA
Radiographs are considered the gold standard for diagnosing knee OA and are capable of assessing overall changes to the knee joint structure.147 Specifically, clinicians utilize the
Kellgren and Lawrence semi-quantitative scale (KL Grade) to assess specific radiographic features (i.e. osteophyte formation, joint space narrowing, sclerosis of the subchondral bone) of the joint and score the health of the knee joint.70 However, the reliance upon changes to the bony
structure of the knee, associated with late stage changes, causes radiographs to be limited in detecting early changes to articular cartilage health.49 Additionally, previous research has
demonstrated that cartilage damage will not be evident on a radiograph until the damage has reached an irreversible level.9,80 Therefore, imaging modalities that are capable of assessing early
changes in cartilage health is crucial to detecting individuals who may be at risk for knee OA development.
Magnetic resonance imaging (MRI) allows for more accurate visualization of soft tissues that may be associated with knee OA, such as ligaments, meniscus, tendon, and articular
cartilage.48 While MRI is considered the gold standard for assessing cartilage structure and
composition,73 MRI has also been used to develop scoring systems, such as the Whole-Organ
Magnetic Resonance Imaging Score (WORMS), that can provide an overall assessment of the knee joint.126 Furthermore, certain MRI modalities have demonstrated significant associations
with specific components of cartilage composition. T1 MRI is a compositional imaging
modality that examines the interaction between water and proteoglycans within the extracellular matrix of articular cartilage.34,35,141 This interaction is important as the hydration of
proteoglycans are vital to maintaining the structural integrity of cartilage during loading
cartilage compositional changes leading cartilage degradation that precedes knee OA onset.34,35,141 Examining this interaction, using T1, is critical for detecting early changes in
cartilage composition, which could allow for earlier implementation for knee OA prevention strategies. However, MRI requires long periods of time for acquisition, is not readily available for regular clinical usage, and comes at great expense financially to the patient and the clinician. Therefore, there is a need for a different imaging modality that may allow clinicians a more readily available and clinically feasible option for regular assessment of cartilage health.
Assessing Cartilage Health Using Ultrasound
Ultrasound is more readily available, requires a shorter acquisition time, and is much less expensive compared to radiographs and MRI. Ultrasound has previously been shown to be a valid and reliable tool for assessing cartilage thickness, a structural component of cartilage health.113 Additionally, ultrasound has been used to assess the composition of other soft tissue
structures, such as skeletal muscle.135 Therefore, ultrasound may have the capacity to assess
differences in cartilage composition as well. Additionally, ultrasound has been used to assess changes in cartilage thickness and cross-sectional area following physical activity, such as normal walking.53,55,56 The ability to measure changes in cartilage structure following normal
walking may also provide surrogate information on the composition of the cartilage, as the structure of the cartilage is governed by the composition.36
The use of ultrasound to assess cartilage health may be very useful in populations, such as individuals with knee OA, that are demonstrating a decline in cartilage health. Previous research, using ultrasound, has demonstrated that individuals with knee OA demonstrate thinner and more irregular cartilage at rest compared to health controls.66 However, there is a dearth of
such as normal walking. Understanding how osteoarthritic femoral cartilage responds to loading may be critical to the development of interventions that target components of mechanical loading (i.e. walking biomechanics) to elicit positive effects within the cartilage. It is also critical to understand the relationship between specific biomechanical targets and measures of cartilage health in order to more effectively recognize which biomechanical targets may have the greatest influence on cartilage health.
Statement of Purpose
Therefore, determining whether ultrasound may be in assessing cartilage health in individuals with knee OA, and comparing it to already established imaging modalities (i.e. T1 MRI), may be the first step in establishing ultrasound as a clinically feasible tool for assessing structural and compositional components of cartilage health in individuals with knee OA. Additionally, understanding the relationship between measures of cartilage health, using
ultrasound, and walking biomechanics will provide unique insight into the relationship between mechanical loading and cartilage health in individuals with knee OA. Thus, the following specific aims have been developed.
Specific Aims
Specific Aim 1 - Cartilage Ultrasound Comparison in Individuals with Knee OA and Healthy
Controls
We hypothesized that individuals with symptomatic knee OA will demonstrate lesser resting CSA, as well as greater resting EI, compared to young healthy controls. Additionally, we hypothesized that individuals with symptomatic knee OA will demonstrate greater negative percent change in CSA, as well as greater positive percent change in EI, following a 3,000-step treadmill walking protocol compared to young healthy controls.
Specific Aim 2 – Ultrasound and T1 MRI Comparison
The purpose of specific aim 2 was to determine the association between ultrasound measures of femoral cartilage health (i.e. resting CSA, resting EI, percent change in CSA, percent change in EI) and femoral T1ρ MRI relaxation times in the involved limb in individuals with symptomatic, radiographic knee OA.
We hypothesized the greater femoral T1 MRI relaxation times would significantly associate with lesser resting femoral CSA and greater resting EI. Additionally, we hypothesized that greater T1 MRI relaxation times would significantly associate with greater negative percent change in CSA and greater positive percent change in EI, following a 3,000-step treadmill
walking protocol.
Specific Aim 3 – Ultrasound and Walking Biomechanics
CHAPTER II: LITERATURE REVIEW
The current literature review will cover: 1) the prevalence and progression of knee OA, 2) techniques for diagnosing knee osteoarthritis, 3) cartilage changes contributing to knee OA progression, and 4) multiple imaging modalities that are used to assess cartilage health, 5) the use of ultrasound as a novel tool for assessing cartilage health, 6) alterations in walking biomechanics that are commonly observed in individuals with knee osteoarthritis, 7) and how these alterations may contribute to knee osteoarthritis progression.
Knee Osteoarthritis
Epidemiology and Progression of Knee Osteoarthritis
Knee osteoarthritis (OA) affects 29 million adults in the United States annually with an economic burden of over $165 billion.32,99 Previous estimates of the lifetime risk for developing
symptomatic knee OA demonstrate a 40% risk for men and 47% for women.115 The treatment of
knee OA can be difficult as there are many factors that can influence an individual’s risk for
developing knee OA and these risk factors may lead to different progression pathways to knee OA.114,115 Risk factors for knee OA have previously been classified as individual-specific (i.e.
age, obesity, sex) and joint-specific (i.e. injury, activity, alignment), however it is possible that a varying combination of these risk factors, from both classifications, can elicit different patterns of knee OA progression.114,115 Additionally, while knee OA has been thought of as a disease that
subchondral bone, synovium, infrapatellar fat pad).137 Therefore, the development of effective
treatment strategies aimed at preventing or delaying the multitude of changes within the joint associated with knee OA development can be difficult.137
Knee OA is classified as a heterogeneous disease with of population of patients that consist of different subgroups or phenotypes,33,76 however providing relief from simply pain and
disability has contributed to ineffective treatment strategies for individuals with knee OA.33,124
Unfortunately, the existence of many potential phenotypes within the knee OA population has resulted in the implementation of multiple interventions or combinations of interventions aimed at providing symptomatic relief, which can increase the likelihood of adverse health events and increase treatments costs.81 Additionally, a delay in effective outcomes as a result of ineffective
treatment strategies may increase an individual’s risk of necessitating a joint replacement, which
is the end-stage treatment for knee OA.24 While the treatment of diagnosed knee OA can be
difficult, the majority of knee OA phenotypes are idiopathic (i.e. develop overtime with an unclear cause of timing of onset), which can thwart attempts at early detection during the initial stages of disease development. Therefore, further research is needed to improve early detection of changes within the joint that may precede the disease development in order to prevent OA onset and progression.
Posttraumatic Knee Osteoarthritis Pathogenesis
While idiopathic forms of knee OA are most common, between 12 and 36% of all cases of knee OA are classified as post-traumatic (PTOA) as a result of a previous traumatic knee joint injury.15,19 The joint injury has been hypothesized to be an “inciting event” to the development
of PTOA, which offers clinicians a unique perspective to examine the pathogenesis of
ligament (ACL) injury and undergo subsequent reconstruction (ACLR) will go on to develop PTOA within the first decade of injury and 50% of these individuals will develop PTOA within 20 years of injury.97 The heightened risk for PTOA development following an ACLR makes
these individuals a good model for assessing PTOA pathogenesis and may inform the treatment strategies for individuals with idiopathic knee OA.97 While the median age of idiopathic knee
OA development is ~55 years,95 ACL injuries occur more frequently in teenagers and young
adults, which can lead to the development of disability earlier in life and increase the number of years living with disability as a result of PTOA.43 As PTOA development may be accelerated
compared to idiopathic OA, as a result of the traumatic injury, individuals at risk for PTOA may have a reduced amount of time for clinicians to assess the progression of the disease. Therefore, detection of early changes within the joint following a traumatic injury may not only inform strategies aimed at preventing or delaying the progression of PTOA, but it may assist in the development and progression of deleterious changes associated with idiopathic knee OA.
Hallmark Sign of Knee Osteoarthritis
The development of knee OA, whether it be posttraumatic or idiopathic, can evoke injurious changes to multiple structures within the knee joint, which can result in changes to overall function, proprioception, and the onset of knee pain.137 While this plethora of changes
can lead to difficulty in assessing the progression of knee OA, a decline in articular cartilage health has been characterized as the “hallmark sign” of knee OA.60 Therefore, understanding
Anatomy of Articular Cartilage
Articular cartilage is a connective tissue that is primarily responsible for provided a lubricated surface of articulation within diarthrodial joints to efficiently facilitate transmission of loads by reducing the frictional coefficient of that joint.155 Articular cartilage is not a vascular
tissue, nor does it contain nerves or lymphatics, which contributes to the inability of articular cartilage to heal and repair itself.155 Therefore, maintaining cartilage health to preserve long-term
joint health is reliant upon sustaining its complex architecture.
Articular cartilage is composed of a dense extracellular matrix (ECM) that contains water, collagen, proteoglycans, as well as noncollagenous proteins and small amounts of glycoproteins (Figure 1).17,155 Similarly, chondrocytes, which are metabolically active cells that
contribute to the maintenance of the ECM by facilitating ECM turnover, make up approximately 2% of the total cartilage volume.1 While chondrocytes are vital to the overall health of the ECM,
these cells possess a limited potential for replication, which contributes to the cartilage’s inability
to heal itself.155 As chondrocytes respond to specific stimuli such as mechanical forces and
hydrostatic pressures,17 alterations in the chemical and mechanical environment around these
Figure 1. Diagram of the extracellular matrix of articular cartilage. Macromolecules such as proteoglycans (aggrecan) and collagen (Type II), along with chondrocytes, are responsible for
maintaining the structural integrity of articular cartilage. Chen, 2006 & Sophia-Fox, 2009.
Within the ECM, water plays a pivotal role in the transport and distribution of nutrients to chondrocytes, providing lubrication, and maintaining an osmotic pressure gradient throughout the ECM as the matrix is compressed.108,109,155 Together, these differing functions allow water to
be imperative to ECM maintenance and the ability to withstand significant loads, which can be greater than an individual’s bodyweight.155 Collagen is the most abundant macromolecule within
the ECM and Type II collagen makes up approximately 95% of the total collagen content.42 Type
matrix.155 Proteoglycans are negatively charged, heavily glycosylated protein monomers that
consist of at least one glycosaminoglycan (GAG) covalently attached chain.93,155 Aggrecan,
which is the most abundant proteoglycan within the ECM, possesses more than 100 GAG chains of chondroitin and keratin sulfate.93,155,170 Aggrecan is responsible for providing articular
cartilage with osmotic properties that serve to retain water within the articular cartilage and allow the cartilage to respond to compressive loads.92 As mechanical loading is placed upon the
articular cartilage, these negatively charged GAG’s,48 which come into close proximity to each
other, are neutralized by cations, specifically sodium (23Na).48 This leads to increased pressure
that influences the hydration state of the tissue and allows the mechanical response of the cartilage to occur.58
The histological and biochemical changes that occur during initial cartilage degeneration involve a decrease in proteoglycan content, an increase in permeability to water, and a disruption of the collagen organization within the ECM.16,47 Due to the importance of collagen and
proteoglycans in maintaining the functional and structural integrity of the articular cartilage, there have been efforts to assess changes in these macromolecules that may precede the onset of knee OA.18,48 Long-term preservation of healthy articular cartilage is pivotal to delay this onset
of knee OA; therefore, monitoring articular structure and composition in order to detect initial, subtle changes in cartilage health is crucial for determining individuals who may be at-risk for development knee OA.
Imaging Modalities and Knee OA
Radiography as a Diagnostic Tool
determine the severity of the disease. Kellgren and Lawrence developed a semi-quantitative scale (KL Grade) that assess changes in bone that may relate to knee OA onset and development.70
Specifically, this scale allows a clinician to provide a numeric value (between 0-4, Figure 2) that corresponds to the severity of the disease, with a 0 score indicating an absence of changes
associated with knee OA and a 4 indicating the highest level of severity of the disease.70 Specific
radiological features (i.e. osteophyte formation, joint space narrowing, sclerosis of the subchondral bone) are identified and used to score the health of the knee joint.70 While this
method is considered to be the gold standard for diagnosing and determining the severity of knee OA, there are limitations to this procedure that reduce its effectiveness in early detection of knee OA.
Figure 2. Radiographic images (X-rays) of the progression of knee OA: KL Grade 1 (A), KL Grade 2 (B), KL Grade 3 (C), KL Grade 4 (D). Hayashi 2016.
Limitations of X-Rays in Early Detection of Knee OA
In order to effectively diagnose knee OA, the use of X-rays rely on changes solely to the bony structure of the knee that are associated with the later stages of knee OA development.49
a KL grade, assesses a decline in the space between the femur and tibia. This is theorized to provide an indication of cartilage breakdown, however X-rays are incapable to directly
visualizing articular cartilage. Additionally, this measure can be distorted by meniscal cartilage lesions and meniscal extrusions.59 Similarly, previous research has demonstrated that cartilage
damage will not be evident on an X-ray until irreversible cartilage breakdown has occurred.9,80
Accurate diagnosis of knee OA using X-rays are highly dependent on correct positioning of the knee joint in the sagittal plane.173 Therefore, small variations in knee flexion angle can alter a
clinicians ability to assess components of knee OA, such as joint space narrowing.173 These
limitations on X-rays as a an adequate modality for early knee OA detection may contribute to the difficulties in developing therapeutic strategies at preventing knee OA development. Therefore, imaging modalities that are capable of quantifying early changes in cartilage health will be crucial to identifying individuals who may be at a higher risk for developing knee OA, which will allow for earlier treatment interventions to be implemented.
Magnetic Resonance Imaging and Cartilage Health
Magnetic Resonance Imaging (MRI) is different from X-rays in that it allows for more accurate visualization of many tissues that may be involved in the degenerative process
associated with knee OA, such as ligaments, meniscus, tendon, and articular cartilage.47 MRI is
also considered to be the gold standard for non-invasively evaluating changes in cartilage structure and composition.73 Additionally, semi-quantitative scoring systems, similar to the KL
subarticular cysts, subarticular bone attrition, marginal osteophytes, medial and lateral meniscal integrity, anterior and posterior cruciate ligament integrity, medial and lateral collateral ligament integrity, synovitis/effusion, intraarticular loose bodies, and periarticular cysts/bursitis) and provide a whole-organ assessment of the knee (Figure 3), which may be more beneficial to assessing the progression of knee OA rather than simply using X-rays.47,50,126 Similar to the
WORMS, other semi-quantitative MRI assessments, such as the Knee Osteoarthritis Scoring System (KOSS),79 the Boston-Leeds Osteoarthritis Knee Score (BLOKS),62 and the MRI
Osteoarthritis Knee Score (MOAKS)61 have sought to provide a whole-organ score for the joint
in knee OA. While these scoring systems are powerful tools aimed at providing a global view of the different factors associated with knee OA development, they do not have a direct
quantification method for articular cartilage structure or composition.
Multiple quantitative MRI modalities have emerged as valid tools for assessing
components of cartilage structure and cartilage composition.73 These different modalities utilize
specific MRI sequences that can allow researchers to analyze the certain aspects of the
composition of the cartilage. While a decline in the overall structure of the cartilage is a hallmark sign of knee OA,60 some of the earliest changes in cartilage health that precede outright knee OA
onset involve alterations in cartilage composition without explicit changes to cartilage
structure.16,102 Altered cartilage composition may affected the water content within the articular
cartilage,88,94,143,144 which may affect the ability of cartilage to respond to mechanical loads.88
Therefore, utilizing quantitative MRI techniques that evaluate cartilage composition may also provide predictive information on how the cartilage structure may withstand mechanical loads placed upon it during common activities, such as walking gait.
T1 Relaxation Times and Cartilage Health
In relation to MRI, relaxation refers to the process of radiofrequency (RF) excited protons returning to equilibrium and becoming realigned with the original longitudinal direction of the static main magnetic field, B0.174 Spin-lattice relaxation rate, also known as R1,refers to the rates
at which these protons recover exponentially towards equilibrium in the B0 direction.174 The
inverse of R1 is called spin-lattice relaxation time T1, which involves the interactions of protons
with the surrounding environment (lattice).174 T1rho relaxation time refers to the relaxation rate,
as a result of the previous RF, in the rotating frame. T1 relaxation time mapping involves the use of multiple spin lock times at a specific spin lock frequency to obtain a series of images with varying T1-weighted contrasts. Voxel by voxel (3D) image intensities are then fit to a
T1 MRI is a compositional imaging modality the examines the interaction between components of the extra-cellular matrix and water molecules (lattice).34,35 This interaction is
important for two specific reasons: 1) the hydration of proteoglycans within the ECM is
incredibly important to the function of the articular cartilage to be able to withstand mechanical loads and provide an appropriate swelling response to the loading and 2) the loss of proteoglycan within the ECM has been classified as an initiating event during the onset of knee OA.34,35,143
T1 MRI has been examined, in relation to proteoglycan density, in both animal and human cartilage. Duvvuri et al. examined the proteoglycan content within bovine cartilage discs that underwent a T1 MRI and found that greater dispersion of proteoglycans within the cartilage correlated with greater T1 relaxation times.34 Similarly, T1 relaxation times were found to be
higher in individuals with diagnosed knee OA compared to healthy controls and possess the ability to distinguish between different stages of cartilage degradation (Figure 4).87,144 Therefore,
Figure 4. T1 (left) and T2 (right) of a healthy control (upper row) and osteoarthritic individual (lower row). Both imaging sequences demonstrated elevated values in the OA individual. Li,
2009.
T1 MRI following ACLR
Individuals are at a heightened risk for developing PTOA following an ACL injury and reconstruction (Figure 5). These injuries typically occur in younger individuals and therefore it is imperative to detect the earliest of changes in cartilage health in order to reduce the risk for PTOA development and potential years living with disability. Therefore, T1 serves as a valuable tool within this population. At one-year post-ACLR, individuals demonstrated greater T1 relaxation times compared to their uninjured contralateral limb.159 Additionally, individuals
with an ACLR demonstrated greater relaxation times compared to healthy controls at 2 years post-ACLR.157 During the initial ACL injury, large amounts of force are transmitted through the
lesions. While these marrow lesions resolve over time, the cartilage underlying these bone-marrow lesions still present with elevated T1 relaxation times at one-year post-ACLR.86 These
findings indicate that T1 MRI has the capability to assess some of the earliest changes in cartilage composition in populations who demonstrate an elevated risk of developing knee OA following a traumatic injury.
Figure 5. T1 MRI of an anterior cruciate ligament reconstructed knee (left) and contralateral knee (right). Pfeiffer, 2017
T2 Relaxation Time and Cartilage Health
While proteoglycans provide much of the compressive stiffness within cartilage as it respond through loading, type II collagen provides tensile and shear strength to the cartilage under loading conditions.143 However, in osteoarthritic cartilage, qualitative and quantitative
changes occur to proteoglycans and collagen.16 While these changes in proteoglycans are thought
of which type II collagen makes up 95%, may be able to provide insight into not only the integrity of the collagen architecture, but also its relationship with other macromolecules.
Some of the earliest experiments evaluating T2 relaxation times using animal and human models have demonstrated a relationship between T2 relaxation times and the integrity of the collagen in cartilage. T2 relaxation times have been evaluated in cartilage specimens from pig femoral condyles,46 shoulder joints of canines,172 and bovine patellae,12 as well as human
specimens from knee replacement surgery.107 These early studies examined T2 relaxation times
in an attempt to explain the magic-angle effect in cartilage,143 whereby the orientation of the
collagen fibers is related to T2 relaxation anisotropy and subsequently will affect the T2 relaxation times.117 Due to the differences in collagen orientation at differing depths within the
cartilage, T2 relaxation times were found to vary at differing depths in bovine cartilage, confirming the notion that T2 of articular cartilage is sensitive to the integrity of the collagen within the extracellular matrix.117,143
T2 Relaxation Times and Knee OA
During the degenerative process of cartilage in relation to knee OA development, the framework of collagen fibers can degrade which can result in a disorganization of the ECM. Previous research has demonstrated that T2 relaxation times are increased in individuals with knee OA compared to healthy controls.87 Additionally, these values showed greater
heterogeneity in osteoarthritic cartilage compared to healthy cartilage,87 supporting the
responds to loading is related to the collagen orientation in the cartilage in individuals with knee OA.
T2 Relaxation Time and PTOA
Similar to individuals with knee OA, T2 relaxation times have been evaluated in
individuals with an ACLR to assess changes in collagen orientation following injury. Following ACLR, individuals demonstrated an increase in T2 relaxation times from a baseline appointment, prior to surgery, to one year post-ACLR.86 Additionally, an increase in T2 relaxation times were
observed from a 6-month follow-up appointment to one year post-ACLR, indicating that changes in type II collagen orientation may progress from the time of injury throughout some of the earliest time points post-ACLR.125 Similarly, these changes may progress to time points even
further out from surgery as T2 values were greater in the ACLR limb, compared to a healthy control limb, at 2 years following ACLR.157 Similar to T1, T2 relaxation times are able to
detect changes to the orientation of collagen fibers within the ECM of articular cartilage early in individuals with an ACLR. Therefore, T2 can provide clinicians, who seek to detect individuals at risk for idiopathic OA, with critical information on some of the early changes in type II collagen associated with knee OA development.
Limitations of MRI
changes in cartilage health that may lead to OA development can occur without any coinciding symptoms. Therefore, a different imaging modality that can inform researchers and clinicians about early changes in cartilage health, that is readily available for clinical use, would serve as a more practical option. In terms of clinical feasibility, ultrasound may serve as a better option compared to MRI.
Measuring Cartilage Composition Using Ultrasound
While ultrasound has not been widely examined in its efficacy in assessing cartilage composition, ultrasound has been used to measure composition of other soft tissues. Particularly in skeletal muscle, echo-intensity, measured via ultrasound, has been used to evaluate differences between healthy and potentially pathological tissues.103 Echo-intensity is a measure of the
greyness of the ultrasound image during acquisition and analysis. As the sound beams travel from the ultrasound probe through the materials being measured, reflectivity of the sound beam is increased at the interface of two materials with different acoustic impedance. In skeletal muscle, echo-intensity demonstrates a significant increase with age and may be due to an infiltration of fatty and fibrous tissue within the muscle.145 Using a comparison to healthy
muscle, echo-intensity serves as a viable measure for assessing the difference in composition between pathological and healthy muscle.135 Similarly, it is possible that a comparison of healthy
Measuring Cartilage Structure Using Ultrasound
While echo-intensity may serve as a valid measurement for assessing cartilage
composition, further research is needed to validate echo-intensity against true, laboratory-based measures of cartilage composition. However, ultrasound has the capability to assess changes in measures of cartilage structure. Naredo et al completed a validity study during which ultrasound measures of cartilage thickness were compared to cadaveric specimens of anatomical knee cartilage (Figure 6).113 Naredo et all demonstrated high agreement (ICC = 0.732 – 0.883)
between the ultrasound and cadaveric measures of cartilage thickness for the medial and lateral condyles, which further supports the use of ultrasound as a valid assessment tool for cartilage thickness.113 Further, MRI is considered to be the gold standard when assessing cartilage
thickness and ultrasound measures of cartilage thickness strongly associate with MRI outcomes of cartilage thickness ( = 0.82).120
During ultrasound acquisition, the visualized cartilage represents one section of the cartilage with a width that is equal to the probe being placed on the peripheral knee. Therefore, it is possible for there to be large amounts of variance between time points when assessing changes in cartilage thickness. Harkey et al assessed medial femoral cartilage thickness following a walking and running protocol and demonstrated high intra-session reliability (ICC2,k = 0.919) for
the acquisition protocol.54 These findings demonstrate that using ultrasound to assess changes in
Figure 6. Ultrasonographic images of healthy (upper image) and damaged (lower image) femoral articular cartilage. Naredo, 2009.
Assessing Changes in Cartilage Structure Following Activity
cartilage, which forces the negatively charged GAG’s to move closer in proximity to each other
until the cations, such as sodium (23Na), restore balance within the ECM and the natural swelling
response occurs.170 This normal response of cartilage to loading is difficult to measure at the
cellular level, therefore it is possible that assessing changes in cartilage structure may provide insight into the health of the cartilage in terms of its response to loading. Similarly, during the initial stages of cartilage breakdown, when proteoglycan depletion and a disorganization of the collagen architecture occurs, there may be an increase in water content within the cartilage, which can decrease the cartilage’s ability to respond to loading.88 As this breakdown in cartilage
composition occurs, and the response to loading may be altered, it can be theorized that the structure of articular cartilage is governed by the composition of the tissue.36 Therefore,
assessing changes in cartilage structure following activities such as walking can provide
information to inform the health of the cartilage structure and provide a surrogate measure of its composition. Additionally, we believe that to further confirm this hypothesis, we will be able to assess how ultrasound measures of cartilage structure, and potentially composition, associate with compositional MRI modalities, such as T1. This will provide greater insight into what information we are able to collect from these ultrasound outcome measures and how they relate to different components of cartilage health.
Previous studies have examined the structural response of articular cartilage to walking using a variety of imaging modalities. Liu et al91 determined, using a combination of dual
change in cartilage thickness or cross-sectional area [CSA]) has not been widely examined. Harkey et al demonstrated a similar deformational response (7%) in medial femoral thickness following 30 minutes of normal walking, using ultrasound.54 Additionally, following a 45 minute
walking protocol at self-selected walking speed, Harkey et al demonstrated a 7% change in medial femoral CSA and a 6% change in lateral CSA.55 While these results provide valuable
insight into the structural response of healthy cartilage to walking, the structural response of cartilage in pathological populations is not well understood.
Assessing Cartilage Structure in Pathological Populations
Recent evidence has emerged demonstrating that in individuals with an ACLR, the cartilage of the ACLR limb demonstrated significantly greater cartilage CSA and thickness compared to healthy, uninjured controls and the uninjured contralateral limb, using ultrasound.56
This is hypothesized to be the result of a swelling, or possibly hypertrophic, response after ACLR, which may affect the long-term health of the joint.56 As these findings indicate
differences between healthy individuals and individuals with an ACLR, who may be at an increased risk for developing knee OA, it is necessary to determine differences in individuals who are already diagnosed with radiographic knee OA compared to healthy controls with no sign of knee OA. Iagnocco et al demonstrated that individuals with knee OA demonstrated thinner cartilage with a more irregular femoral cartilage surface, using ultrasound, compared to a group of individuals who were confirmed to not have knee OA (Figure 7).66 However, while these
loading during activities such as walking. Therefore, we believe that a comparison of cartilage deformation in individuals with knee OA and young healthy individuals is a novel way to determine: 1) how osteoarthritic cartilage responds to what has been previously deemed a “cartilage stress test” and 2) what may be a “healthy” response of cartilage to walking in older
individuals without knee OA.
Figure 7. Ultrasonographic image of healthy (left image) and osteoarthritic (right image) knee. Iagnocco, 1992.
While understanding the response of femoral cartilage in osteoarthritic knees to a walking protocol will provide insight into how this cartilage responds to mechanical loading in general, there is a dearth of information on how alterations in walking biomechanics relate to ultrasound outcome measures of cartilage health. Alterations in walking biomechanics,
to the loading.
Walking Biomechanics and Knee OA
Alterations in Mechanical Loading During Walking: Implications for Knee OA
As stated throughout this literature review, the principal function of articular cartilage is to withstand and facilitate the transmission of loads within the knee joint.155 The complex
structures within the ECM, the density of these structures, and the orientation of these structures interact to maintain the integrity of the cartilage when placed under mechanical loading, such as those occurring during walking. Similarly, it has been theorized that cartilage becomes
accustomed to normal loading patterns during walking and develops a homeostatic response pattern to this loading.5,6 However, if even slight alterations in the biomechanical patterns of
walking are introduced it may have drastic negative effects on the cartilage health due to the repetitive nature of loading during walking.6 As changes in mechanical loading are associated
with the initiation and progression of knee OA, assessing the measures of loading during walking may assist in the treatment and prevention of knee OA. Additionally, determining how these measures of loading associated with measures of cartilage health, such as ultrasound outcome measures, will help determine how these mechanics may affect the pathogenesis of knee OA. Peak vertical ground reaction force (vGRF) is a measure during walking that quantifies the overall force placed upon the body by the ground. While this measure is not a specific measure of loading at the knee joint, vGRF is theorized to associate with greater mechanical loading through the lower extremity.118 Using animal models, previous research has indicated
that greater loading associates with increased cartilage shear stress101 and greater depletion of
proteoglycans,14 suggesting that greater mechanical load of the knee resulted in potentially
previous studies have demonstrated greater bilateral vGRF compared to healthy controls, indicating these individuals experience grater loads through their lower extremity.89,105 With
respect to PTOA, both excessive158 and lesser130,132,168 vGRF following ACLR has been
associated with potentially deleterious changes within the articular cartilage, indicating that alterations in vGRF following a traumatic injury, either increasing or decreasing, may contribute to the increased risk of early cartilage breakdown.
While the magnitude of loading is of great importance to how gait mechanics can influence changes to the cartilage, alterations in the rate of loading may influence changes to tissues within the joint.39 Ewers et al evaluated cartilage fissuring in rabbits and sought to assess
how blunt impact loading of different rates influence the cartilage response.39 Similarly, Radin et
al demonstrated that higher rates of loading in rabbits altered the viscoelastic properties of
cartilage, resulting in changes to the subchondral bone, as a result of the cartilage being unable to reduce the loading through the joint.140 Individuals with knee OA have previously demonstrated
greater vGRF loading rate compared to healthy controls, which is hypothesized to be a result for a lesser from the concurrent decrease in knee flexion angle at initial contact in these same individuals.111 Similarly, individuals with an ACLR have demonstrated increases in vGRF
loading rate compared to healthy controls118 and the uninjured contralateral limb.10 Assessing
both the magnitude and rate of vGRF in individuals with knee OA, and those at risk for knee OA development, can provide valuable information on the mechanical loading profile of these individuals, which can then be related to measures of the cartilage response in order to determine the direct relationship between these loading variables and articular cartilage.
Medial Compartment Loading: Knee Adduction Moment
extremity, it is also used in the calculation of other kinetic variables, such as peak external adduction moment (KAM). The magnitude of mechanical distributed through the medial
tibiofemoral compartment is approximately 2.5 times greater compared to the lateral tibiofemoral compartment,150 which may contribute to the increased prevalence of knee OA observed in the
medial compartment compared to the lateral.8,161 In individuals with knee OA, KAM has
previously been shown to associate with worse self-reported symptoms,63,74 OA severity
measured via radiography,153 and OA progression.106 These findings highlight the significance of
KAM, as approximately 60-80% of the compressive load at the medial tibiofemoral
compartment is distributed by the KAM.150 As such, in order to maintain the optimal magnitude
of load in the medial compartment compared to the lateral, to reduce potential cartilage compositional variations between the compartments,77 walking gait interventions may seek to
focus on KAM as a mechanism to correct any abnormalities in loading from compartment to compartment. In healthy individuals, a positive relationship between KAM and a ratio of medial to lateral cartilage thickness was observed,77 while in adults with medial compartment knee OA,
a negative relationship exists.4 Similarly, in older obese adults without diagnosed knee OA, yet
may be at high risk for developing OA (i.e. age and obesity as risk factors), the positive
relationship observed in the younger healthy individuals transitions to more closely represent the negative relationship observed in individuals with knee OA.4,11 Additionally, individuals with
knee OA demonstrate greater KAM during walking compared to healthy controls.8 Taken
Sagittal Plane Kinetics and Kinematics
While kinetic measures of mechanical loading may serve as therapeutic targets for addressing changes within the joint associated with knee OA, kinematic changes may reflect conditions that can put the joint at risk for developing knee OA. As force is transmitted through the knee joint during walking, the location of contact of the tibia and femur can change with the knee flexion angle (KFA).3 Previous research has demonstrated that the thickest regions of
femoral cartilage associate with KFA at initial contact in healthy individuals.78 Further, local
variations in cartilage thickness may adapt to the amount and location of force that is distributed through the knee joint during the repetitive patterns of walking. These variations in cartilage thickness, that have been classified as morphological “fingerprints” indicating a subject-specific
morphological adaptation pattern to normal gait, may change with the introduction of alterations in the location of contact during walking. Therefore, maintaining normal patterns of KFA at initial contact, as well as the amount of knee flexion excursion that is undergone during the gait cycle, is essential to maintain a healthy joint homeostasis during walking and sustaining cartilage health,3 as knee flexion excursion associates with peak vGRF.27
While sagittal plane kinematics can influence the location of contact between the femur and tibia during walking, the sagittal plane moment, which takes into account mechanical loading, can influence the total load across the entire joint.3 Previous research has demonstrated
that the external knee flexion moment (KFM) is valuable measure in individuals with knee OA, as it provides a surrogate measure for muscle contraction.22,27,150 Additionally, as individuals
with knee OA experience high amounts of pain routinely, recent studies have shown that the KFM is influenced by knee-joint pain related to knee OA.13,64,152 However, the KFM has been
achievable.165 The ability to address alterations in KFM in individuals with knee OA may be
vital to maintaining long-term cartilage health, as a recent study demonstrated that decreases in a ratio of medial-lateral cartilage thickness over 5 years, for the femur and tibia, significantly associated with greater KFM during walking.22 These findings indicate that the KFM, along with
KAM, is an important biomechanical variable to consider when developing walking gait interventions in individuals with knee OA.
We have described how there is an interaction between multiple components of
mechanical loading and components of cartilage health that may interact to influence cartilage breakdown. Similarly, we have discussed how developing interventional strategies aimed at correcting altered biomechanics in individuals with knee OA may be critical to preserving cartilage health and delaying progression of osteoarthritic changes within the joint. It is
necessary to evaluate the relationship between walking biomechanics and measures of cartilage composition and structure in individuals with knee OA, as this will assist in developing a profile of how the walking biomechanics of an osteoarthritic individual directly influences their
CHAPTER 3: EXPERIMENTAL DESIGN AND METHODS Overview: Aims 1-3
The purpose of Aims 1-3 was to determine the differences between US measures of femoral cartilage between individuals with symptomatic knee OA and young healthy controls, as well as determine the associations between US measures of femoral cartilage and T1 MRI relaxations times, as well as walking biomechanics, in individuals with symptomatic knee OA. Specifically, the purpose of Aim 1 was to determine the differences in resting US outcomes of femoral cartilage (i.e. cross-sectional area [CSA] and echo-intensity [EI]) as well as percent change in CSA and EI following a 3,000-step treadmill walking protocol in symptomatic
individuals with radiographic knee OA compared to young healthy controls. The purpose of Aim 2 was to determine the association between US measures of femoral cartilage (i.e. resting CSA, resting EI, percent change in CSA, percent change in EI) and femoral T1ρ MRI relaxation times
Participants: Aim 1 – Aim 3
For Aim 1, we included 30 individuals with symptomatic, radiographic knee OA and 33 young healthy controls. Participants in the knee OA group included in this study were confirmed to have radiographically defined knee OA (Kellgren-Lawrence [K-L] grade 2-4) and were between the ages of 40 and 75 years old and scored greater than 21 on the WOMAC function sub-scale.164 We excluded individuals with knee OA if they had any of the following: body mass
index (BMI) >35 kg/m2, previous diagnosis of a cardiovascular condition restricting them from
exercise, knee injection within the past 2 weeks, pacemaker, neurodegenerative condition,
rheumatoid arthritis, cancer, neural sensory dysfunction over the knee, history of lower extremity orthopedic surgery within the past year, traumatic knee injury in the past 6-months, history of total knee arthroplasty in either extremity, or required an assistive device to walk. The healthy control group was comprised of a convenience sample of healthy individuals between the ages if 18 and 35 years who self-report participating in physical activity for at least 30 minutes 3 days per week.53,55 Additionally, participants were excluded from the healthy control group if they
self-reported a history of lower extremity orthopedic surgery, general orthopedic conditions (i.e. knee OA, orthopedic implant, or lower extremity fracture within the past 12 months), or a ligamentous injury to the ankle, knee, or hip. For Aim 2, we included 11 individuals with symptomatic, radiographic knee OA with similar inclusion and exclusion criteria as with Aim 1. For Aim 3, we included 27 individuals with symptomatic, radiographic knee OA with identical inclusion and exclusion criteria as with Aim 1.
Experimental Procedures: Aims 1-3
young, healthy controls. For the secondary analysis of Aim 1, we employed a repeated-measures design to assess intrasession reliability and precision values of US outcomes in individuals with symptomatic, radiographic knee OA on a subset of individuals (7 female, 2 male, 64 7.58
years, 30.07 3.34 kg/m2). 7 of these individuals were diagnosed with bilateral OA and
therefore both knees were used for the secondary analysis (n=14 knees). Further, the other 2 individuals were diagnosed with knee OA in one limb, which was used for the secondary analysis. In total, 16 knees were included in the secondary analysis. Upon arrival to the laboratory, individuals from both groups completed an assessment of their habitual walking speed that would be used for the 3,000-step treadmill walking protocol. Participants sat on a plinth in a long-sit position with their knees fully extended for 45 minutes to unload the femoral articular cartilage and minimize effects of preceding activity on the cartilage.55 A single
investigator performed an US assessment of the anterior femoral cartilage of the involved limb in a group of individuals with radiographically diagnosed knee OA and healthy controls prior to and immediately following a 3,000 step walking protocol on a treadmill.53 The procedures for the
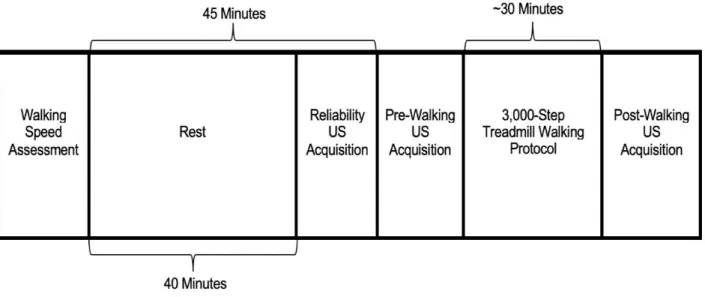
Figure 8: Study Design. For the reliability US acquisition, individuals were positioned to 130o of
knee flexion, then repositioned to the resting position until the pre-walking acquisition occurred. Three US images were collected, bilaterally, at the reliability, pre-walking, and post-walking time points.
Participants included in Aim 2 also completed a T1 MRI at the Biomedical Research
Imaging Center within two weeks (11.4 4.38 days) of the US assessment in the first laboratory visit. Participants included in Aim 3 also completed a walking biomechanics assessment, during the same laboratory session as the US assessment.
Walking Speed Assessment
Prior to conducting the standardized treadmill walking protocol and ultrasound
acquisition, habitual walking speed was determined using 2 sets of infrared timing gates spaced 1-meter apart (TF100, TracTronix). Starting approximately 4 steps prior to the first timing gate, participants were instructed to walk at a “normal comfortable walking speed as if they were normally walking down the sidewalk.” Participants completed 5 practice walking trials prior to
the standardized treadmill walking protocol.53 For participants in Aim 3, the walking speed
calculated during this assessment was also used for the walking biomechanics analysis.
Ultrasonographic Assessment of Femoral Cartilage
Following arrival to the laboratory, participants sat in a long-sit position on a plinth, with their knees fully extended, for 45 minutes in order to unload the femoral articular cartilage and reduce effects of preceding activity on the cartilage. Three US images of the femoral cartilage in the involved limb were acquired immediately following the rest period. Next, participants began the 3,000-step treadmill walking protocol at the previously collected habitual walking speed. For the healthy control group for Aim 1, participants underwent US acquisition procedures with their knees flexed to 140o of knee flexion as previously described.55,56,129,131 Using a modified version
of this technique, participants from the knee OA group for Aims 1-3 laid flat on a plinth with their knee flexed to 130o of knee flexion, which was confirmed using a manual goniometer. The
knee OA group was positioned to a slightly lesser knee flexion angle in order to reduce the potential for pain that may occur during the US acquisition. For aim 1, we performed preliminary testing (n=3) in our laboratory on healthy uninjured volunteers to evaluate differences in resting total CSA and EI, as well as the absolute change in total CSA and EI following a standardized 3,000-step treadmill walking protocol, between 140o and 130o of knee flexion. We felt confident
comparing knee OA and healthy groups which were collected at different joint angles as we found the mean differences between 140o and 130o of knee flexion for each outcome did not
exceed previously reported minimal detectable change values in healthy individuals
(Supplementary Table 1).129 A measuring tape was secured to the length of the plinth so that the
Boston, MA) with a 12 MHz linear probe was used to visualize the femoral articular cartilage. The probe was placed transversely between the medial and lateral femoral condyles superior to the patella and rotated in the sagittal plane to maximize the reflectivity off the cartilage.113 A
transparent grid was placed over the screen of the US monitor to help ensure reproducibility of each image.53,55 The level of the most superficial femoral cartilage border at either edge of the
image was recorded in order to ensure consistency in the rotational positioning of the US probe prior to and following the standardized treadmill walking protocol.55 The plinth on which the
participants rested prior to the standardized treadmill walking protocol was positioned directly behind the treadmill in order to reduce the time between the conclusion of the standardized treadmill walking protocol and US image acquisition. All post-walking images were captured within 60 seconds of the conclusion of the standardized treadmill walking protocol.
Ultrasonographic Image Processing
All US images were analyzed using the ImageJ software (National Institutes of Health, Bethesda, MD) by multiple trained investigators who were blinded to the time point (i.e. pre- and post-walking). All investigators who analyzed the US images demonstrated high inter-rater reliability using intra-class correlation coefficients (ICC > 0.90).129 Femoral cartilage CSA
(mm2) was segmented using a polygon function for each of the three images at each time point
from which the area was calculated and averaged. Further, the total femoral cartilage CSA was segmented into medial and lateral regions based upon the center of the intercondylar notch, which corresponded with the center line on the transparency grid used during image
acquisition.52,55,129 Femoral cartilage EI (a.u.: arbitrary unit) was calculated as the average
scores were calculated for CSA and EI measures using equation 1 in order to determine the acute changes in each variable following the 3,000-step walking protocol (Equation 1).55
Equation 1
% = ( [meanpost - meanpre] / meanpre ) * 100
Standardized Treadmill Walking Protocol
Participants walked on a treadmill (4Front, WOODWAY, Waukesha, WI) at their self-selected speed for 3,000 steps while wearing a pedometer (OneTweak, Austin, TX) secured to the right hip in order to collect real-time step count data during the walking protocol. The pedometer visually displayed real-time step counts for the investigators to monitor. At the 3,000-step count, the treadmill was paused and the participants immediately were re-positioned on the plinth for post-walking US acquisition.
Magnetic Resonance Image Acquisition