50
Mathematical and Software Engineering, Vol. 3, No. 1 (2017), 50-56. Varεpsilon Ltd, varepsilon.com
Flowchart for Clustered-Based Channel Allocation
Management Scheme
Isaac A. Ezenugu
1*, James Eke
2, G. N. Onoh
3*Corresponding author: [email protected]
1
Department of Electrical/Electronic Engineering, Imo State University, Owerri, Nigeria.
2,3
Department of Electrical/Electronic Engineering, Enugu State University of Science and Technology Enugu, Nigeria.
Abstract
In the GSM system, several Base Transceiver Station (BTS) are controlled by a single Base Station Controller (BSC). In this paper, the BTSs in a given BSC is referred to as a cluster. In this paper, flowchart for clustered-based channel allocation management scheme is presented. The mechanism is meant to reduce call blocking/dropping to the barest minimum. Usually, traffic intensity value varies from one BTS to another, as it is directly proportional to the number of GSM users that make or receive calls within a particular period of time. In order to maintain a reliable GSM network that will provide minimum call blocking/dropping, the paper presents the flowchart for network resource management scheme that will adopt sharing of traffic loads among BTSs that belong to a particular network cluster. The scheme also considers the following; available channels, mobility factor, offered traffic, number of nearby BTSs, new call arrival rate, handoff call arrival rate and mean call duration. With limited available channels per BTS, instead of blocking a new call or dropping a handoff call whenever a particular BTS reaches its maximum allowable capacity, this newly proposed scheme however checks for a nearby BTS within that cluster that has free channels, and then performs a routine operation that will transfer some percentage of the traffic load to the free nearby BTS. This routine operation therefore allows the BTS to admit more calls.
Keywords: Call blocking; Call dropping; Mobility factor; New call arrival rate; Handoff
call arrival rate; Call duration
1. Introduction
51
where a mobile user informs the network where it is, while terminal paging is a process that the network attempts to locate a mobile user in the area it was last reported. This area is known as uncertainty area. Both processes which invoke signaling traffic in the signaling networks are used by both processes [1]. It is stated in Fang [1], that the more frequent the location update, the higher the signaling traffic for location updates, while the smaller the uncertainty area, hence the lower the signaling traffic for terminal paging. Noted also is the fact that, the less frequent the location update, the lower the signaling traffic for the location updates, while the larger the uncertainty area, hence the higher the signaling traffic for terminal paging. Therefore, there is of course a tradeoff between these two. It is therefore necessary to try to balance these two kinds of signaling traffic for effective mobility management.
Radio resource management (RRM) plays a vital role in cellular networks to efficiently utilize the limited radio resources while guaranteeing the required QoS for mobile users. Call admission control (CAC) is a fundamental mechanism used for QoS provisioning in a network. It is the rule to admit requested calls maintaining the QoS for the system [2]. Another task of cellular system planning is to design an optimal radio network which provides the largest amount of traffic for a given number of channels at a specified level of quality of service. Accurate traffic dimensioning plays an important role in any telecommunications network planning and is particularly important for the performance analysis of mobile and wireless networks. Traffic models are thus of paramount importance for network planning and design. They are useful in areas such as network architecture comparisons, network resource allocations and performance evaluations of protocols. In this framework, some contributions address how to improve the quality of service in an urban area through the analysis of the real performance data collected from the BSS and propose a generic planning model which would help to evaluate the radio performance of any cellular network [3]. Many optimization procedures applied to several service aspects are aimed at minimizing the call dropping probability while trying to increase the utilization of the resources. This procedure includes; the maximization of service coverage area and of network usage, the minimization of interference and congestion, the optimum traffic balancing among the different frequency layers [4].
2. Review of Related Literature
2.1.
Call Dropping Probability
52
customer care. Call is dropped if there is no available channel in the targeted cell during a handoff, that is, a call is dropped when a handoff failure occurs during a call life. Assuming, Pb and Ph are the call blocking probability and handoff blocking probability, respectively. Also Pc denotes the probability that a call is completed (without blocking and forced termination) [1]. Then the call dropping probability
Pd = 1 - Pb –Pc (1) pd = 1 − (1 − ph )H, (2) where H itself is a random variable. Given the call blocking and dropping probabilities pb and pd, the call completion probability(pc) is given in [1] as
pc = (1 − pb)(1 − pd) (3) Intuitively, call completion probability shows the percentage of those calls successfully completed in the network.
2.2.
Probability of Assigning Channel Successfully
According to [7], it can be concluded that the inter-cell handoff requests come from any direction in the range of 0 and 2π degrees with equal probability using the fluid flow model. Assuming the channels have already been assigned to the MUs when a new call or an inter-cell handoff call arrives, the BS must usually form a new beam with some busy physical channel. It is possible that the cell still has channels that can be reused, but none of them can be assigned to the new call, inter-cell handoff call or intra-cell handoff call because of beam area overlapping problem. The situation mentioned above happens when the number of active MUs in the cell, n, is greater than the number of channels N. When n
≤ N, some free physical channel can always be found to be assigned to the new call or inter-handoff call.
2.3.
Handoff Rate
Handoff rate usually is defined as the average number of handoffs undertaken during the actual call connection in the wireless cellular network. This is a very important parameter for network design and traffic characterization [1].
2.3.1 Cell Dwell Time of a Mobile User
This the amount of time a mobile user spends in a cell. Cell residency is a random variable which depends on the user behavior and system parameters, e.g. cell geometry. In [8], design a traffic model based on the two-dimensional fluid flow model is proposed. In the fluid flow model, the mobile units (MUs) are assumed to be uniformly distributed in the whole service area and MU is equally likely to move in any direction. They assumed that the average moving speeds of non-real-time MU and real-time MU are equal, i.e., E[Vn] = E[Vr], where E[Vn] and E[Vr] are the average moving speeds of the non-real-time MU and real-time MU, respectively. The average cell outgoing rate of MUs was given by
µc−dwell = E[V ]L πA (4) where E[V ] = E[Vn] = E[Vr],
L is the length of the perimeter of a cell, and A is the area of the cell.
The dwell time Tc−dwell (random variable) of a MU is defined as the duration between the times that the MU generates a call and the time that the MU leaves the cell.
53
BTS are located at the same site, this gives rise to two (2) to four (4) sectored cells around a shared antenna tower. BSCs are often connected to BTS via microwave links. The BSC to BTS link is called the Abis interface. Usually about 20 to 30 BTS are controlled by a single BSC. Several BSS will be reporting to the same Mobile Switching Center (MSC) which controls the traffic among many different cells. Each (MSC) is assigned a Visitors Location Register (VLR) where mobile stations which are outside their home cell are listed, so as to enable the network to be aware where to find them. The MSC will also be connected to the Home Location Register (HLR), the Authentication Center (AUC), and the Equipment Identity Register (EIR). These connections of the MSC are to ensure that the system can verify that the users and equipment are legal subscribers. This helps avoid the use of stolen or fraud mobiles. Within the system there are also facilities for Operations and Maintenance (OMC) as well as Network Management (NMC) organizations. The MSC also has the interface to other networks such as Private Land Mobile Networks (PLMN) and Public Switched Telecommunication Network (PSTN) and Integrated Service Digital Network (ISDN) [11].
2.4.
Traffic Intensity
Traffic intensity is defined as a function of the arrival rate and mean call duration [9,10]. The intensity of the arrival process (offered traffic) is given as
= (5)
= traffic intensity in erlang
λ= mean rate of calls (requests) attempted per unit time μ = mean holding time per successful call
3. Model’s Description
54
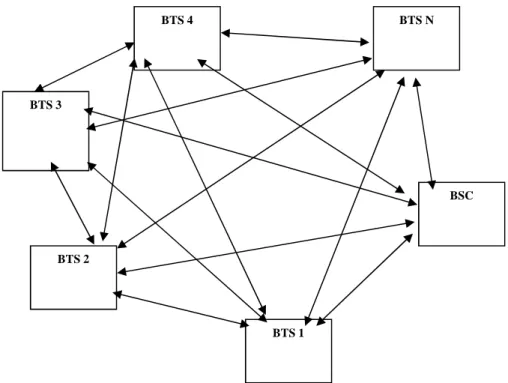
Figure 1: System Model of the proposed scheme
The factors that influence decongestion of the cell are: (1) Distance of the MT to the nearby cell (d) (2) Signal Strength (γ)
(3) Availability of free channel in the nearby cell (CF)
The probability of decongestion (PD) varies directly to the signal strength (γ),
availability of free channels (CF) and inversely to the distance of the MT (d).
PD=∝
.
(6)
P = K . (7)
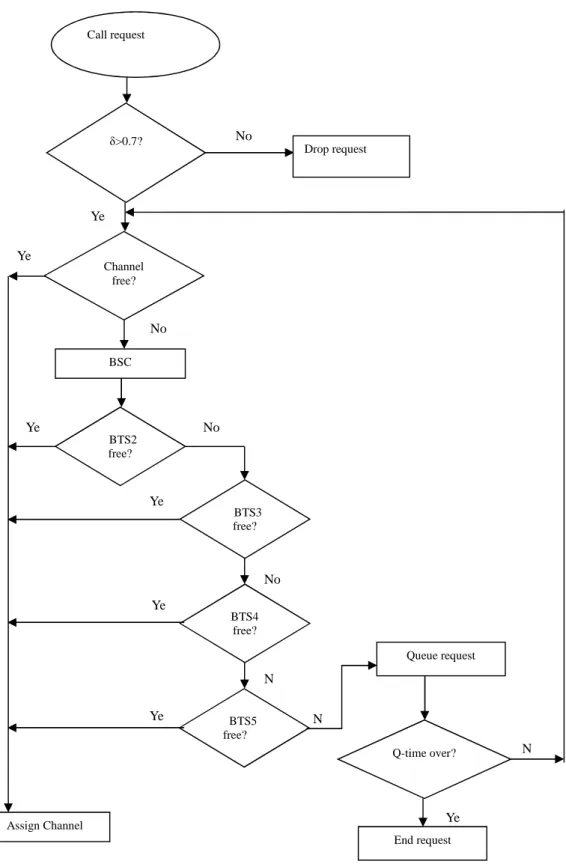
Meanwhile, the details of the activities of this analysis are as shown in figure 2 which presents them in a relational flow chart. The main purpose of this work is to examine this scheme and determine how frequent the BTSs within the network cluster receive calls and then compare their services with their cost so as to ascertain how useful is the cluster to both network providers and GSM users.
The following symbols were used in the flowchart:
δ represent signal strength,
Q-time represent queuing time, and Ch represent channel.
BTS 4
BTS 3
BTS 2
BTS 1
55
Figure 2: Flowchart of the proposed scheme
4. Conclusion
A flowchart for clustered-based channel allocation management scheme is presented. The proposed scheme provides a quality of service guarantee to both the handoff calls and new calls by maximizing the utilization of the BTS resources to accommodate handoff and new calls in order to improve the overall performance of the network. With the proposed
N
N
Ye No
Ye
N Ye
Ye
Ye No
No Ye
Ye
Drop request
End request Q-time over?
Queue request
BTS5 free?
Assign Channel
BTS4 free? BTS2
free?
BTS3 free? BSC
Channel free? Call Request
δ>0.7? No
56
scheme, call dropping probability will be reduced through better utilization of BTS resources. Importantly, the scheme is suitable only in cities where there is much GSM call arrival rate.
References
[1] Fang, Y. (2005). Performance Evaluation of Wireless Cellular Networks under More Realistic Assumptions: Wireless Communications and Mobile Computing Wirel. Commun. Mob. Comput.; 5:867–885 Published Online In Wiley Interscience (www.interscience.wiley.com). DOI: 10.1002/wcm.352.
[2] Lindemann, C., Lohmann, M., & Thümmler, A. (2004). Adaptive call admission control for QoS/revenue optimization in CDMA cellular networks. Wireless Networks, 10(4), 457-472.
[3] Khedher, H., Valois, F. & Tabbane, S. (2002). Traffic Characterization for Mobile Networks Proceedings IEEE 56th Vehicular Technology Conference, vol.3. 1485-1489.
[4] Boggia, G., Camarda, P., D’Alconzo, A., De Biasi, A.&Siviero, M. (2005). Drop Call Probability in Established Cellular Networks: from Data Analysis to Modeling: DEE – Politecnico di Bari, Via E.Orabona, 4 – 70125 Bari (Italy), Proc. IEEE VTC Spring 2005, 5, 2775- 2779.
[5] Tarkaa, N.S, Mom, J.M. & Ani, C.I. (2011). Drop Call Probability Factors in Cellular Networks. International Journal of Scientific & Engineering Research, 2(10), 1-5.
[6] Dharmaraja, S., Trivedi, K. S., & Logothetis, D. (2003). Performance modeling of wireless networks with generally distributed handoff interarrival times. Computer Communications, 26(15), 1747-1755.
[7] Liu, H., Xu, Y. & Zeng Q. (2005). Modeling and Performance Analysis of Future Generation Multimedia Wireless and Mobile Networks Using Smart Antennas. IEEE Wireless Communications and Networking Conference, Vol. 3, 1286-1291.
[8] Xie, H., & Kuek, S. (1994). Priority handoff analysis. International Journal of Wireless Information Networks, 1(2), 141-148.
[9] Samanta, R. K., Bhattacharjee, P., and Sanyal, G. (2009). Performance Analysis of Cellular Wireless Network by Queuing Priority Handoff calls. International Journal of Electrical and Electronics Engineering, 3(8), 472-477.
[10] Giambene, G. (2005). Queuing Theory and Telecommunications Networks and Applications: Rome: Springer Science + Business Media, Inc., pp. 238-400.
[11] Donaldson, A.E., Kalu, C., and Dialoke, I.C. (2016). Cluster-Based Call Acceptance Principle for Optimum Reduction of Call Failures in a GSM Network System, Mathematical and Software Engineering, Vol. 2, No. 2, 48-56. Varεpsilon Ltd, varepsilon.com.