ISSN-L: 2501 - 1235 Available on-line at: www.oapub.org/edu
Copyright © The Author(s). All Rights Reserved.
doi: 10.5281/zenodo.1322153 Volume 4 │ Issue 9 │ 2018
COMPARISON OF ANXIETY AND SUCCESS IN SWIMMING
WITH SOCIO-DEMOGRAPHIC CHARACTERISTICS
Aylin Zekıoglui
Manisa Celal Bayar University, Sports Science Faculty, Manisa,
Turkey
Abstract:
In the present study, the aim was to examine the anxiety levels of athletes that deal with swimming sports regularly in terms of success and some socio-demographic variables. A total of 116 people, who were selected according to the Convenient Sampling Method, and who were between the ages of 16 and 23, participated in the study. Fifty-seven of the participants were female (49.1%), and 59 were male (50.1%). The Illinois Anxiety Test, which consisted of 15 questions were applied to the participants. According to the results, the Internal Consistency Coefficient was found as Alpha = 0.73 for 15 items. This coefficient may be considered as being extremely high for a measurement scale consisting of 15 items, and therefore, the scale was accepted as reliable. The relations between the total scores received from the IAT Scale and the scores received by the participants in competitions were examined with the “Pearson Moments Multiplication Correlation Analysis”. The average values, standard deviation values and similar descriptive statistical values for the scores received by the participants from the competitions and the total score received from the IAT Scale were recorded. The comparison between the total scores received by different socio-demographical groups and the scores received from the competitions in terms of the group averages was made with the One-Way Variance Analysis (ANOVA). The evaluation of the average values of these scores was done by employing the “Tukey-HSD Post-Hoc” test to determine between which groups the statistical differences were detected. A statistically significant difference was detected between the average scores of the IAT Scale total points that was formed according to the grades of the participants in the sample of the study [F (4,111) = 6.692; p <0.05]. According to the results of the “Tukey-HSD Post-Hoc” Test, which was done to determine the source of the difference between the groups, those who were the 4th and 9th in the competitions had statistically
higher anxiety scores than those who were 1st, 2nd, 10th and the rest. The results obtained
in the present study were discussed in line with the data reported in the literature.
Keywords: swimming, success, anxiety, competition
1. Introduction
Sportive performance depends on biomechanical factors such as performance, condition, physiological and technical factors as well as psychological factors like anxiety, stress and motivation (Johns and Hardly, 1990).
It is already known that high or low anxiety levels before any competition have a reducing effect in terms of sportive performance. For this reason, it is required that athletes have neither a very high nor a very low level of anxiety before a competition. (Oner and Le Compte, 1983, Raglin, 1992).
In swimming, which is an individual sport, success depends on some psycho-motor characteristics such as ability, technique, speed, reaction and motion time. Anxiety, which includes some other psychological features such as anxiety, fear, and unrest, is another important effect on success. Anxiety causes to the fear that we might face something that is contrary to what we expect or think. Frequently, anxiety is defined as having conceptual, somatic, emotional, and behavioral components (Seligman and Rosenman, 2001).
Anxiety has the characteristic that begins to disrupt the structure of thinking and nerve structure before a person becomes aware by hurting motivation; and avoiding that the person acts in the direction of his/her aims by preventing happiness, causing physical disturbances, and moving the other people away. It collects all the negative emotions in it.
In addition to caring about physiological values in improving performance, psychological factors, which might also have an important place in this respect, have been a guide to be able to conduct a study on this issue. It should not be ignored that psychological factors such as anxiety -other than mental and motor skills- may also have important functions in improving performance.
Every race is significant for a performance athlete. In such a situation, everything can be a cause of pressure and anxiety for the athlete. Athletes show this in their physiological, mental, emotional and social reactions. Reducing the anxiety is only part of the struggle. It is easily seen how stress and anxiety are influential on athletes in important competitions. The important thing is to transform the anxiety into trust through the right channel and in a positive manner (Erbaş, 2000).
In swimming, in addition to the well-known significance of motor skills on success, the fact that these characteristics might be affected by anxiety shows what kind of a relationship exists between anxiety and success in swimming. In this study, the purpose was to examine the anxiety levels of athletes who deal with regular swimming sports in terms of success and different socio-demographic variables.
2. The Universe and Sampling
The universe of the present study consists of elite swimmers who deal with swimming sport in a professional manner. In the context of Illinois Anxiety Test, a total of 116 elite swimmers whose ages varied between 16 and 23 and who took part in competitions were included in the study as the sampling of the study.
3. The Application of the Inventory
The application of the study was performed in Izmir by applying the Illinois Anxiety Test form to the athletes during the preselection competitions of inter-club winter cup. All the applications were carried out during the 3-day racing season right before the athletes took part in races.
4. Material and Method
The 15-scale IAT Scale was used in the study to determine the anxiety levels of the elite swimmers before competition. The scoring of the scale is in the form of 3-Point Likert Style. In the scale, which was scores as “Very rarely”, “Sometimes”, and “Often”, and 1, 2, 3, there were 6 items that were scored reversely. These were 4, 6, 7, 10, 11 and 13th
items. The scoring of the scale was in the form of having the total score after the conversion of the reverse items.
In addition, in the study, the questionnaire, which was prepared by the author of the study to determine the results received by the participants in the competitions and to determine the socio-demographical characteristics of the sampling.
4.1 The Analysis of the Data
scores of the competitors received from the competitions was examined by “Pearson Moments Multiplication Correlation Analysis”. The total score received from the IAT scale, and the average, standard deviation, and other descriptive statistical values for the scores the players received from the competitions were obtained. In terms of group averages, the One-Way Analysis of Variance (ANOVA) was employed to compare the total scores of the different socio-demographic groups and the scores they obtained from the competitions.
The “Tukey-HSD Post Hoc” test was employed to determine the source of the statistical differences which were determined as a result of the evaluation of the average scores.
5. Findings
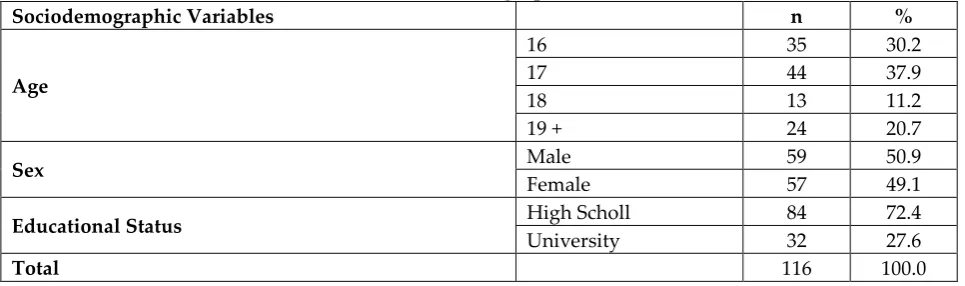
Table 1: The Number and Percentile Distribution of the Participants in terms of Sociodemographic Variables
Sociodemographic Variables n %
Age
16 35 30.2
17 44 37.9
18 13 11.2
19 + 24 20.7
Sex Male 59 50.9
Female 57 49.1
Educational Status High Scholl 84 72.4
University 32 27.6
Total 116 100.0
Table 2: The Number and Percentile Distribution of the Participants in terms of Distance and the Scores
Race Grade n %
1. 14 12.1
2. 11 9.5
3. 14 12.1
4. 11 9.5
5.-9. + 30 25.9
10 + 36 31.0
Total 116 100.0
for a 15-item scale, the scale was accepted to be reliable and the total scores of the sub-groups were started.
Table 3: The Item Analysis and Reliability Analysis Results for the IAT Scale Matter Scale Average Scale Variance Scale Correlation Scale Alpha
01 24.8793 22.1418 .0581 .7439
02 25.0690 19.1082 .6011 .6908
03 25.1552 19.4540 .4910 .7009
04 25.4483 21.6756 .1440 .7355
05 25.3190 20.7582 .2759 .7236
06 25.0086 19.0521 .4940 .6989
07 25.7931 22.3916 .0493 .7408
08 25.3966 20.8675 .2312 .7288
09 25.0086 20.1478 .3610 .7148
10 25.3103 20.1463 .3379 .7173
11 24.8621 18.4852 .5935 .6868
12 25.5000 20.2000 .3925 .7120
13 25.3103 21.5550 .1038 .7443
14 25.4569 20.6329 .2763 .7238
15 25.2069 18.6003 .5776 .6889
N = 116; Number of items = 15; Alpha =0.73
Before the sub-groups were compared with the One-Way Variance Analysis, the descriptive statistical values of the scores received by the participants from the IAT scale and from the competitions for the whole group was computed and given in the table below. In this respect, the range of the scores received by the whole group from the IAT scale varies between 19 and 37; and the average of the sampling is 27.05 ± 4.787. Similarly, the status of the sampling according to the scores received from the competitions is as follows. The range of the scores varied between 247 and 874 and the average score was 618.73 ± 123.947.
5.1 Comparing the Socio-Demographical Characteristics of the Sampling in Terms of the Scale Total Scores
Table 4: Comparison of Age Groups in terms of IAT Scale Total scores with One-Way Variance Analysis
Age n Average Standard Deviation
16 35 26.69 4.049
17 44 28.09 5.447
18 13 27.31 4.171
19 + 24 25.54 4.597
Total 116 27.05 4.787
Sum of Squares Degree of Freedom Squares Average F P Between Group 107.783 3 35.928 1.592 .195
In Group 2527.907 112 22.571
Total 2635.690 115
There was no statistically significant difference between the total average scores of the age groups in IAT Scale total scores; F(3,112)=1.592; p>0.05.
Table 5: The Comparison of Gender Groups in terms of IAT Scale Total scores
with One-Way Variance Analysis
Group n Average Standard Deviation
Male 59 26.07 4.975
Female 57 28.07 4.399
Total 116 27.05 4.787
Sum of Squares Degree of Freedom Squares Average F P Between Groups 116.242 1 116.242 5.260 .024
In Groups 2519.448 114 22.100
Total 2635.690 115
There was a statistically significant difference between the IAT Scale total scores of the gender groups; F(1,114)=5.260; p<0.05. According to the result obtained, the IAT Scale total scores of the male participants were higher than those of the female participants. According to this result, male participants seem more anxious that female ones in terms of statistics.
Table 6: The Comparison of the Groups that were formed according to Educational Status
in terms of IAT Scale Total scores with One-Way Variance Analysis
Groups n Average Standard Deviation
High Scholl 84 27.61 4.864
University 32 25.59 4.317
Total 116 27.05 4.787
Sum of Squares Degree of Freedom Squares Average F P Between Groups 93.935 1 93.935 4.213 .042
In Group 2541.754 114 22.296
Total 2635.690 115
F(1,114)=4.213; p<0.05. According to the results, the anxiety levels of the high school graduate participants were higher than those of the university graduates at a statistical level
Table 7: The Comparison of the Groups that were formed according
to the Levels Received in the Competitions by the Participants in terms of IAT Scale Total scores with One-Way Variance Analysis
Groups n Average Standard Deviation
1. 14 23.93 4.178
2. 11 25.00 4.219
3. 14 26.64 4.700
4.-9. + 41 29.71 4.611
10 + 36 26.03 4.074
Total 116 27.05 4.787
Sum of Squares Degree of Freedom Squares Average F P Between Groups 512.087 4 128.022 6.692 .000
In Groups 2123.603 111 19.132
Total 2635.690 115
There was a statistically significant difference between the IAT Scale total scores of the participants in the sampling according to the levels received in the competitions; F(4,111)=6.692; p<0.05. According to the results of the “Tukey-HSD Post Hoc” test, which was done to determine the source of the difference between the groups, those who had levels between 4 and 9 were found to be more anxious when compared with those who had levels between 1, 2, and 10.
5.2 The Comparison of the Socio-Demographical Characteristics of the Sampling in Terms of Competition Scores
In this part of the results, the results of the comparison of the total scores received by the participants from the competitions in terms demographical groups are given.
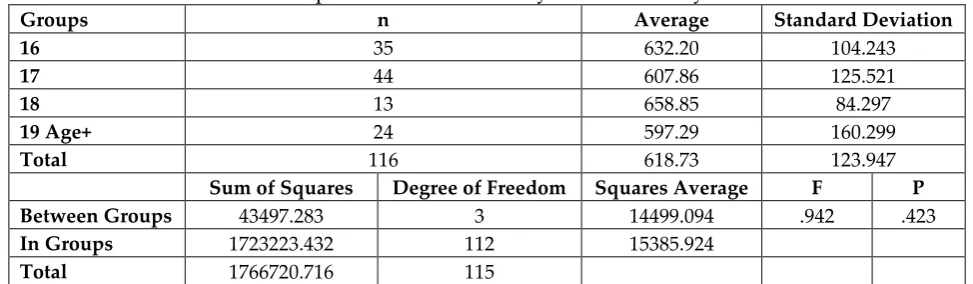
Table 8: The Comparison of the Age Groups in terms of the Scores Received
in Competitions with One-Way Variance Analysis
Groups n Average Standard Deviation
16 35 632.20 104.243
17 44 607.86 125.521
18 13 658.85 84.297
19 Age+ 24 597.29 160.299
Total 116 618.73 123.947
Sum of Squares Degree of Freedom Squares Average F P Between Groups 43497.283 3 14499.094 .942 .423
In Groups 1723223.432 112 15385.924
Total 1766720.716 115
Table 9: The Comparison of the Gender Groups in terms of the Scores Received in Competitions with One-Way Variance Analysis
Groups n Average Standard Deviation
Male 59 610.32 137.712
Female 57 627.44 108.420
Total 116 618.73 123.947
Sum of Squares Degree of Freedom Squares Average F P Between Groups 8493.799 1 8493.799 .551 .460
In Groups 1758226.916 114 15423.043
Total 1766720.716 115
There was a statistically significant difference between the score averages of the gender groups received in competitions; F(1,114)=0.551; p<0.05.
Table 10: The Comparison of the Groups that were formed according to the Educational Status
in terms of the Scores Received from the Competitions
Groups n Average Standard Deviation
High Scholl 84 622.23 116.824
University 32 609.56 142.584
Total 116 618.73 123.947
Sum of Squares Degree of Freedom Squares Average F P Between Groups 3716.138 1 3716.138 .240 .625
In Groups 1763004.577 114 15464.952
Total 1766720.716 115
There was a statistically significant difference between the scores of the groups that were formed according to the educational status of the participants in the competitions; F(1,114)=0.240; p<0.05.
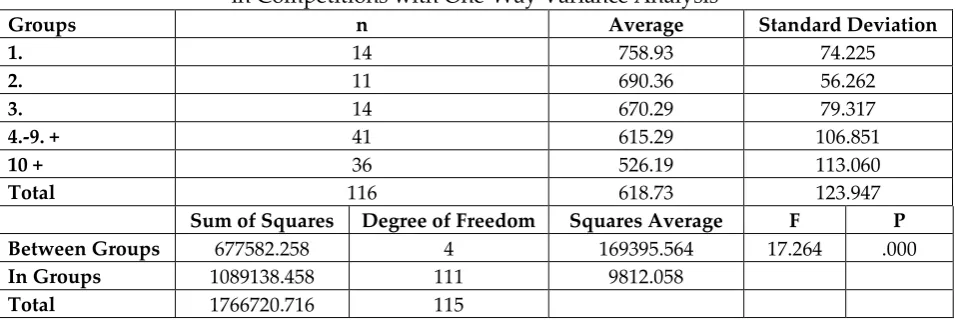
Table 11: The Comparison of the Groups that were formed according
to the Levels Received in Competitions by the Participants in terms of the scores received in Competitions with One-Way Variance Analysis
Groups n Average Standard Deviation
1. 14 758.93 74.225
2. 11 690.36 56.262
3. 14 670.29 79.317
4.-9. + 41 615.29 106.851
10 + 36 526.19 113.060
Total 116 618.73 123.947
Sum of Squares Degree of Freedom Squares Average F P Between Groups 677582.258 4 169395.564 17.264 .000
In Groups 1089138.458 111 9812.058
Total 1766720.716 115
between the groups, the competition scores of the participants who received 10th level in
competitions were lower than those who had 1st, 2nd, 3rd and those between 4th and 9th
level at a significant level. In addition, the competition scores of the participants who had competition scores between 4th and 9th levels were lower than those who were the
1st competitors in the competitions.
7. Discussion and Result
Competitions cause that the anxiety rises in athletes. However, in order to be successful in sportive competitions, it is considered that anxiety is needed. However, it was emphasized that this anxiety should be at optimal level depending on the type of the sports discipline. In the present study, the effect of anxiety before a competition in elite swimmers was investigated.
The sociodemographic information of the athletes, the levels and scores received by the participants in competitions, and the scores received from the Illinois Test were compared in statistical terms and the findings of the study were obtained. No statistically significant differences were detected between the Illinois Anxiety Test scale total score averages of the age groups.
results, the anxiety levels of the people who are high school graduates are higher than those who are university graduates at a statistically significant level.
A statistically significant difference was detected between the IAT Scale total score averages of the participants received in the competitions. In this respect, those who had levels between 4th and 9th in competitions were found to be more anxious than
those who were 1st and 2nd and 10th and more. However, Raglin et al. conducted a study
(1990) and did not detect a difference between the groups which were grouped and evaluated according to successful or failure status. In another study, the results supported these results (Morgan, 1987). Aşçı and Gokmen (1995) conducted a study in female handball players and found a negative correlation between the anxiety levels and success. In other words, as the anxiety levels increased, the success levels decreased. Yucel (2003) conducted a study on the effects of situational and continuous anxiety levels of the taekwondo players on the success in competitions; and found a significant relation between the success of the athletes and their situational and continuous anxiety levels. They found that the situational anxiety before a competition was as high as the importance of a competition (Cox, 1990). Thirer and O’Donnel (1980), Maynard and Howe (1987) and Murphy and Woolfolk (1987) concluded that there was no relation between the competition anxiety and motor performance. According to the results obtained in the study, no significant relation was detected on the effect of anxiety on success. Anxiety has possible effects on gender differences, educational status and the scores received form competitions. It may be considered that future studies that will be conducted with wider sampling groups in different sports branches or in team sports will yield better results in understanding the effect of sports on success and anxiety by adding other concepts to these.
7.1 Recommendations
Future studies that will be conducted with wider sampling groups in different sports branches or in team sports will yield better results in understanding the effect of sports on success and anxiety by adding other concepts to these. The study may be conducted by applying it to different sports branches and to team sports. Imagining the targets in the mind is an efficient way in realizing them; and may help prevent anxiety. An athlete who constantly thinks about the result and acquisitions starts to feel anxiety about the results. In order to avoid this, s/he must think on controllable targets.
References
1. Seligman, Walker & Rosenhan, (2001). Anxiety in Sport. (4th.ed). New York: W. W. Norton & Company
2. Tavacıoglu, L. (1999). (ed), Spor Psikolojisi, Ankara, Bagırgan Yayımevi, 29
4. Raglın J. S., Morgan W. P., Wıse K. J. (1990). Pre-competıtıon anxiety and performance in female high school girl swimmers: a test of optimal function theory. Int J Sports Med,11:171 – 175
5. Ozturk F., (1991). Sporda stres. Spor musabakaları anksiyete testi.1-53, Bursa 6. Raglin J. S. (1992). Anxiety and sport performance. Exercise and Sport Sciences
Reviews Vol. 20, 243 – 274
7. Jones G.; Hardy L. (1990). The Academic study of Stress in Sport, Stress and Performance in Sport, John Wiley and Sons, Ckichester, , 3-5
8. Oner N., Le Compte A. (1983). Durumluluk/Surekli Kaygı El Kitabı, B.U. yayınları, Istanbul, No:333
9. Raglin J. S. (1992). Anxiety and Sport Performance, Exercise and Sport Sciences Reviews, , 20:243-274
10.Erbas, M. (2000). Turkiye Basketbol II. Ligindeki Oyuncuların Bazı Kisisel Degiskenlerinin Durumluk Kaygı Uzerine Etkileri ve Durumluk Kaygının Takım Ici iliskilerine Etkisinin Arastırılması, Trakya Universitesi, Sosyal Bilimler Enstitusu, Yuksek Lisans Tezi,. Edirne, 38, 41, 70
11.Tavacıoglu, L. (1999). Spor Psikolojisi. Sporsal Kuram Dizisi 23, Bagırgan Yayınevi, Ankara, 39- 44
12.Arseven, A., Guven, O. (1992). Sporcuların musabaka ortamındaki anksiyete duzeyleri. Ankara:H.U. Spor Bilimleri II. Ulusal Kongresi.
13.Ozbekçi, F. (1989). Farklı spor dallarında yaşanan musabaka stres duzeylerinin arastırılması. Yayımlanmamıs Yuksek Lisans Tezi. M.U. Sosyal Bilimler Enstitusu. Istanbul.
14.Ozgul, F. (2003). Beden Egitimi ve Spor Yuksek Okulu Ogrencilerinde Durumluk ve Surekli Kaygı Duzeyleri, Yuksek Lisans Tezi, Cumhuriyet Universitesi Saglık Bilimleri Enstitusu, Sivas.
15.Yucel, E. O. (2003). Taekwondocuların Durumluk ve Surekli Kaygı Duzeyleri ve Musabakalardaki Basarılarına Etkisi, Yuksek Lisans Tezi, Gazi Universitesi Saglık Bilimleri Enstitusu Beden Egitimi ve Spor Anabilim Dalı, Ankara.
16.Cox, Richard H. (1990). Sport Psychology, Concepts and Applications, Second Edition, Wm. C. Brown Publishers, Dubuque
17.Thirer, J. ve O'Donnell, L. A. (1980). Female Intercollegiate Athletes Trait Anxiety Level and Performance in a Game. Perceptual and Motor Skills. 50, 478-487. 18- Maynard, I. W. ve Howe, B. L. (1987). Interactions of trait and State Anxiety with Game performance of Rugby Player. Perceptual and Motor Skills. 64, 599-602.
18.Murphy, S. M. ve Woolfolk, R. L. (1987). The Effects of Cognitive Interventions and Competitive Anxiety and performance on Fine Motor Skill Accuracy Task. International Journal of Sport Psychology. 18, 152-166.
Creative Commons licensing terms