Sharif University of Technology
Scientia IranicaTransactions A: Civil Engineering http://scientiairanica.sharif.edu
A virtual blind spot identication system for
construction projects
S. Kivrak
and F. Rostami Kia
Department of Civil Engineering, Anadolu University, Iki Eylul Campus, 26555 Eskisehir, Turkey. Received 7 November 2015; received in revised form 12 February 2016; accepted 19 September 2016
KEYWORDS Blind spot; Construction accidents; Point cloud; Safety; VIBSIM; Visibility.
Abstract. The construction industry is recognized as one of the most hazardous industries. Visibility-related accidents are the cause of a signicant portion of the total fatalities within the construction industry. Limited visibility due to construction equipment blind spots and a lack of visibility in construction areas such as slab openings are among the main causes of these fatalities. This study introduces the Virtual Blind Spot Identication System (VIBSIM), which was designed to identify and examine blind spots in construction equipment and construction sites. The VIBSIM consists of a three-dimensional point cloud model that uses 3ds Max software in conjunction with a V-Ray rendering motor. A real case is used to validate the applicability of the proposed system. The results indicate that the system can signicantly improve safety applications for construction projects. Moreover, the system can aid construction managers in making decisions regarding better management of such safety applications for construction projects.
© 2018 Sharif University of Technology. All rights reserved.
1. Introduction
Although safety performance in the construction in-dustry has improved in recent years, the accident and fatality rates in this industry are still among the highest across all sectors [1]. Indeed, the United States Bureau of Labor Statistics (BLS) reported that the construction sector had the largest number of fatal workplace injuries (805 out of 4,628 total fatalities) in 2012 [2]. Aside from causing human tragedy and economic loss, such accidents signicantly aect the productivity and reputation of the construction industry [3,4]. Therefore, minimizing accidents is a major issue that the industry must solve [5].
*. Corresponding author. Tel.: +90 222 3213550; Fax: +90 222 3239501
E-mail addresses: [email protected] (S. Kivrak); [email protected] (F. Rostami Kia)
doi: 10.24200/sci.2017.4174
The BLS report stated that the main causes of fatalities on construction sites were falls (34.6%), being struck by objects (9.8%), electrocution (8.1%), and being caught in-between equipment or objects (1.6%) [2]. Furthermore, according to the Occupational Safety and Health Administration (OSHA), approxi-mately 360 workers in the United States died due to backover incidents between 2005 and 2010 [6]. These statistics show that equipment-related fatalities com-prise a signicant portion of the total fatalities within the construction industry. One of the main causes of equipment-related fatalities is limited visibility due to blind spots [7,8], which are dened as areas that are not visible to the equipment operator [9]. Blind spots create problems for equipment operators by restricting their line of sight [10]. According to the study by Hinze and Teizer [11], visibility-related construction accidents accounted for nearly 5% of all construction industry fatalities from 1990 to 2007 in the United States. Some fatalities caused by falling from a height can also be attributed to visibility issues in areas of a
construction site such as stairs as well as slab and wall openings. Thus, identifying blind spots is critical to the prevention of visibility-related accidents.
Information technologies play a vital role in improving the construction industry's safety perfor-mance [12-14]. Although many studies have shown that the construction industry is reluctant to apply new technologies [15], the sector has become more aware of the need for advanced technology over the past few years [16]. Based on the above, this research study aims to reduce the likelihood of visibility-related accidents by using a blind spot identication system.
In recent years, various methods and technology applications have been developed to identify blind spots on construction equipment and, thereby, to reduce the number of visibility-related accidents that occur on construction sites [17-21]. Previous studies on blind spot identication have generally analyzed the machinery, equipment, site conditions, and operators' physical properties, and such studies have developed blind spot area diagrams besides proposing various methods and technologies aimed at accident preven-tion. For instance, Hefner [22] published a library of blind spot diagrams for a total of 38 dierent vehicles used in the construction industry. Similarly, the National Institute for Occupational Safety and Health (NIOSH) developed blind spot diagrams for 43 pieces of construction equipment based on manual methods and the ISO standards 5006 and 14401-1 [23]. Teizer [24] introduced a three-dimensional (3D) imaging system that was useful for safety applications and night operations, where static and dynamic objects could scarcely be recognized by the existing intensity-or colintensity-or-based sensing systems. Teizer et al. [10] presented an automated blind spot detection tool that determined equipment blind spots rapidly and in three dimensions by analyzing point cloud data from a laser scan inside the cab. Another study by Teizer et al. [25] aimed to improve safety in construction equipment operations by using autonomous, wireless, proactive, real-time warning and alert devices when two or more construction resources were in close proximity. Ray and Teizer [9] proposed a new approach to computing blind spots, which involved the use of equipment point cloud data. Their method enabled the performance of various analyses, such as volumetric blind spots, blind spot mapping, 12 m circumference visibility, rectangular 1 m boundary visibility, and worker visi-bility [9]. Marks et al. [26] also used laser scanning data to measure blind spots, and they demonstrated how the design of construction equipment impacted operator visibility. A more recent study conducted by Bostelman et al. [27] provided an explanation of visibility measurement experiments, as well as the associated results, language suggestions for standards organizations, and a prototype design for automatically
measuring the visibility of forklifts.
Some researchers have focused on the particular blind spot problems of tower cranes [28-31]. For instance, Lee et al. [32] introduced a tower crane navigation system that provided 3D information about the building, surroundings, and position of the lifted object in real time using various sensors and a building information model. A similar system was presented by Lee et al. [33] who used a radio-frequency identication tag system developed for the T-type tower crane. Shapira et al. [34] developed a wireless video camera for tower cranes that oered a solution to the problem of blind lifts. Further, Fang and Teizer [35] presented a virtual training approach intended to enhance the collaboration between crane operators and signal peo-ple in blind lifting operations. Cheng and Teizer [36] introduced a framework to explain the method of streaming data from real-time positioning sensors to a real-time data visualization platform. In a more recent study, Cheng and Teizer [37] presented an approach aimed at increasing the situational awareness of tower crane operators by aligning an enhanced understanding of the construction site's layout with increased visibility of ground-level operations on the part of the operator. It should be noted that all of the abovemen-tioned methods and technologies have great potential to improve safety in relation to visibility issues in the construction industry. This study contributes to the literature by introducing a newly developed blind spot identication system known as the Virtual Blind Spot Identication System (VIBSIM). The VIBSIM facili-tates blind spot identication not only for construction equipment, but also for construction areas such as stairs as well as slab and wall openings. The proposed system can be viewed as an alternative to the current blind spot identication methods.
2. Methods
The VIBSIM was designed to identify and examine blind spots in construction equipment and areas of the construction site, including stairs and slab and wall openings. As a part of this system, 3D models of construction sites and equipment are developed using 3ds Max 2012, one of the most powerful software systems for comprehensive modeling, as the foundation platform. Three-dimensional construction equipment models are generally provided by manufacturers. How-ever, in the absence of construction project models, a 3D model of the project should be modeled using the available drawings. The analysis methods used in the VIBSIM are all based on real-life rules and factors. The 3D models that form the basis of the project must be as close to reality as possible. Thus, during the transfer to 3ds Max phase of the project, several important points should be considered:
The construction project and equipment scales must be the same as the actual measurements of the real model;
All prepared 3D models should have the same details and parts as the real model;
Any modeling errors in the imported models have to be reconsidered;
Both mirror and glass mesh have to be modeled as are;
Unneeded mesh should be deleted.
The 3ds Max software was used in the preparation of a simulation space for the blind spot analysis, while V-Ray, one of the most powerful 3ds Max rendering engines, was used in the blind spot analysis phase. The use of V-Ray's computing power provided the most re-alistic blind spot simulation possible. However, in order to achieve the desired result, some changes were made to V-Ray's results assembly method. Normally, V-Ray provides two-dimensional images, so changes had to be made to provide 3D analyzable results. Virtually all modern global illumination renderers are based on the rendering equation introduced by Kajiya [38] who also proposed a method for computing an image based on the rendering equation using a Monte Carlo method called path tracing. Dierent formulations for the rendering equation are possible, but the one proposed by Kajiya [38], which is also used in this study, is as follows:
L(x; x1) =g(x; x1)
h e(x; x1)
+ Z
sr(x; x1; x2)L(x1; x2)dx2
; where:
L(x; x1) is related to the light passing from
point x1 to point x;
g(x; x1) is a geometry (or visibility) term;
e(x; x1) is the intensity of light emitted from
point x1 towards point x;
r(x; x1; x2) is related to the light scattered from
point x2 to point x through point x1;
S is the union of all surfaces in the scene, while x, x1, and x2 are points from S.
The above equation states that the transport intensity of light from one surface point to another is simply the sum of the emitted light and the total light intensity that is scattered toward x from all other surface points [38]. The V-Ray irradiance map calculation method was used to obtain 3D point cloud models. Irradiance is a function dened for any point in the 3D space, and it represents the light arriving at
this point from all possible directions. In V-Ray, the term \irradiance map" refers to a method of eciently computing the diused surface irradiance for objects in the scene. The irradiance map is, in fact, a collection of points in 3D space (i.e., a point cloud) along with the computed indirect illumination at those points [39]. This point cloud is almost identical to laser scanner results. Furthermore, all of these points are fully computer-based, and they are prepared without the need for a physical model and environment.
Various types of equipment are used on con-struction sites, each of which has its own specic physical and visual parameters. Similarly, construction sites dier from each other and all have their own specic properties. While 3D models of construction equipment can be created and used as modular types for dierent projects, it is almost impossible to create a modular type for construction sites. Therefore, each construction site has to be modelled separately in order to identify the blind spots. The same is partly true for construction workers. When gathering a worker point cloud, their heights and visual distances have to be considered. Further, as each worker has a distinct height and visual distance, it is inevitable that indi-vidual measurements need to be made. The VIBSIM applications for construction equipment, construction sites, and construction workers are illustrated in the following sections.
3. Case study
The test applications of the proposed system were conducted on a building construction site in Ankara, Turkey. The main purpose of the case study was to validate the system in a real construction project and examine its feasibility in identifying blind spots. 3.1. Application of the VIBSIM in
construction equipment
Two pieces of construction equipment, namely, a hy-draulic excavator and a dump truck, were selected for blind spot analysis at the construction site. The 3D models necessary for the VIBSIM analysis were prepared using 3ds Max.
Based on ISO 5006 specications [40], the test domain radius was set to 12 m. In the VIBSIM, the central angle view of a person is considered to be 40-60 degrees. Therefore, the person sees an image close to the camera image with a focal length of 50 mm [41]. In this model, two cameras with a range of 65 mm were used to simulate the equipment operator's vision. Based on ISO 5006 standards [40], the cameras were located 68 cm above the operator's seat in order to obtain an approximate model of the operator's view (Figure 1).
Figure 1. Height of the cameras above the operator's seat.
Figure 2. Angles and directions used in the VIBSIM: (a) North view, 0angle, (b) northwest view, 45angle, (c) northeast view, 45angle, (d) west view, 87:5angle, (e) east view, 87:5angle, (f) clockwise south view, 167:5 angle, and (g) counter-clockwise south view, 167:5angle.
head up to 80-95 degrees without twisting their body. Twisting the body can increase oscillation to 160-175 degrees [42]. Based on these numbers, directions and angles were specied in the VIBSIM model as shown in Figure 2. In addition to these angles, views from the mirror and closed-circuit television camera were added to analyze the views and directions.
After placing the cameras on the equipment in the specied locations, each camera was analyzed to create point clouds of the models using V-Ray irradiance maps derived from indirect illumination. In order to obtain better and more unied results, the irradiance maps of
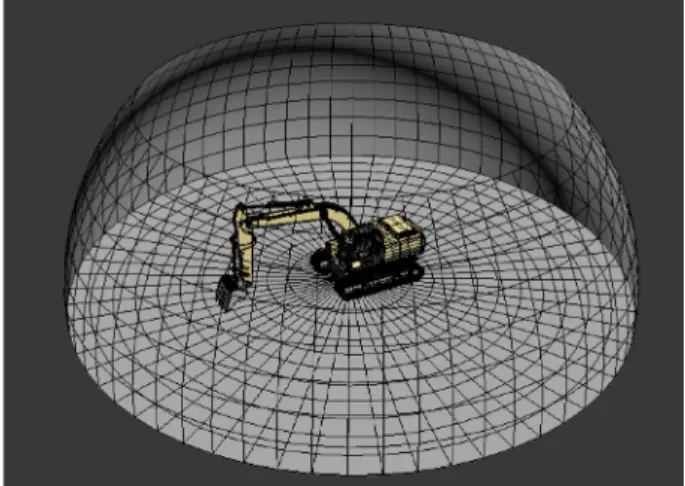
Figure 3. Model prepared to analyze the blind spots of the hydraulic excavator.
Figure 4. Blind spots of the hydraulic excavator.
the two pieces of equipment were merged together in the irradiance map settings.
Figures 3 and 4 show the 3D point cloud results of the hydraulic excavator model used in the VIBSIM. The shaded areas illustrate the blind spot areas of the equipment, while the dark areas represent the visible points. The cropped hemisphere is the maximum range of the operator's eective sight.
The blind spots prepared in the 3D model space make it possible to examine the analysis results from various points of view. Moreover, in order to gain more detailed blind spot information, it is also possible to calculate the percentage of blind spots by dividing the blind spot volume by the total volume (i.e., blind spots plus visible spaces) using 3ds Max. A similar method was used in the study conducted by Teizer et al. [10]. In their study, to calculate the percentage of blind spots in the 3D grid, they counted the number of cubes that were labeled as part of the \blind" spots and the number of cubes that were labeled \visible"; nally, they obtained the percentage of blind spots by dividing the sum of the number of blind cubes by the sum of the number of blind and visible cubes.
A 3D model analysis can be performed for each piece of construction equipment using the same
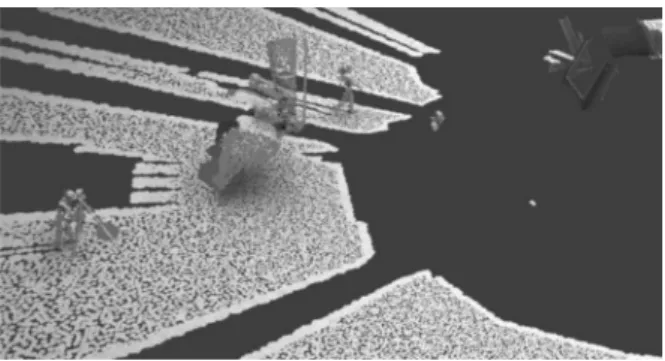
Figure 5. An example of the distribution of workers around the excavator.
Figure 6. Point cloud analysis of workers around the excavator.
method. In addition to creating these 3D models, it is also possible to determine the distances and coordinates at which both equipment and workers enter the risk area. For example, the point where a worker who is 175 cm tall enters the danger zone can easily be determined. In this regard, 3D point clouds that have been obtained in advance can be used to determine the locations of workers of any height in dierent areas of the construction site. Figures 5 and 6 provide an example of workers' locations around the excavator. As shown in Figure 6, workers in equipment blind spots can be identied, and the data can then be used to take precautions and help prevent future accidents. Importantly, the models of the real site can be updated when changes are made on site. The VIBSIM allows the addition of any on-site changes to the virtual model as well as the re-building of the point cloud.
The analysis results of the VIBSIM in terms of identifying blind spots in construction equipment show similarities with those of previous studies [9-11,21,22,26,27]. However, the method used in the VIB-SIM is totally virtual and does not require any actual laser scanning results, which is a point of distinction from the previous blind spot identication methods. 3.2. Application of the VIBSIM to
construction workers
The VIBSIM was also tested on construction workers.
Figure 7. Active blind spots caused by movement (left view: blind spot analysis before movement; right view: blind spot analysis after 2 m of forward movement).
The same camera types were used for the worker analysis as were used for the equipment analysis. The cameras had a 43 mm focal length and a 45 lm gate
with 3:2 aspect ratio. The cameras' height was 170 cm, which was considered to be the standard height of a worker. Thus, an approximate perspective view model of a worker was determined.
According to the VIBSIM's blind spot test analy-sis, if a worker focuses on a specic point, their eld of view drops to 60-100 degrees. Thus, the constant blind spot area of a worker is approximately 260-300 degrees. Another nding is that although a worker has a xed point of view, their eld of vision changes precisely while the worker is moving. During movement on a construction site, a worker takes their blind spot cloud with them, and so the danger zones are constantly changing according to the movement of the worker. These blind spots are referred to as active blind spots (Figure 7).
The left view of Figure 7 shows the minimum detection distance of a worker who is standing, which is about 4.5 m. As shown in the right view of Figure 7, an opening placed 5.35-6 m from the test's source object disappeared from view after the simulated worker moved 2 m forward. Therefore, it can be stated that a lack of dynamic blind spot identications endangers the lives of workers. For this reason, in addition to xed blind spots, active blind spots need to be taken into account to ensure the safety of construction workers. 3.3. Application of the VIBSIM on
construction site
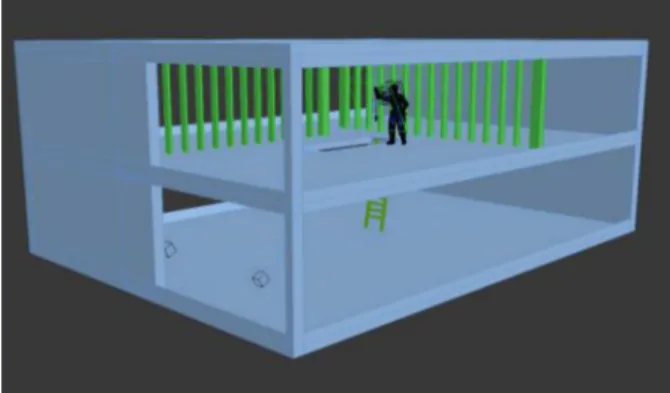
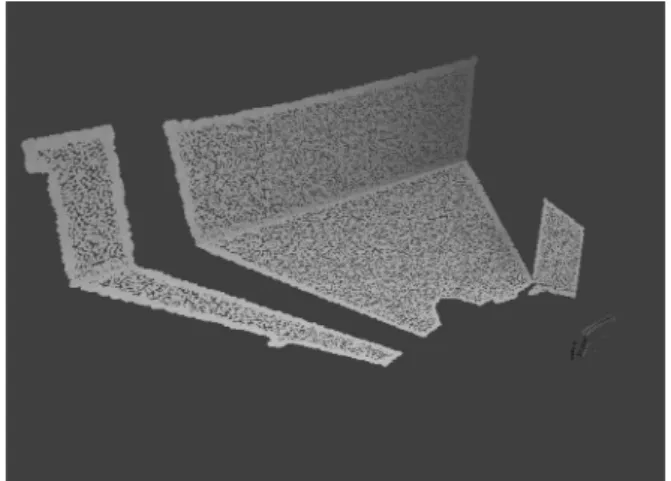
In addition to the visual diculties posed by con-struction equipment and workers, visibility problems can also be caused by the physical conditions of construction sites. Slabs, stairs, and wall openings during the construction phase are among the major factors involved in severe accidents. In order to identify the visibility problems caused by these openings, a 3D model of our construction site was prepared. Using the workers' perspectives obtained in the previously described manner, a simulation of the real environment was obtained in the VIBSIM. Figures 8 and 9 illustrate the VIBSIM analysis results concerning workers' visi-bility near slab openings. Since human sight is limited
Figure 8. VIBSIM model of a worker near a slab opening.
Figure 9. VIBSIM simulation results concerning a worker's visibility near a slab opening.
to a constant amount of degrees, using the VIBSIM facilitates an analysis of any area where the worker cannot determine their distance to such openings and potential dangerous areas.
A large, unprotected opening on the roof of a building is another type of danger that can lead to serious accidents. Such accidents often occur when workers are laying or repairing a roof, and this results in the worker losing their balance and falling from a height. These falls can cause serious damage or loss of life. The worker's limited eld of view, coupled with their likely focus on issues outside the workplace, is the main reason for these types of accidents. Figures 10 and 11 show the VIBSIM analysis results concerning workers' visibility near roof openings.
As mentioned previously, every piece of construc-tion equipment has its own specic blind spots. The number of blind spots increases in a construction site due to obstacles such as building edges. According to the VIBSIM analysis, the number of blind spots increases as the equipment approaches the corner of a building. Figures 12 and 13 depict the blind spot model and point cloud obtained from the VIBSIM analysis. As shown in Figure 13, although the distance to a collision was very short, the drivers could still not see each other.
One of the advantages of using the VIBSIM is that it does not require real equipment for the blind spot
Figure 10. VIBSIM model of a worker near a roof opening.
Figure 11. VIBSIM simulation results concerning a worker's visibility near a roof opening.
Figure 12. Blind spot model of the corner of a building.
analysis. The analysis can hence be performed in a simulated environment. Therefore, it has the potential to save time in identifying blind spots in construction areas. Further, the blind spot analysis results can easily be adapted to dierent pieces of equipment. As point
Figure 13. VIBSIM analysis of blind spots at the corner of a building.
clouds are independent (i.e., every piece of machinery, type of equipment, labor, and construction site has its own separate blind spot point cloud), it is possible to merge previously computed blind spot point clouds with new ones. Thus, there is no need to renew the entire database for dierent construction sites.
4. Conclusions
Visibility-related accidents comprise a signicant por-tion of total accidents in the construcpor-tion industry. Blind spots on construction equipment and a lack of visibility in some areas of construction sites are major factors that lead to visibility-related fatal construction accidents. In this study, the VIBSIM, a newly de-veloped virtual blind spot identication system, was presented. The VIBSIM was designed to identify and examine the blind spots found on construction equipment and construction areas such as stairs and slab and wall openings. The VIBSIM analysis method can be seen as an alternative to the current blind spot identication methods. Manual methods of identifying blind spots are certainly low in cost, but their accuracy level is also low. Therefore, in order to fulll the main purpose of the VIBSIM model, it was designed to be a computer-based model.
The VIBSIM is exible in terms of its use. It facil-itates blind spot identication not only for construction equipment, but also for construction site surroundings. This approach represents a point of dierentiation from previous blind spot identication models. The validation of the proposed system was implemented at a real construction site. The VIBSIM analysis results concerning construction equipment, workers, and the construction jobsite indicated that the proposed system could signicantly improve safety applications on con-struction projects. Another advantage of the VIBSIM is that the analysis results can be easily adapted to dierent types of equipment. Moreover, there is
no need to renew the entire database for dierent construction sites. As point clouds are independent, it is possible to merge previously computed blind-spot point clouds with new ones. Using 3D point cloud models obtained with this system can assist construction managers in making decisions regarding how to better manage safety applications by identifying dangerous work areas and preventing accidents during the construction phase. Thus, the potential of the VIBSIM to reduce visibility-related accidents during construction projects oers a great benet to the construction industry.
4.1. Limitations
In the V-Ray irradiance map calculation method, the corresponding margin of error is 0:1 m, which is dened by the program itself. Based on ISO 5006 standards, the experiments were carried out in an area with a 12 m radius. However, an acceptable margin of error in this experiment could extend the area of analysis to a 25 m radius.
The results of this study showed that each piece of equipment or construction site had its own blind spots that were related to its specic properties. In addition, the dierent sizes and visual distances of individual workers resulted in dierent blind spot perceptions. Therefore, taking into account the typical character-istics of workers and types of equipment was critical to the eectiveness of the system. Another limitation of the study was that the analyses were conducted for only one building construction site. Hence, future studies conducted for dierent construction sites should enhance the ndings of this study.
Acknowledgments
This research was supported by the Scientic and Technological Research Council of Turkey (TUBITAK, Project No. 112M889) and the Anadolu University Scientic Research Projects Commission (Project No. 1204F064).
References
1. Wua, W., Gibb, A.G.F. and Li, Q. \Accident pre-cursors and near misses on construction sites: an investigative tool to derive information from accident databases", Saf. Sci., 48(7), pp. 845-858 (2010).
2. Bureau of Labor Statistics, Census of Fatal Occupa-tional Injuries (CFOI) - Current and Revised Data (2014).
3. Mohamed, S. \Empirical investigation of construction safety management activities and performance in Aus-tralia", Saf. Sci., 33(3), pp. 129-142 (1999).
4. Marks, E.D. and Teizer, J. \Method for testing proximity detection and alert technology for safe
construction equipment operation", Constr. Manag. Econ., 31(6), pp. 636-646 (2013).
5. Zhang, S., Teizer, J., Lee, J.K., Eastman, C.M. and Venugopal, M. \Building information modeling (BIM) and safety: automatic safety checking of construction models and schedules", Automat. Constr., 29, pp. 183-195 (2013).
6. OSHA, OSHA Seeks Comments on How to Prevent Worker Injuries and Deaths from Reinforcing Concrete Activities and Vehicle Backovers, Occupational Safety & Health Administration (2012).
7. Fosbroke, D.E. \NIOSH reports! Studies on heavy equipment blind spots and internal trac control", Roadway Work Zone Safety & Health Conference, Baltimore, Maryland (2004).
8. Akula, M., Lipman, R.R., Franaszek, M., Saidi, K.S., Cheok, G.S. and Kamat, V.R. \Real-time drill moni-toring and control using building information models augmented with 3D imaging data", Automat. Constr., 36, pp. 1-15 (2013).
9. Ray, S.J. and Teizer, J. \Computing 3D blind spots of construction equipment: Implementation and evalua-tion of an automated measurement and visualizaevalua-tion method utilizing range point cloud data", Automat. Constr., 36, pp. 95-107 (2013).
10. Teizer, J., Allread, B.S. and Mantripragada, U. \Au-tomating the blind spot measurement of construction equipment", Automat. Constr., 19, pp. 491-501 (2010).
11. Hinze, J.W. and Teizer, J. \Visibility-related fatalities related to construction equipment", Saf. Sci., 49(5), pp. 709-718 (2011).
12. Zhou, Z., Irizarry, J. and Li, Q. \Applying advanced technology to improve safety management in the construction industry: a literature review", Constr. Manag. Econ., 31(6), pp. 606-622 (2013).
13. Teizer, J., Cheng, T. and Fang, Y. \Location tracking and data visualization technology to advance construc-tion ironworkers' educaconstruc-tion and training in safety and productivity", Automat. Constr., 35, pp. 53-68 (2013).
14. Pradhananga, N. and Teizer, J. \Automatic spatio-temporal analysis of construction site equipment op-erations using GPS data", Automat. Constr., 29, pp. 107-122 (2013).
15. Yang, L.R. \Impacts of automation technology on quality of project deliverables in the Taiwanese con-struction industry", Can. J. Civil Eng., 36(3), pp. 402-414 (2009).
16. Ko, C.H. \Integrating RFID, web-based technology, and articial intelligence in engineering management",
Scientia Iranica - Transactions A: Civil Engineering, 22(2), pp. 299-312 (2015).
17. Gai, M., Cho, Y.K. and Xu, Q. \Real-time 3D visu-alization of heavy construction equipment operations using LADAR", Proceedings of Computing in Civil Engineering, pp. 889-896 (2013).
18. Choe, S., Leite, F., Seedah, D. and Caldas, C. \Evaluation of sensing technology for the prevention of backover accidents in construction work zones", ITcon., 19, pp. 1-19 (2014).
19. Cho, Y.K. and Gai, M. \Projection-recognition-projection method for automatic object recognition and registration for dynamic heavy equipment oper-ations", Journal of Computing in Civil Engineering, 28, Special Issue: 2012 International Conference on Computing in Civil Engineering, A4014002 (2014).
20. Wang, C. and Chob, Y.K. \Smart scanning and near real-time 3D surface modeling of dynamic construction equipment from a point cloud", Automat. Constr., 49, pp. 239-249 (2015).
21. Ru, T.M. \Monitoring blind spots - a major concern for haul trucks", Eng. Min. J., 202(12), pp. 17-26 (2001).
22. Hefner, R.E., Construction Vehicle and Equipment Blind Area Diagrams, National Institute for Occupa-tional Safety and Health (2004).
23. NIOSH, Highway Work Zone Safety, Center for Dis-ease Control and Prevention (2011).
24. Teizer, J. \3D range imaging camera sensing for active safety in construction", ITcon., 13, pp. 103-117 (2008).
25. Teizer, J., Allread, B.S., Fullerton, C.E. and Hinze, J. \Autonomous pro-active real-time construction worker and equipment operator proximity safety alert sys-tem", Automat. Constr., 19, pp. 630-640 (2010).
26. Marks, E.D., Cheng, T. and Teizer, J. \Laser scanning for safe equipment design that increases operator visibility by measuring blind spots", ASCE J. Constr. Eng. Manag., 139(8), pp. 1006-1014 (2013).
27. Bostelman, R., Teizer, J., Ray, S.J., Agronin, M. and Albanese, D. \Methods for improving visibility mea-surement standards of powered industrial vehicles", Saf. Sci., 62, pp. 257-270 (2014).
28. Li, H., Chan, G. and Skitmore, M. \Integrating real time positioning systems to improve blind lifting and loading crane operations", Constr. Manag. Econ., 31(6), pp. 596-605 (2013).
29. Wua, H., Tao, J., Li, X., Chi, X., Li, H., Hua, X., Yang, R., Wange, S. and Chen, N. \A location based service approach for collision warning systems in concrete dam construction", Saf. Sci., 51(1), pp. 338-346 (2013).
30. Shapira, A., Simcha, M. and Goldenberg, M. \Inte-grative model for quantitative evaluation of safety on construction sites with tower cranes", ASCE Constr. Eng. Manag., 138(11), pp. 1281-1293 (2012).
31. Shapira, A., Filin, S. and Wicnudel, A. \Quantitative analysis of blind tower-crane lifts using laserscan-ning information", Constr. Innov., 14(3), pp. 383-403 (2014).
32. Lee, G., Cho, J., Ham, S., Lee, T., Lee, G., Yun, S.H. and Yang, H.J. \A BIM- and sensor-based tower crane navigation system for blind lifts", Automat. Constr., 26, pp. 1-10 (2012).
33. Lee, U.K., Kang, K.I., Kim, G.H. and Cho, H. \Improving tower crane productivity using wireless technology", Comput-Aided Civ. Inf., 21(8), pp. 594-604 (2006).
34. Shapira, A., Rosenfeld, Y. and Mizrahi, I. \Vision system for tower cranes", ASCE J. Constr. Eng. Manag., 134(5), pp. 320-332 (2008).
35. Fang, Y. and Teizer, J. \A multi-user virtual 3D training environment to advance collaboration among crane operator and ground personnel in blind lifts", Proceedings of the Computing in Civil and Building Engineering, ASCE, pp. 2071-2078 (2014).
36. Cheng, T. and Teizer, J. \Real-time resource location data collection and visualization technology for con-struction safety and activity monitoring applications", Automat. Constr., 34, pp. 3-15 (2013).
37. Cheng, T. and Teizer, J. \Modeling tower crane operator visibility to minimize the risk of limited situational awareness", ASCE J. Comput. Civil Eng., 28(3), 04014004 (2014).
38. Kajiya, J.T. \The rendering equation",
SIGGRAPH '86 Proceedings of the 13th Annual Conference on Computer Graphics and Interactive Techniques, 20(4), pp. 143-150 (1986).
39. Laub, S., VRAY for C4D 1.0 Manual & Starter Guide (2007).
40. ISO \Earth-moving machinery-Operator's eld of view-Test method and performance criteria", Interna-tional Standard, Part 2: Evaluation Method (2011).
41. Maunder, M.J. de F. and Moore, P., Lights in the Sky: Identifying and Understanding Astronomical and Me-teorological Phenomena, Springer Publishing, London (2007).
42. Barber, E.L. \Strength and range-of-motion exami-nation skills for the clinical orthoptist", J. Prosthet. Orthot., 5, pp. 49-51 (1993).
Biographies
Serkan Kivrak is an Assistant Professor in the Civil Engineering Department, Eskisehir, Turkey. His re-search interest includes IT in construction, knowledge management, cross-cultural management, and health and safety in construction.
Farrokh Rostami Kia obtained his Master of Science in Construction Management from Anadolu University, Turkey. His research interest includes IT in construc-tion and health and safety in construcconstruc-tion.