Alexandria R. Marder. Feeding Shoppers’ Minds and Bellies: Using Faceted Navigation to Improve Information Access on a Farmers’ Market Website. A Master's paper for the M.S. in I.S. degree. March 2012. 47 pages. Advisor: Stephanie W. Haas
This paper describes a study testing two different versions of the Chapel Hill Farmers’ Market’s website, one with faceted navigation and one without. Forty participants were recruited from the farmers’ market to view one version of the website or the other. Both groups were given the same questionnaire with questions about what products were available at the market. The website was populated with information from July to give a broad array of information to search through.
Participants who viewed the website with faceted navigation scored significantly higher on the questionnaire. This demonstrates the validity of faceted navigation as a way to improve information access on farmers’ market websites in general.
Headings:
Faceted classification
Web site development
Web sites -- Use studies
FEEDING SHOPPERS’ MINDS AND BELLIES: USING FACETED NAVIGATION TO IMPROVE INFORMATION ACCESS ON A FARMERS’ MARKET WEBSITE
by
Alexandria R. Marder
A Master's paper submitted to the faculty
of the School of Information and Library Science
of the University of North Carolina at Chapel Hill
in partial fulfillment of the requirements
for the degree of Master of Science in
Information Science.
Chapel Hill, North Carolina
March 2012
Approved by:
________________________
Stephanie W. Haas
Contents
List of tables ... 2
Acknowledgments ... 3
Introduction ... 4
Literature review ... 7
Sources of information for food shoppers ... 7
Enhancing the shopping experience ... 8
Faceted classification ... 11
Methods ... 14
Overview and use cases ... 14
Website design ... 14
Facets and content ... 17
Participants ... 20
Procedure ... 21
Questionnaire ... 22
Measures... 24
Results ... 26
Discussion ... 32
Limitations ... 35
Conclusion ... 36
References ... 37
Appendices ... 39
A: Existing home page ... 39
B: Control home page ... 40
C: Experimental home page ... 41
D: Search results for “July 16 2011” and “Vegetables and Herbs: Cucumbers” ... 42
Questionnaire ... 43
List of tables
Table 1. Examples of Products by Group, Type, and Variety ...19
Table 2. Scoring rubric for Q1 through Q4...24
Table 3. Participants by attribute ...26
Table 4. Mean scores by group: Q1 to Q5 ...27
Table 5. Mean scores by date: Q1 to Q5 ...27
Table 6. Mean scores by time: Q1 to Q5 ...27
Table 7. Mean scores by gender: Q1 to Q5 ...28
Table 8. Mean scores by age: Q1 to Q5 ...28
Table 9. Mean scores by age and group: Q1 to Q5 ...29
Table 10. Mean scores by time: Q6 to Q8 ...30
Table 11. Mean scores by gender: Q6 to Q8 ...30
Acknowledgments
I would like to thank my husband, Andrew, for his moral support. 3 Cups
provided a pleasant place to work, and caffeine to fuel said work. On the wordpress.org
forum, users widecast and design_dolphin provided the code that allowed me to display
dynamically generated information on custom posts. The Chapel Hill Farmers’ Market’s
manager, Lindsay, and all of its vendors, made it not only possible but also pleasant to do
my study. The market’s customers were a joy to work with. All of my SILS professors
contributed in one way or another to my ability to produce this paper. Finally, my
advisor, Dr. Stephanie Haas, provided inspiration and guidance throughout the process,
Introduction
Farmers’ markets have increased in popularity over the last two decades, just as
the World Wide Web has gained prominence. Yet farmers’ markets, with their traditional
approaches to communication and business, have yet to take full advantage of the
advantages offered by Web-based communication. In keeping with their low-tech,
friendly, community feel, most markets maintain minimal websites with only basic
information. They provide market locations, hours, vendors, and events, but few market
websites offer a more advanced information architecture.
At the same time, farmers’ markets face strong competition from the established
food industry, which has the financial capacity for extensive advertising and marketing.
Farmers’ markets generally have limited budgets and rely on inexpensive forms of
advertising, if they do any advertising at all. The Web can be an easy and inexpensive
way to provide information to customers, but few farmers’ markets take advantage of the
opportunity to differentiate themselves from supermarkets.
One thing customers like most about farmers’ markets is the ability to meet the
farmers who grew the food they are buying. This direct communication engenders trust
and loyalty, but it relies on physical proximity. In recent years, however, the Web has
become more accepted as a proxy for face-to-face communication, meaning farmers’
markets could use their websites to deliver trusted, personal information about their
Farmers’ markets have some competitive advantages over supermarkets in
addition to the personal connection and trust customers experience in talking to vendors.
Because the products are produced locally, they are generally fresher than those found in
supermarkets. They also offer a more direct connection to the seasons. And yet these
advantages also present difficulties. While supermarkets sell products from around the
globe so that almost any type of fruit or vegetable can be offered at any time of year,
farmers’ markets are limited to selling what can be harvested or pulled from storage at a
given point in time. This is something that many shoppers appreciate about farmers’
markets, but it also makes it more difficult for shoppers to take full advantage of the
market. Customers used to planning menus and grocery lists and finding everything they
want in one place have to adopt different strategies at farmers’ markets. They are limited
by what is in season, and they tend to buy a few things that look good instead of shopping
strategically based on what they know will be available. This is one area where farmers’
market websites can provide better value to customers. If customers could find reliable
information on market websites about what food is in season, they could better plan their
market shopping and spend more of their food dollars locally.
But how can farmers’ markets better utilize their websites to provide this
information to customers? Many websites do list a few of the products that will be at
market, but a more systematic approach is needed to provide reliable, timely information.
Faceted navigation is one possible approach. It is already a popular approach on
e-commerce sites to help customers distinguish between products, and it would be a natural
This paper proposes that applying faceted navigation to a farmers’ market website
will increase shoppers’ ability to find information about the market’s seasonal offerings.
The paper describes a study that tested two different versions of an existing farmers’
market website, one with faceted navigation and one without, to determine the effects of
faceted navigation on information seeking. The test involved asking farmers’ market
customers to view one of two versions of the website and answer several questions based
on information included in both versions. The results indicate that participants who
viewed the website with faceted navigation were considerably more successful in finding
information about the market’s vendors and products. To help an existing farmers’
market website take advantage of the findings, the paper includes a basic implementation
plan for applying a prototype faceted navigation system using the WordPress content
Literature review
Nearly every American adult shops for food on a regular basis, but there is limited
research literature on the information needs of food shoppers and the best ways of
providing information to them. Food producers and marketing firms have done extensive
research on the behaviors of shoppers but not necessarily on how to meet shoppers’ needs
for trustworthy information about the food they buy. Some academic and institutional
studies look at the information needs of this group, while others look at existing and
experimental ways of providing information to shoppers. Another set of research looks at
faceted navigation as one promising way of organizing information in general, although
not food information specifically.
Sources of information for food shoppers
Howard’s research on what food-related information California shoppers want
(Howard 2006) and Howard and Allen’s research on ecolabels and food-related
information sources (Howard and Allen 2010) offer the most relevant research results
available on the specific information needs of food shoppers. Howard’s 2006 work
involved focus groups and a survey of California consumers. The survey included
questions about where consumers got food-related information. He found that very few
consumers felt their information needs were being met, and most found food-related
information difficult to come by (p. 16). The information that these consumers did
acquire came mostly from product labels and in-store brochures and displays, with some
respondents finding information in periodicals, in books, and online (p. 17).
Howard and Allen’s research focused mainly on product “ecolabels” such as
the practices used in goods and services that would otherwise remain hidden” (p. 249).
Their survey included questions about food-related information sources in order to
compare interest in ecolabels to other information sources (p. 252). Their results were
very similar to the results of Howard’s earlier research (p. 258).
The International Food Information Council Foundation’s 2010 report includes
valuable data on consumer information sources, particularly for food safety information
(p. 45-56). The report indicates that American consumers receive food safety information
mostly from TV news programs, the internet, newspapers, friends and family, magazines,
cooking shows, and talk shows (p. 36). Their most trusted food safety sources were the
government, health professionals, TV news programs, health associations, food labels,
newspapers, and dietitians (p. 37). Americans tend to get information about food from
food labels, friends and family, grocery stores, health professionals, and the internet, but
many find food and health information confusing (p. 40). Many reported using
information on food labels, especially nutrition information, expiration dates, brand
names, ingredients, and product size, with fewer reporting use of country-of-origin,
organic, and allergen labeling (p. 43). Among reported factors that influenced purchasing
decisions, taste and price were rated most important, followed by healthfulness and
convenience (p. 45). The report states that the vast majority (88%) of Americans do most
of their shopping at supermarkets and grocery stores (p. 46).
Enhancing the shopping experience
Some researchers have investigated how to provide information to buyers of local
food, including farmers’ markets (Light et al. 2010), community-supported agriculture
(Li et al. 2009 and Tofte et al. 2006). Waardhuizen et al. (2005), Li et al. (2009), and
Tofte et al. (2006) all evaluate Web-based tools for providing information to customers,
while Light et al. (2010) evaluate a mobile augmented reality tool and Yang et al. (2009)
evaluate a kiosk located in a grocery store. Some tools under evaluation are meant to
enhance the experience of shoppers who are physically present at a market or grocery
store, while others are meant to be used by remote shoppers in lieu of shopping at a
physical location.
Light et al. (2010) describe novel augmented reality tools that are designed to be
used within the context of a farmers’ market as a way to enhance the shopping
experience. The tools are mobile applications that work with QR codes on display at
market stalls. By scanning the QR codes, shoppers can get more information about each
product, as entered by the researchers. Yang et al. (2009) also write about technologies
meant to enhance food shoppers’ experiences. They describe a grocery store kiosk system
that aims to provide local food education to low-income shoppers in Detroit. They
emphasize the importance of providing information and education in order to increase
demand for local produce (p. 3). Their system envisions a system that will help shoppers
plan their local food purchases when they enter the store and then plan how to use their
purchases when they leave.
Waardhuizen et al. (2005) explore the use of Web technologies to augment a
traditional shopping experience. They describe a new prototype website for
community-supported agriculture (CSA), which is a movement that shares with farmers’ markets a
focus on local agriculture and building a community around local food. Their proposed
producers. The users were anxious to have a system that would not replace the personal
communication of the old system but streamline the ordering process for members,
organizers, and producers. The prototype resulted in fewer ordering and accounting errors
by allowing them to focus on the physical processes of produce packaging and delivery
rather than record keeping.
Li et al. (2009) and Tofte et al. (2006) evaluate existing tools for online ordering
without the physical location component of a CSA pickup center or a farmers’ market. In
their design of a website that connects farmers directly with consumers, Li et al. (2009)
note the importance for consumers in establishing trust and the value for farmers in
having online data to assist them in tracking trends (p. 3).
Meanwhile, Tofte et al. (2006) describe the design of a faceted navigation
interface for the e-commerce website of the Norwegian state-run wine and spirits store.
Faceted navigation relies on the classification of a site’s content into multiple facets, or
categories. Rather than a hierarchical classification system such as the ones used in
traditional library cataloguing, a faceted system uses multiple categories to describe a
single object. This allows the system’s users to gradually narrow the focus of their search
using different aspects of the information they are seeking. The interface developed by
Tofte et al. (2006) included facets representing type, price, country of origin, grape,
district, product number, manufacturer, and distributor (p. 490). In user testing, customers
used the faceted navigation to differentiate between similar products. It proved to be an
efficient way for the store to provide the sorts of information to its online customers that
navigation can be a powerful way to help customers find the information they need in a
way similar to how they are used to doing their everyday shopping.
Faceted classification
Faceted classification was originally developed as a way of classifying
documents, but it has been extended to the classification of products, especially on
e-commerce websites, where it is often used to help customers find products that fit a
variety of criteria. Broughton (2006) describes the value of faceted classification in a
wide variety of information retrieval tasks. She only briefly discusses faceted
classification on websites such as a wine shop and a library catalog, preferring to focus
on classification of documents. She suggests that what is important is not the facets but
their use in promoting more meaningful information retrieval. She believes future
research should focus on users’ interaction with classification and retrieval tools rather
than on the tools or categories themselves (p. 65).
Fagan (2010) gives a broad overview of faceted browsing usability studies. She
explains faceted browsing and the value it adds to search interfaces such as those for
library catalogs. She then reviews the literature of usability studies on faceted browsing
and offers a summary of findings and suggestions for future study design. In the studies
she looks at, faceted interface users were more successful at searching tasks and
completed them more quickly. Users were also more satisfied with the faceted interfaces
than with non-faceted ones, although several studies found that users sometimes need
time to adjust to the new interface when they are used to one without facets. Fagan
derives a list of best practices for usability studies of faceted interfaces, including
user, and developing meaningful, measurable tasks to establish benchmarks for
comparison. She also suggests studying a large number of users (n>20) and selecting
users with some knowledge of the subject matter covered by the tasks. These best
practices align with the design of the current study.
Wu, Chuang, and Joung (2008) acknowledge the possibilities opened up by
faceted browsing, but they also warn about the cognitive load faceted browsing can place
on users. Their study examines the effects of using context-specific faceted browsing to
help users orient themselves within an automotive e-commerce website. Their system
provides different searching and browsing options depending on which page a user is
viewing. This allows users to retrieve information differently in different contexts. The
researchers situate their study within the field of user-centered design, suggesting that “to
be successful, information systems should be designed around users’ needs and
acceptance. Therefore, the effectiveness of a system should be evaluated from the
perspective of the end-user.” (p. 2875)
Uddin and Janecek (2007) describe the value of faceted classification not only for
users searching a website but also for information architects organizing the website’s
contents in the first place. Their study presents a prototype faceted classification system
for a higher education institution. The prototype can be integrated with an open source
content management system to promote ease and effectiveness of use by both information
managers and information seekers. Their approach supports the classification of
institutional documents through the use of facets such as purpose, topic, people, and area.
Managers of the website are able to tag information with multiple facets and users able to
to handle many diverse kinds of content. It is designed to be used by technically
proficient content managers, which means it can use a more sophisticated database
back-end than what comes out of the box with most open source content management systems.
For end users, Uddin and Janecek’s 2007 prototype offers three different
interfaces: a basic search, an advanced search, and a separate browsing interface. In order
to test the effectiveness of their prototype, Uddin and Janecek (2007) asked users to
compare the prototype, populated with documents from an institutional website, with the
institution’s existing website. Their results show that the faceted classification enables
users to find information more easily, although there is a learning curve associated with
the faceted classification that means some users would need more time with the system to
become familiar with it and use it comfortably.
While there is literature available on some aspects of food shoppers’ information
needs and ways to support their information seeking, there is clearly room for more
research on this group. Specifically, more should be done to study how shoppers interact
with the organizations that sell them food, such as farmers’ markets, and different ways
these organizations can provide information online and in person at markets. As shoppers
become more accustomed to using web-based tools to search for information, farmers’
market websites will have an opportunity to use advanced techniques for presenting and
organizing information for their customers. Faceted navigation is a promising technique
Methods
Overview and use cases
I hypothesized that faceted navigation would enhance users’ ability to find
information about seasonal produce. In order to test my hypothesis, I developed a study
to test two different versions of the existing Chapel Hill Farmers’ Market’s website: a
simplified version of the existing website and a second version with identical content and
an alternative information architecture that employed faceted navigation. I asked study
participants to view one or the other version of the website and complete a questionnaire
based on typical market shopper use cases.
The use cases I developed to determine the facets were based on my own
experience as a farmers’ market shopper. The tasks I wanted shoppers to be able to
complete using the website included looking for specific items, for all sources of an item,
for all varieties of an item, and for items available at particular times of year.
Use case 1: Can you buy certain ingredients at the market?
Use case 2: How many different vendors are selling a specific product?
Use case 3: How many different varieties of a product can you buy?
Use case 4: Which products can you buy year round?
Website design
The existing Chapel Hill Farmers’ Market website (see Appendix A) is built in
WordPress, a free open source content management system that is popular among
WordPress as well, so that my content and navigation structure could be used with the
existing website if it proved to be helpful to users. Developing a WordPress structure
could also make the results of my research more portable to other market websites,
increasing the potential reach of the study.
I began the website development process by exporting content from the existing
Chapel Hill Farmers’ Market website. I created two sub-domains on my own personal
hosted WordPress installation. I installed a very basic theme, Coraline
(http://wordpress.org/extend/themes/coraline), on both sub-domains, then imported the
content from the existing website into each one using the WordPress Importer plug-in
(http://wordpress.org/extend/plugins/wordpress-importer/).
I wanted to isolate the effects of the faceted navigation, so I developed both
versions of the website with an identical look and feel and identical content (see
Appendix B for the control website). I carefully coordinated the themes, settings, images,
and pages between the two versions. Once I had the two websites set up identically, with
domain names (testa and testb) that did not give away which one was the experiment and
which the control, I started developing the experimental version (testa). I started by
adding the Types plug-in (http://wordpress.org/extend/plugins/types/), which allowed me
to define custom post types and taxonomies. Post types are different types of content. The
default post types in WordPress are page, for static content, and post, for blog-style
content. A custom post type allows a website administrator to define a new post type with
content fields and formatting of her choice. Taxonomies are organizational schemes. The
default taxonomies in WordPress are categories, for static content, and tags, for
organizational scheme with a controlled vocabulary for describing posts. For my
experimental website, I created a custom post type and a custom taxonomy for each facet.
In order to allow users to complete the questionnaire, I designed an interface for
users to browse and search for information. I tried several different plug-ins before
settling on Query Multiple Taxonomies
(http://wordpress.org/extend/plugins/query-multiple-taxonomies/), which allows users to filter posts using multiple custom
taxonomies. The plug-in adds a widget, which I placed in the left sidebar. It creates a
dropdown menu for each facet. Users can then choose one or more facets by which to
search (see Appendix C). The interface is minimalist and includes no instructions for
users, but it appears on the left side of the page in an area often used for navigation. The
plug-in generates search results as a list of links to posts (see Appendix D). I edited the
source code for the theme and templates to style the list of results so that users would see
a list of links to click on for more information.
In an effort to simplify maintenance of the website, I used PHP code to
automatically generate the content of each post. I added the Exec-PHP plug-in
(http://wordpress.org/extend/plugins/exec-php/) so I could add PHP code to each post to
display the taxonomy terms associated with it. The Exec-PHP plug-in also required the
Members plug-in (http://wordpress.org/extend/plugins/members/), which allows site
administrators to determine which site users are allowed to add PHP code to the site. The
PHP code displayed in the post for each market, the vendors and products associated with
it; for each product, the market and vendors associated with it; and for each vendor, the
I also installed two plug-ins – Custom Taxonomy Order
(http://wordpress.org/extend/plugins/order-up-custom-taxonomy-order/) and Post Types
Order (http://wordpress.org/extend/plugins/post-types-order/) – to impose order on the
results so the interface was easier to use. I ordered each item by group, then type, then
variety, in alphabetical order.
Facets and content
As I populated both versions of the website, I discarded pages not needed for the
use cases, leaving only six pages on each website:
1. Home (market location and hours)
2. About Us (basic information about the market, its mission, and its history)
3. Eat Local Eat Fresh (reasons to eat local food)
4. Weekly Market News (a link to the market newsletter)
5. What’s At Market (lists of general types of food available in different seasons)
6. Farmers and Artisans (information about each vendor)
The use cases involved shopping for particular ingredients, finding vendors
selling a specific product, counting varieties of a product, and exploring which products
were available year round. Based on these use cases, I developed three facets: market
date, product, and vendor. The market date facet allowed me to associate a particular
market date with vendors and products that would be available on that date. The market
date and vendor facets are flat, while the product facet is hierarchical, with different
Using the custom post types plug-in, I created posts for each market date, vendor,
and product. I created only one market date for the study. My research took place in
February 2012, and if I had asked participants to answer the questionnaire about products
at the market on those weekends I would have been limited by the small number of
products available in late winter. I therefore decided to use a market date of July 16,
2011, to ensure that there would be information about a wide variety of products
available on the website.
I created a post for each vendor by extracting the list of vendors from the existing
website and creating a unique post for each one. Creating posts for the products was
much more complicated and time consuming. In order to get a comprehensive list of
products, I created a list of all unique product names from the What’s At Market page
and the July 16, 2011 market newsletter. I separated the products into seven groups, the
groups into types, and the types into varieties. Not every group had types, and not every
Table 1. Examples of Products by Group, Type, and Variety
Group Type Variety
Dairy Cheese Goat cheese, etc.
Eggs
Fruit Apples
Blueberries etc.
Zestar apples, etc.
Meat Beef1
Chicken etc. Non-food items Crafts
Flowers etc.
Sunflowers, etc.
Prepared foods Baked goods Honey etc.
Cinnamon rolls, etc.
Vegetables and herbs2 Arugula Corn
etc. Silver Queen corn, etc.
After organizing all the items, for a total of one market date, 34 vendors, and 159
products, I created a post and a taxonomy entry for each item. The combination of posts
and taxonomy terms allowed me to create connections between individual items across
the three facets.
The custom post type I created for market included taxonomy terms for the
market date, vendors at that market, and products available at that market. The custom
post type for vendor included taxonomy terms for the vendor’s name, the products that
vendor sells, and the market dates on which that vendor would attend. The custom post
type for product included taxonomy terms for the product name, the market dates on
1
I decided not to separate each meat type into varieties such as cuts and different kinds of sausages because my questionnaire focused on vegetables.
2
which that product would be available, and which vendors would sell that product. All
information came from the existing website, including the newsletter for July 16, 2011.
I had to rename some products to make it clear exactly what they were. For
example, several products were simply named White. It was unclear whether they were
white corn, white onions, white potatoes, or white tomatoes (apparently these really do
exist). To address this problem, I renamed each of these products as White corn, White
onions, etc. I also renamed the taxonomy terms for all the products to indicate which
group and type they belonged to, so White became, for example, Vegetables and herbs:
Corn: White.
The content and structure of the experimental website ensured that participants
would be able to complete the tasks on the questionnaire. For example, in order to answer
the question about the number of vendors selling cucumbers, participants could select
Vegetables and herbs: Cucumbers from the product name dropdown menu and submit
the query. The website would then display a list of market dates, vendor names, and
product names associated with cucumbers. Participants need only count the number of
vendors in the search results to arrive at the correct answer. Participants using the control
website would have to search the website and the newsletter separately and create a
running list of individual vendors in order to arrive at the same total.
Participants
The study concerned use of the farmers’ market website by its customers, so the
study population consisted of shoppers at the Chapel Hill Farmers’ Market. The sample
questionnaire. All participants received three-dollar shopping vouchers as compensation.
The study was approved by the University of North Carolina at Chapel Hill’s Institutional
Review Board.
I recruited participants at the Chapel Hill Farmers’ Market in the parking lot of
the University Mall on February 11, 18, and 25. Recruiting took place by posting signs,
asking market vendors to spread the word, and approaching shoppers at the market and
inside the mall near the market entrance. I tried to be unobtrusive, waiting for customers
to finish their shopping before I asked if they would be willing to participate in my study.
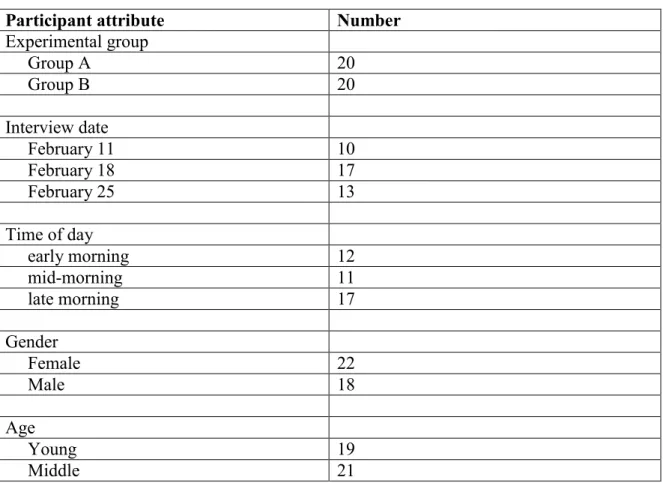
I wanted to gain a broad sample of participants, so I stratified the sample across
attributes: interview date, time of day, gender, and age. I carried out the study on the
mornings of three days (February 11, February 18, and February 25). I also divided each
morning into three one-hour time periods (early morning – 9 am to 10 am, mid-morning –
10 am to 11 am, or late morning – 11 am to 12 pm) in case there were differences among
people visiting the market first thing in the morning or later in the day. I recorded
participants’ gender and general age category (young or middle-aged). I did not ask
participants their ages; the general category was based on my best estimate. I recorded
this information because I suspected age might have an impact on participants’
performance due to differing levels of technical capability.
Procedure
Participants were randomly assigned to one of two groups to determine which
version of the website they would see. There is no Wi-Fi access at the market, so I led
access. I read the consent form to each participant, verifying that each person was over 18
and was willing to participate. I then showed them the website and explained the
questionnaire and the context (asking them to pretend it was mid-July to answer the
questions based on what was on the website, not what was at the market that actual day).
I then left the table so as not to distract them and set my watch for 10 minutes. After 10
minutes I asked each participant to stop. I then collected the questionnaire and stored it
for later analysis.
Questionnaire
The questionnaire asked participants to complete a series of information-seeking
tasks based on the use cases I devised. It included multiple-choice and free-text questions
to test information retrieval as well as the overall effectiveness of the website.
The first four questions on the questionnaire were factual and were based on the
use cases. They could all be answered using information found on both websites.
Question five was more broadly evaluative, concerning how helpful the website would be
for planning meals for a week. Questions six through 12 regarded participants’ use of the
market and its website.
Q1 – Use case 1: You want to make Salade Nicoise. Which of these ingredients
can you buy at the market today? (Lettuce, Potatoes, Green Beans, Eggs,
Tomatoes, Tuna, Olives)
Q2 – Use case 2: You want to shop around for cucumbers. How many different
Q3 – Use case 3: You love local tomatoes. How many different tomato varieties
can you buy at the market today?
Q4 – Use case 4: Your kids like to eat the same foods every week. What can you
buy at the market year round?
Q5: You want to plan your meals for the next week. How helpful would the
website be for planning? (1=Not at all helpful to 5=Very helpful)
Q6: Approximately how often do you visit the farmers’ market? (1=Almost never
to 5=Every week)
Q7: Approximately how much of your weekly food budget is spent at the farmers’
market? (1=0-20% to 5=81-100%)
Q8: Approximately how often do you visit the Chapel Hill Farmers’ Market
website? (1=Almost never to 5=Every week)
Q9: Approximately how often do you use websites to plan your food shopping?
(1=Almost never to 5=Every week)
Q10: What do you like about the website?
Q11: What do you dislike about the website?
Measures
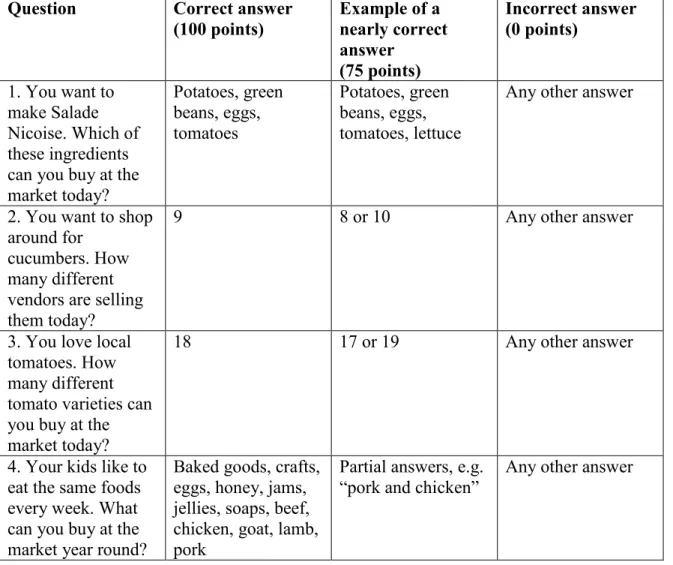
In order to analyze the results of the questionnaire, I assigned a score for each of
the four fact-based questions. Answers that were exactly correct received 100 points.
Answers that were nearly correct (plus or minus one) received 75 points. All other
answers received zero points (see Table 2). I performed unpaired t tests assuming unequal
variance to determine the statistical significance of the results.
Table 2. Scoring rubric for Q1 through Q4
Question Correct answer
(100 points)
Example of a nearly correct answer (75 points)
Incorrect answer (0 points)
1. You want to make Salade Nicoise. Which of these ingredients can you buy at the market today? Potatoes, green beans, eggs, tomatoes Potatoes, green beans, eggs, tomatoes, lettuce
Any other answer
2. You want to shop around for
cucumbers. How many different vendors are selling them today?
9 8 or 10 Any other answer
3. You love local tomatoes. How many different tomato varieties can you buy at the market today?
18 17 or 19 Any other answer
4. Your kids like to eat the same foods every week. What can you buy at the market year round?
Baked goods, crafts, eggs, honey, jams, jellies, soaps, beef, chicken, goat, lamb, pork
Partial answers, e.g. “pork and chicken”
Questions five through nine resulted in answers ranging from one to five.
Questions 10 through 12 elicited free-text responses, which I broadly categorized and
Results
Table 3. Participants by attribute
Participant attribute Number
Experimental group
Group A 20
Group B 20
Interview date
February 11 10
February 18 17
February 25 13
Time of day
early morning 12
mid-morning 11
late morning 17
Gender
Female 22
Male 18
Age
Young 19
Middle 21
The null hypothesis for the first four questions was that there would be no
significant difference between the two groups’ scores on the questionnaire. Group A did
significantly better than Group B on Q1, Q2, and Q3. However, Group A did not
perform significantly better than Group B on Q4.
For the fifth question, the null hypothesis was that was that there would be no
significant difference between the two groups’ evaluation of the website. Group A
Table 4. Mean scores by group: Q1 to Q5
Question Group A (n=20) Group B (n=20) p value
Q1 71.25 47.5 0.087*
Q2 63.75 32.5 0.0345**
Q3 63.75 3.75 0.00002***
Q4 83.75 81.25 0.8290
Q5 3.5 2.7222 0.0389**
* significant at p<0.10 ** significant at p<0.05 *** significant at p<0.01
There was no significant difference in performance based on interview date.
Table 5. Mean scores by date: Q1 to Q5
Question February 11 (n=10) February 18 (n=17) February 25 (n=13) p value February 11 vs 18
p value February 11 vs 25
p value February 18 vs 25
Q1 72.5 52.9411 57.6923 0.2389 0.7889 0.4299
Q2 65 36.7647 50 0.1399 0.4585 0.4594
Q3 37.5 27.9412 38.4615 0.6198 0.5596 0.9638 Q4 87.5 79.4118 82.6923 0.5624 0.8164 0.7421 Q5 3.3333 3.0625 3.0769 0.5580 0.5906 0.9748 * significant at p<0.10 ** significant at p<0.05 *** significant at p<0.01
Nor was there a significant difference in performance based on time of day.
Table 6. Mean scores by time: Q1 to Q5
Question early morning (n=12) mid-morning (n=11) late morning (n=17) p value early morning vs mid-morning p value early morning vs late morning p value mid-morning vs late morning
Q1 62.5 56.8182 58.8235 0.7548 0.8185 0.9115 Q2 45.8333 36.3636 57.3529 0.6521 0.5232 0.2751
Q3 25 52.2727 27.9412 0.1894 0.8642 0.2091
Q4 70.8333 81.8182 91.1765 0.5382 0.1654 0.5022
Q5 3 3.3636 3.0625 0.4682 0.8981 0.4884
* significant at p<0.10 ** significant at p<0.05 *** significant at p<0.01
Table 7. Mean scores by gender: Q1 to Q5
Question Female (n=22) Male (n=18) p value
Q1 56.8182 62.5 0.6805
Q2 47.7273 48.6111 0.9535
Q3 38.6364 27.7778 0.4715
Q4 92.0455 70.8333 0.0836*
Q5 3.2381 3 0.5283
* significant at p<0.10 ** significant at p<0.05 *** significant at p<0.01
Age made more of a difference. Young participants did significantly better than
middle-aged participants on Q1, Q2, and Q4.
Table 8. Mean scores by age: Q1 to Q5
Question Young (n=19) Middle (n=21) p value
Q1 72.3684 47.619 0.0673*
Q2 73.6842 25 0.0005***
Q3 44.67368 23.8095 0.1641
Q4 94.7368 71.4286 0.0349**
Q5 3.4444 2.85 0.105
* significant at p<0.10 ** significant at p<0.05 *** significant at p<0.01
To further tease out the differences between experimental groups and age groups,
I examined the differences in scores between Group A and Group B within each age
group. In nearly every case, the participants in Group A scored higher than those in
Group B. On the whole, though, younger participants scored quite a bit higher than older
participants. Differences between groups were significant on more questions for young
participants than for middle-aged participants.
For young participants, Group A did significantly better then Group B on Q1, Q2,
and Q3. For middle-aged participants, Group A did significantly better than Group B
Table 9. Mean scores by age and group: Q1 to Q5
Question Young A (n=11) Young B (n=8)
p value Young A vs Young B
Middle A (n=9)
Middle B (n=12)
p value Middle A vs Middle B
Q1 86.3636 53.125 0.0984* 52.7778 43.75 0.6408 Q2 90.9091 50 0.0374** 30.5556 20.8333 0.6162 Q3 70.4545 9.375 0.0021*** 55.5556 0 0.0133**
Q4 90.9091 100 0.3409 75 68.75 0.7462
Q5 3.6364 3.1429 0.3545 3.3333 2.4545 0.1206 * significant at p<0.10 ** significant at p<0.05 *** significant at p<0.01
For questions six through eight, higher scores indicate more frequent use of the
market (Q6), higher spending as percentage of weekly food budget (Q7), and more
frequent use of the market’s website (Q8). The results of these questions might be
particularly useful to the market manager, especially when considered in the context of
the time at which participants visited the market. It seems that earlier market visitors tend
to be more frequent visitors both to the market and to its website. Gender also seems to
make a difference. Women tend to be more frequent visitors than men to the market and
its website.
The difference between the first hour of the market and the last hour of the market
is particularly striking. Participants in the early morning time slot used the market and its
website significantly more frequently than those in the late morning time slot on Q6 and
Q8. They also used the website significantly more frequently than those in the
Table 10. Mean scores by time: Q6 to Q8
Question early morning (n=12) mid-morning (n=11) late morning (n=17) p value early morning vs mid-morning p value early morning vs late morning p value mid-morning vs late morning
Q6 4.1667 3.5455 2.7059 0.2465 0.0076*** 0.1321
Q7 1.8182 1.8 1.5294 0.963 0.4252 0.4025
Q8 2.9091 1.6364 1.4706 0.0801* 0.0382** 0.7093 * significant at p<0.10 ** significant at p<0.05 *** significant at p<0.01
Female participants scored significantly higher than males on Q8.
Table 11. Mean scores by gender: Q6 to Q8
Question Female (n=22) Male (n=18) p value
Q6 3.5909 3.1111 0.3273
Q7 1.6818 1.6875 0.9841
Q8 2.3636 1.3529 0.0235**
* significant at p<0.10 ** significant at p<0.05 *** significant at p<0.01
Question nine, regarding how often participants used websites to plan their food
shopping, showed no significant differences among groups. The average answer was
2.0769.
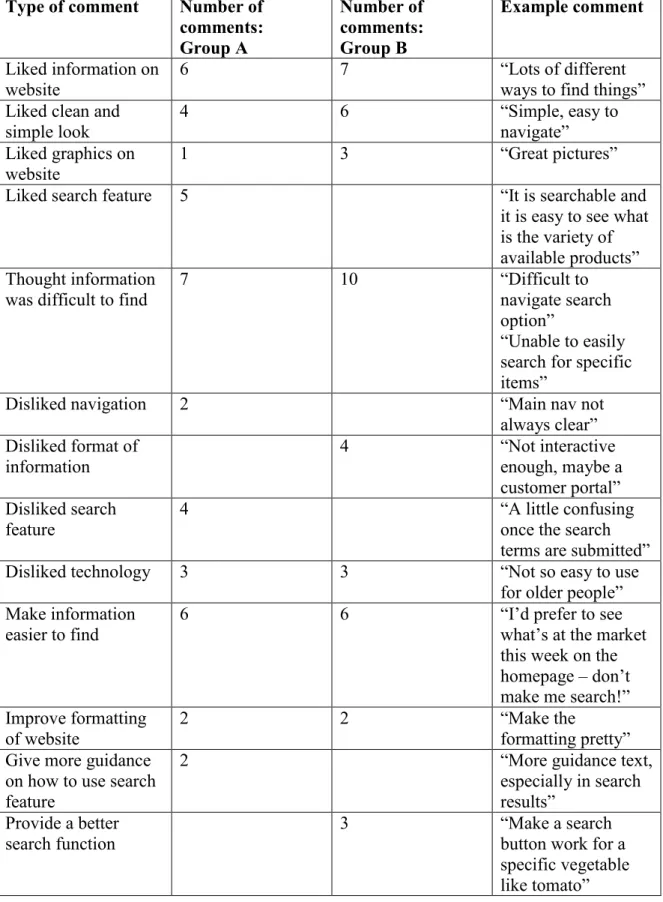
Questions 10 through 12 asked for feedback on the website: what participants
liked and disliked and what suggestions they had. I grouped the comments by topic for
analysis. Participants’ feedback indicates that, while there is much to like about the
Table 12. Summary of comments: Q10 to Q12
Type of comment Number of
comments: Group A Number of comments: Group B Example comment
Liked information on website
6 7 “Lots of different
ways to find things” Liked clean and
simple look
4 6 “Simple, easy to
navigate” Liked graphics on
website 1 3 “Great pictures”
Liked search feature 5 “It is searchable and
it is easy to see what is the variety of available products” Thought information
was difficult to find
7 10 “Difficult to
navigate search option”
“Unable to easily search for specific items”
Disliked navigation 2 “Main nav not
always clear” Disliked format of
information
4 “Not interactive
enough, maybe a customer portal” Disliked search
feature
4 “A little confusing
once the search terms are submitted”
Disliked technology 3 3 “Not so easy to use
for older people” Make information
easier to find
6 6 “I’d prefer to see
what’s at the market this week on the homepage – don’t make me search!” Improve formatting
of website
2 2 “Make the
formatting pretty” Give more guidance
on how to use search feature
2 “More guidance text,
especially in search results”
Provide a better search function
3 “Make a search
Discussion
The purpose of this study was to test the use of faceted navigation in improving
users’ ability to get information from a website about what they could buy at the farmers’
market. The results show clearly that faceted navigation is an effective way of doing this.
There were clear differences between the scores of the two groups. Participants in the
experimental group scored significantly higher on several factual questions and rated the
helpfulness of the website significantly higher than those in the control group.
The widest discrepancy between groups occurred with Q3, which asked
participants to count the number of tomato varieties on offer at the market. Participants
who used the experimental website were able to find the correct answer, or a nearly
correct answer, at a much higher rate than participants who used the control website. In
order to answer this question correctly using the experimental website, users merely had
to select the market date and the product name for tomatoes and submit their query,
whereas participants using the control website had to scan the website and newsletter
separately for every instance of tomatoes and keep a running list of variety names to
count the number of unique varieties. This is one use case where the faceted navigation
made a strong difference in the user experience.
Q4, on the other hand, relied on information from a page that was identical on
both websites (“What’s At Market”). As a result, the two groups’ scores for Q4 differed
much less dramatically. For shoppers looking for a list of products they can buy any time,
the faceted navigation does not improve the user experience dramatically. There was a
because women were more familiar with the existing farmers’ market website and knew
where to find the page.
Overall, participants using the experimental website seemed more comfortable
with the study procedure. In some cases, participants using the control website were
unable to finish the questionnaire because it took longer to find the answers. When the
ten minutes were over, if participants were still writing their answers to the evaluative
questions about the website I let them finish, but if they were still working on the factual
questions about what was available at the market, I asked them to stop and just leave
those answers blank or write that they could not find the answers. Some participants were
concerned that they did not perform well, but I assured each of them that I was testing the
performance of the website, not their skills or knowledge. For some participants, the
technology involved in the study was also problematic. Some of the senior participants,
in particular, were not very adept at using a laptop without a mouse. One eager shopper
wanted to participate but could not use a computer at all.
Recruiting participants was much easier than I had anticipated. I was amazed by
the positive response I got from most people I approached, even if they did not have time
to participate. The ones who were willing to participate were often not only willing but
even enthusiastic. They wanted to take part in the life of the market and do their part to
help improve the website.
The results of this study can be used to improve the Chapel Hill Farmers’ Market
website to make it easier for shoppers to get information about what and who will be at
however. The market will need to continue its work to communicate about the market
and make shoppers aware of its newsletter and website. I was surprised by the number of
people who were unaware that the market even had a website.
This study has implications not only for farmers’ markets but also for other local
organizations. For any group that is information rich but budget poor, a well-structured
website can help inform customers and supporters. The faceted navigation designed for
this study could be adapted for other websites, with custom post types and taxonomies for
Limitations
Some limitations of this study have to do with its participants and its content. The
population sample was limited to customers of one farmers’ market in an area with higher
education and income than the national average and a stronger community interest in
local food than most places. The results thus might not be broadly representative. In
addition, the study tested the ability of shoppers to use a farmers’ market website, but it
did not address how to get shoppers to look at the website in the first place. Further, it
considered only one of many approaches for improving the content of a website: faceted
navigation. Other ways of organizing information might be even more effective. The
study was also limited by the time allowed to complete the task and by the novelty of the
setting. If participants had had more time or had been in a more familiar setting, they
might have performed differently.
There are also some technological limitations of this study. I found many plug-ins
that did most of what I wanted but not all. The limitations of WordPress and its plug-ins
thus acted as a limitation on the study as a whole because they constrained my ability to
create exactly the technology I wanted, especially in the design of the faceted navigation
interface.
Another limitation is that the faceted navigation prototype I developed ended up
being more complicated than I had hoped. With further development, the system could be
implemented in a WordPress website, but it would require a great deal of maintenance –
Conclusion
The results of this study show that faceted navigation is an effective way of
improving access to information about seasonal products on a farmers’ market website.
Participants who viewed the website with faceted navigation were able to find
information about vendors and products that viewers of the existing website could not
find. Their ability to find this information could potentially help them plan their market
shopping more effectively, meaning they might do more of their shopping at the farmers’
market. This might in turn improve the local food economy and enable more people to
enjoy fresh local produce on a regular basis. These results are broadly generalizable to
other farmers’ markets’ websites, as well. Farmers’ markets are currently missing an
opportunity to better reach existing and potential customers by providing a richer
information ecosystem on their websites. Faceted navigation could help them reorganize
their websites to provide better information to their customers.
Market managers and website administrators embarking on this sort of website
improvement should know, however, that adding faceted navigation to a website is not a
simple task. Some might question the payoff in terms of time expended versus increased
customer satisfaction. Markets would do well to survey their customers to gain a better
understanding of their website usage to see how much of an impact such a reorganization
would have on their customers. Ultimately, though, consumers of all types of goods are
relying more and more on websites to gain information about products. Customers
benefit from having more information about what products they can buy, and farmers’
markets benefit from having better informed customers. Faceted navigation is one way of
References
Broughton, V. (2006). The need for a faceted classification as the basis of all methods of
information retrieval. Aslib Proceedings: New Information Perspectives, 58(1-2),
49-72.
Fagan, J.C. (2010). Usability studies of faceted browsing: A literature review.
Information Technology and Libraries, 29(2), 58-66.
Howard, P.H. (2006). Central Coast consumers want more food-related information, from
safety to ethics. California Agriculture, 60(1), 14-19.
Howard, P.H. & Allen, P. (2010). Beyond organic and fair trade: An analysis of ecolabel
preferences in the United States. Rural Sociology, 75(2), 244-269.
International Food Information Council Foundation. (2010). 2010 Food and Health
Survey: Consumer Attitudes Toward Food Safety, Nutrition, and Health.
Washington, DC: International Food Information Council Foundation. Retrieved
from
http://www.foodinsight.org/Resources/Detail.aspx?topic=2010_Food_Health_Sur
vey_Consumer_Attitudes_Toward_Food_Safety_Nutrition_Health
Li, L., Chen, N., Wang, W., & Baty, J. (2009). LocalBuy: A system for serving
communities with local food. Proceedings of the 27th International Conference
Light, A., Wakeman, I., Robinson, J., Basu, A., & Chalmers, D. (2010). Chutney and
relish: Designing to augment the experience of shopping at a farmers’ market.
Proceedings of the 22nd Australasian Computer-Human Interaction Conference,
208-215.
Tofte, I., Saeth, K., & Jansson, K. (2006). A case study of vinmonopolet.no: Faceted
search and navigation for e-commerce. Proceedings of the 4th Nordic Conference
on Human-Computer Interaction, 489-490.
Uddin, M.N. & Janecek, P. (2007). The implementation of faceted classification in web
site searching and browsing. Online Information Review, 31(2), 218-233.
Waardhuizen, M., Peloquin, C., & Kokil, U. (2009). CropConnect: Enabling community
supported agriculture. Proceedings of the 27th International Conference on
Human Factors in Computing Systems, 2799-2804.
Wu, L., Chuang, Y., & Joung, Y. (2008). Contextual multi-dimensional browsing.
Computers in Human Behavior, 24(6), 2873-2888.
Yang, J., Hanratty, M., Ho, G., & Wei, X. MIFresh: Promoting local produce
consumption. Proceedings of the 27th International Conference on Human
Appendices
Questionnaire
For the purposes of this study, the website is being presented as if it were mid-July. Keep that in mind as you answer the questions below.
1. You want to make Salade Nicoise. Which of these ingredients can you buy at the market today?
Lettuce
Potatoes
Green
Beans Eggs Tomatoes
Tuna
Olives 2. You want to shop around for cucumbers. How many different vendors are selling them today?
3. You love local tomatoes. How many different tomato varieties can you buy at the market today?
4. Your kids like to eat the same foods every week. What can you buy at the market year round?
5. You want to plan your meals for the next week. How helpful would the website be for planning?
Not at all helpful
Somewhat helpful
Very helpful
1 2 3 4 5
6. Approximately how often do you visit the farmers’ market?
Almost never Once a month Every week
1 2 3 4 5
7. Approximately how much of your weekly food budget is spent at the farmers’ market?
0-20% 21-40% 41-60% 61-80% 81-100%
1 2 3 4 5
8. Approximately how often do you visit the Chapel Hill Farmers’ Market website?
Almost never Once a month Every week
1 2 3 4 5
9. Approximately how often do you use websites to plan your food shopping?
Almost never Once a month Every week
1 2 3 4 5
10. What do you like about the website?
11. What do you dislike about the website?
Implementation
The study was designed to produce a system that could be implemented on the
existing farmers’ market website. In order to do that, the website administrator would
need to install the following plug-ins:
1. WordPress Importer (http://wordpress.org/extend/plugins/wordpress-importer/)
2. Types - Complete Solution for Custom Fields and Types
(http://wordpress.org/extend/plugins/types/)
3. Exec-PHP (http://wordpress.org/extend/plugins/exec-php/)
4. Members (http://wordpress.org/extend/plugins/members/)
5. Query Multiple Taxonomies
(http://wordpress.org/extend/plugins/query-multiple-taxonomies/)
6. Custom Taxonomy Order
(http://wordpress.org/extend/plugins/order-up-custom-taxonomy-order/)
7. Post Types Order (http://wordpress.org/extend/plugins/post-types-order/)
The custom post types and taxonomies could then be imported from my website
and configured in the market website. The PHP permissions would have to be set for the
website administrator. The query and sorting settings would then have to be configured
within the context of the market website.
The workflow for the website administrator when adding a new market, vendor,