Comparison of Eight Equations
That Predict Percent Body Fat
Using Skinfolds in American Youth
Kimberly P. Truesdale, PhD,
1Amy Roberts, PhD,
1Jianwen Cai, PhD,
3Jerica M. Berge, PhD, MPH,
4and June Stevens, PhD, MS
1,2Abstract
Background:Skinfolds are often used in equations to predict percent body fat (PBF) in youth. Although there are numerous such equations published, there is limited information to help researchers determine which equation to use for their sample.
Methods:Using data from the 1999–2006 National Health and Nutrition Examination Surveys (NHANES), we compared eight published equations for prediction of PBF. These published equations all included triceps and/or subscapular skinfold measurements. We examined the PBF equations in a nationally representative sample of American youth that was matched by age, sex, and race/ ethnicity to the original equation development population and a full sample of 8- to 18-year-olds. We compared the equation-predicted PBF to the dual-emission X-ray absorptiometry (DXA)-measured PBF. The adjustedR2, root mean square error (RMSE),
and mean signed difference (MSD) were compared. The MSDs were used to examine accuracy and differential bias by age, sex, and race/ethnicity.
Results:When applied to the full range of 8- 18-year-old youth, theR2values ranged from 0.495 to 0.738. The MSD between
predicted and DXA-measured PBF indicated high average accuracy (MSD between -1.0 and 1.0) for only three equations (Bray subscapular equation and Dezenberg equations [with and without race/ethnicity]). The majority of the equations showed differential bias by sex, race/ethnicity, weight status, or age.
Conclusions:These findings indicate that investigators should use caution in the selection of an equation to predict PBF in youth given that results may vary systematically in important subgroups.
Introduction
P
ercent body fat (PBF) can be accurately assessed by methods such as dual-emission X-ray absorptio-metry (DXA)1,2; however, DXA is not feasible inmany field settings and can be more difficult to conduct in youth than adults because of the protocols that must be followed by participants. As an alternative, investigators have used demographic and anthropometric measures in prediction equations to estimate PBF. The variables in-cluded in prediction equations for youth vary, but it has been shown that skinfolds are feasible to measure in youth3,4and that equations that include skinfolds perform
better than equations without skinfolds.5–9
The majority of equations that predict PBF in youth were developed in small or moderately sized samples (n<400) that lacked wide diversity in age, BMI, and
race/ethnicity. Given that these factors influence patterns of growth, it is important to use a prediction equation that has been shown to be valid in populations similar to the group under study. The National Health and Nutri-tion ExaminaNutri-tion Survey (NHANES) provides a unique opportunity to explore the generalizability of published equations that predict PBF using skinfold measurements. During the 1999–2006 surveys, both anthropometric and DXA measurements were collected in a diverse, na-tionally representative sample of American youth. The aim of this study was to use the NHANES data to com-pare the accuracy and precision of published equations for the prediction of PBF in youth and examine bias by sex, race/ethnicity, BMI status, and age. We restricted our analyses to eight equations that included skinfold measurements. Our goal is to help researchers evaluate the validity and generalizability of available equations
1Department of Nutrition,2Department of Epidemiology,3Department of Biostatistics, School of Public Health, University of North Carolina,
Chapel Hill, NC.
4Department of Family Medicine and Community Health, University of Minnesota, Minneapolis, MN.
ªMary Ann Liebert, Inc. DOI: 10.1089/chi.2015.0020
and aid in selection of an appropriate equation for use in their study sample.
Methods
Equation Selection
Published equations that predict PBF using skinfold measurements in youth were identified by searching PubMed, Google Scholar, and Web of Science for the terms ‘‘Percent Body Fat’’ and ‘‘Prediction Equation.’’ We limited our analysis to: (1) child (6–12 years) or adolescent (13–18 years); (2) equations that predicted PBF; (3) were published between 1985 and 2014; (4) developed for an American population; and (5) contained anthropometric measurements that were available in NHANES. Included studies had to include participants between the ages of 8 and 18, but could also have younger (<8) or older (>18) participants. NHANES only collected triceps and sub-scapaular skinfold measurements; therefore, equations that required skinfolds from other regions were excluded.
Five publications met our inclusion criteria10–14with one
publication10 providing three equations and another
pub-lication11providing two equations for a total of 8 equations
(Table 1). Slaughter and colleagues14 presented a set of equations for nine subgroups that we classified as a single, albeit complex, equation because all nine subgroup equa-tions included both triceps and subscapular skinfolds, with only the coefficient and constants changing by sub-group. DXA was used as the criterion measure for all pub-lished equations examined except the Slaughter equations.
National Health and Nutrition Examination Survey Data
We used data from the 1999–2006 NHANES, which was designed to provide a representative sample of US nonin-stitutionalized youth and adults. Whole-body DXA scans were administered during these survey years in participants 8 years or older using the Hologic QDR-4500A fan-beam densitometer (Hologic, Inc., Bedford, MA), and results were adjusted as previously described.15Eleven body
re-gions were included in the DXA measurements. Partici-pants were excluded from DXA measurement if they were pregnant, weighed over 300 pounds, were over 6 feet 5 inches tall, or if they self-reported a history of radio-graphical contrast material (barium) use in the past 7 days or nuclear medicine studies in the past 3 days. Girls 8–17 years old were not measured during the 1999–2000 survey period because of unresolved institutional review board (IRB) issues; however, DXA data are available for this population for the 2001–2006 surveys. As previously de-scribed,16,17 the National Center for Health Statistics
in-vestigators imputed missing DXA values using sequential multivariate imputation.
Anthropometrics and questionnaires were collected us-ing standardized procedures by trained research staff in mobile examination centers.18Weight was measured to the
nearest 0.1 kg in an examination gown without shoes, and
standing height without shoes was measured to the nearest 0.1 cm using a stadiometer with fixed vertical backboard and adjustable head piece. BMI was calculated as weight in kilograms divided by height in meters squared (kg/m2).
Triceps and subscapular skinfolds were measured using a Holtain skinfold caliper to the nearest 0.1 mm. Weight status was determined according to the CDC BMI percentile cutpoints for youth (underweight, <5th; normal weight, ‡5th–<85th; overweight,‡85th–<95th; obese,‡95th).19
Exclusions
There are 41,474 participants in the NHANES 1999– 2006 data set, of which 11,029 (*27%) are 8–18 years of age with a positive sampling weight. The unresolved IRB issue in 1999–2000 resulted in no DXA data available for 1232 girls. Of the 9797 youth eligible for DXA measure-ment, we excluded youth with missing and no imputed DXA data or implausible DXA data (n=199), implausible or missing height or weight (n=256), missing triceps skinfolds (n=270), or subscapular skinfolds (n=383). The full analytical data set included 8679 participants (5046 boys and 3633 girls) 8–18 year of age. Because more than 10% of the eligible sample was excluded, we recalculated the sampling weights.
Statistical Analysis
We calculated the PBF for each participant using the eight previously published equations. Puberty status in boys was needed to calculate PBF using the Slaughter equation,14 but was not collected in the NHANES 1999–
2006 data sets. Therefore, we used published results on Tanner Stage from NHANES III20 to estimate mutually
exclusively age ranges for prepubertal (8–10 years of age), pubertal (11–14 years of age), and postpubertal (15–18 years of age) and used these age ranges to calculate the Slaughter equation-predicted PBF. The Dezenberg11 and
the Goran12 equations calculated fat mass (FM), and we
converted it to PBF by dividing by body weight (kg). Each equation was tested in a NHANES sample that was matched to age, sex, and race/ethnicity of the origi-nal equation study population. We will refer to this as the development population. The purpose of the matched analysis was to test the equation in a nationally represen-tative sample that was similar to the development popu-lation. We also tested equations in the full NHANES sample of 8- to 18-year-old youth and four stratified samples (by sex, race/ethnicity, weight status, and age).
Univariate regression models were performed for each published equation (PROC SURVERYREG) using the predicted PBF from equation- (explanatory variable) and DXA-measured PBF (dependent variable). We compared the adjustedR2and root mean square error (RMSE) from
-DXA) for each participant. The mean signed difference ( MSD) was calculated (PROC SURVEYMEANS) for each equation. Negative MSD indicated that the equa-tion, on average, underestimated the actual (DXA) PBF, whereas positive MSD, on average, an overestimation by the equation. We set a priori criteria that a strong pre-diction equation should have a high adjustedR2(‡0.80),
high accuracy ( MSD within 1 percentage point), and nondifferential bias within subgroups (within 2 percent-age points).21 Because the full NHANES population is
not used in these subgroup analyses, domain analysis was applied to obtain estimates in subgroups. We followed the standard protocol for using NHANES DXA data17by
repeating all analyses in the five different imputation data sets using 8-year sampling weights and the mean results (R2, RMSE, and MSD) from the five data sets
calculated (version 9.3; SAS Institute Inc., Cary, NC). All of the analyses were repeated in a data set excluding imputed DXA values, and similar results were found (data not shown).
Table 1. Selected Equations to Predict Percent Body Fat Using Triceps and/or Subscapular Skinfold Measurements and Demographics
of the Population with Which Equations Were Originally Developed
First author, year
Study populationa
Published prediction equationsb N
Age range
(years) Sex Race/ethnicity
Bray, 20018 129 10–12 Boys and girls White and
African American
=13.26+(1.17 * subscapular)
=6.77+(1.26 * triceps)
=8.15+(0.73 * subscapular)+(0.38 * triceps) Dezenberg,
19999,c
202 4–10 Boys and girls White and African American
=(0.342 * weight)+(0.256 * triceps)+(0.837 * sex)-7.388 Where male=1, female=2
=(0.332 * weight)+(0.263 * triceps)+(0.760 * sex)+(0.704 * ethnicity)-8.004
Where male=1, female=2; 1=white, 2=African American Goran, 199610,c 98 4–9 Boys and girls White =(0.23 * subscapular)+(0.18 * weight)+(0.13 * triceps)-3.0
Loftin, 200711 166 10–15 Girls White, African
American, Hispanic, and multiethnic
= -23.39+(2.27 * BMI)+(1.94 * triceps)-(2.95 * race)
-(0.52 * age)-(0.06 * (BMI * triceps)) Where black=1, other=0
Slaughter, 198812,d
310 8–18 Boys and girls White and African American
If boy and skinfold sum£35 mm, then:
=1.21 * (triceps+subscapular)-0.008 * (triceps+
subscapular)2-C, where C=1.7 if prepubescent white boy;
3.2 if prepubescent black boy; 3.4 if pubescent white boy; 5.2 if pubescent black boy; 5.5 if postpubescent white boy; 6.8 if postpubescent black boy
If girl and skinfold sum£35 mm, then:
=1.33 * (triceps+subscapular)-0.013 * (triceps+
subscapular)2-2.4
If boy and skinfold sum>35 mm, then:
=0.783 * (triceps+subscapular)+1.6 If girl and skinfold sum>35 mm, then:
=0.546 * (triceps+subscapular)+9.7
aSample size, age range, sex, and race/ethnicity of the population with which equation was originally developed.
bIn the prediction equations, weight is in kilograms, triceps and subscapular skinfolds are in millimeters, BMI is in kg/m2, and age is in years. cThe Dezenberg and Goran equations calculate fat mass. Percent body fat was calculated from FM before comparing the DXA results. dSlaughter equation is considered one equation in the analysis. Appropriate subgroup equations were applied when calculating percent
body fat.
Results
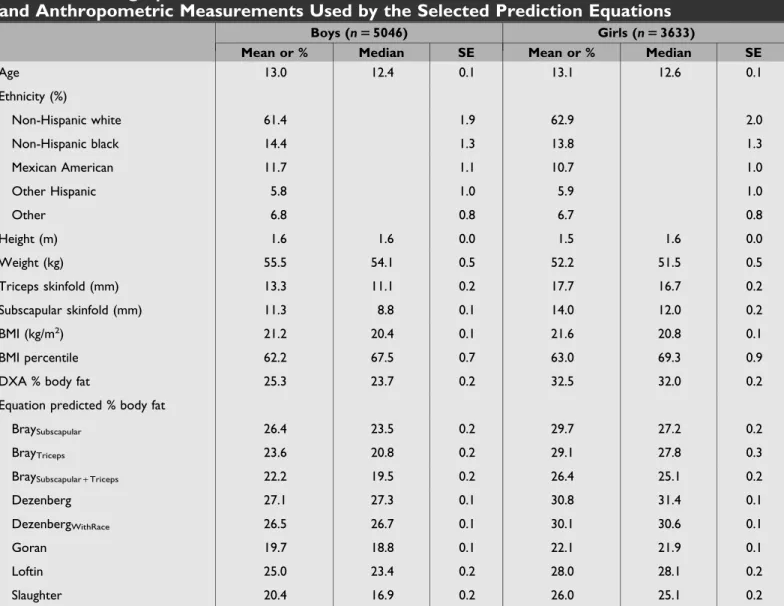
Table 2 presents characteristics of our sample. The mean DXA measured PBF was different between boys (25.3%) and girls (32.5%). The PBF predicted from equations using skinfold measurements varied from 19.7% to 27.1% in boys and 22.1% to 31.4% in girls.
For each equation, Table 3 presents the published R2
compared to our calculated adjusted R2and RMSE in the
NHANES matched sample, full sample, and stratified by sex. In the NHANES matched sample, the adjusted R2
in the matched sample ranged from 0.680 to 0.808. As expected, the adjustedR2 values were lower when
exam-ining the full sample compared to the matched sample. Though none of the equations in the full sample had an adjustedR2‡0.80, there were three equations that had an
adjustedR2‡0.7 (Slaughter [0.738], Bray triceps [0.724],
and Bray subscapular and triceps [0.712]). Two of these
equations also had the highestR2(‡0.7) in boys (Slaughter
adjustedR2=0.727, RMSE=0.391; Bray triceps adjusted
R2=0.717, RMSE=4.02). In girls, four equations had
adjusted R2 ‡0.7 (Loftin: adjusted R2=0.755, RMSE=
3.90; Slaughter: adjusted R2=0.739, RMSE=3.54: Bray subscapular and triceps: adjustedR2=0.732, RMSE=3.62;
Bray triceps: adjustedR2=0.701, RMSE=3.75).
Figure 1 shows the MSD in the NHANES matched and full sample for the eight prediction equations. On average, the prediction equations underestimated PBF with the ex-ception of the Dezenberg equation without race in the full sample. In general, the matched sample underestimated PBF to a greater extent than the full sample. However, the Slaughter equation had similar MSD in both the matched and full samples. In the full sample, the MSD was–1.0 percentage point for both Dezenberg equations (MSD= 0.22 without race and MSD= -0.40 with race) and the Bray subscapular equation (MSD= -0.63). The other five
Table 2. Demographic Characteristics of Youth 8–18 Years in NHANES 1999–2006 and Anthropometric Measurements Used by the Selected Prediction Equations
Boys (n55046) Girls (n53633)
Mean or % Median SE Mean or % Median SE
Age 13.0 12.4 0.1 13.1 12.6 0.1 Ethnicity (%)
Non-Hispanic white 61.4 1.9 62.9 2.0 Non-Hispanic black 14.4 1.3 13.8 1.3 Mexican American 11.7 1.1 10.7 1.0 Other Hispanic 5.8 1.0 5.9 1.0
Other 6.8 0.8 6.7 0.8
Height (m) 1.6 1.6 0.0 1.5 1.6 0.0 Weight (kg) 55.5 54.1 0.5 52.2 51.5 0.5 Triceps skinfold (mm) 13.3 11.1 0.2 17.7 16.7 0.2 Subscapular skinfold (mm) 11.3 8.8 0.1 14.0 12.0 0.2 BMI (kg/m2) 21.2 20.4 0.1 21.6 20.8 0.1
BMI percentile 62.2 67.5 0.7 63.0 69.3 0.9 DXA % body fat 25.3 23.7 0.2 32.5 32.0 0.2 Equation predicted % body fat
BraySubscapular 26.4 23.5 0.2 29.7 27.2 0.2
BrayTriceps 23.6 20.8 0.2 29.1 27.8 0.3
BraySubscapular+Triceps 22.2 19.5 0.2 26.4 25.1 0.2
Dezenberg 27.1 27.3 0.1 30.8 31.4 0.1 DezenbergWithRace 26.5 26.7 0.1 30.1 30.6 0.1
Table 3. Comparison of Adjusted R2 and RMSE From Regression Comparing the Predicted
Percent Body Fat from Each Equation and DXA-Measured Percent Body Fat
Bray, 2001 Dezenberg, 1999
Goran, 1996
Loftin, 2007
Slaughter, 1988 Subscapular Triceps
Subscapular1
triceps No race
With race
Publisheda 0.77 0.81 0.45 0.95 0.95 0.88 0.88 0.78
AdjustedR2
Matched sampleb 0.680 0.793 0.808 0.736 0.704 0.747 0.777 0.742
Full samplec 0.530 0.724 0.712 0.495 0.491 0.674 0.633 0.738
By sexd
Boys 0.487 0.717 0.693 0.471 0.343 0.643 0.618 0.727 Girls 0.620 0.701 0.732 0.612 0.587 0.673 0.755 0.739 RMSE
Matched sample 4.463 3.589 3.453 3.775 3.995 3.375 3.252 4.110 Full sample 5.567 4.269 4.358 5.770 5.789 4.639 4.922 4.156 By sex
Boys 5.258 4.020 4.121 5.235 6.273 4.459 4.758 3.913 Girls 4.404 3.746 3.625 4.563 4.292 3.988 3.904 3.542
aR2extracted from the published equation article.
bNHANES population matched on race/ethnicity, sex, and age to the original development population for each equation. Sample sizes varied
for each equation. Bray,n=1242; Dezenberg,n=1050; Goran,n=303; Loftin,n=2011; Slaughter,n=5100.
cFull NHANES data set for youth of all race/ethnicities, and sexes who are between 8 and 18 years old (n=8679). dBoys,n=5046; girls,n=3633.
RMSE, root mean square error; DXA, dual-emission X-ray absorptiometry; NHANES, National Health and Nutrition Examination Survey.
equations had less accuracy in the full samples with the MSD ranging from-2.11 (Loftin equation) to-7.69 (Goran equation).
Figure 2A–D shows the MSD for the eight equations stratified by sex (Fig. 2A), race/ethnicity (Fig. 2B), weight status (Fig. 2C), and age categories (Fig. 2D). None of the equations had high accuracy (MSD within 1 percentage point) for all subgroups. After stratifying by sex (Fig. 2A), the Loftin equation in boys had small MSD (-0.30); however, the equation, on average, underestimated PBF by -4.49 percentage points in girls. The Dezenberg equation with and without race performed better than the other equations after stratifying by sex; however, PBF was, on average, overestimated in boys (1.72 without race and 1.13 with race), but, on average, underestimated in girls (-1.73 without race and-2.42 with race). The Bray subscapular equation also had differential bias by sex. The Slaughter equation (MSD= -4.96 in boys and-6.48 in girls) and the Bray triceps equations (MSD= -1.77 in boys and-3.40 in girls) were the only equations of the eight equations ex-amined that did not exhibit differential bias by sex.
The Dezenberg equation with race performed well (as measured by MSD) in non-Hispanic whites (MSD= -0.47) but, on average, overestimated PBF in non-Hispanic blacks (MSD=2.20) and underestimated PBF in Mexican Ameri-cans (MSD= -2.53; Fig. 2B). A similar pattern was ob-served in the Dezenberg equation without race. The Bray subscapular equation also had moderate accuracy and was not biased between non-Hispanic whites (MSD= -1.07) and Mexican Americans (MSD= -1.29). However, we did find differential bias with the Bray subscapular equation when comparing non-Hispanic whites or Mexican Americans to non-Hispanic blacks (MSD=1.71). In con-trast, the Loftin equation, on average, underestimated PBF more than the Bray subscapular or Dezenberg equations, but the bias was not differential by race/ethnic groups (MSD, -1.80 to-2.95). The Slaughter equation also was not biased across the race/ethnicity subgroups, but had an even lower overall accuracy (MSD,-4.70 to-6.14).
Whereas two equations had good accuracy in specific weight status subgroups (e.g., Bray triceps in obese youth MSD= -0.02 and Loftin equation in overweight youth MSD=0.05), all of the equations except Bray subscapular plus triceps had differential bias for at least one weight status group comparison (Fig. 2C). Similar differential bias patterns were observed when examining equations across
age categories (Fig. 2D). All equations except Bray sub-scapular did not have differential bias between 13- to 15-year-olds and 16- to 18-15-year-olds.
Discussion and Conclusions
Our evaluation of eight equations to predict PBF using skinfold measurements found none to have an adjustedR2
‡0.80 in a nationally representative sample of youth 8–18 years old. The published R2 ranged from 0.45 from the
Bray subscapular and triceps equation to 0.95 in the De-zenberg equations (Table 3). All equations except Bray subscapular plus triceps had lower adjusted R2 values in
the matched NHANES sample than the published value. Three equations (Bray subscapular equation and both Dezenberg equations) had low bias overall (MSD< –1.0). However, it was concerning that we found some differential bias by sex, race/ethnicity, weight status, and age categories in those equations. It is important to use several metrics (if possible) when determining which prediction equation to use. An equation that might perform very well overall could have differential bias across an important subgroup.
Body fat distribution can vary by sex, race/ethnicity, and age. In general, girls have a higher PBF than boys at the same BMI. Trunk versus limb fat distribution between African Americans and whites differs as early as 3 years of age.22 African Americans with the same subscapular
skinfold as white youth have smaller triceps skinfold. Published prediction equations have low accuracy for es-timating PBF in different ethnic groups.13,22–26 The
rela-tionship between BMI, PBF, and age is even more complex in youth than in adults. In youth 6 months to 8 years of age, both BMI and PBF change in nonlinear patterns over time. During puberty, PBF increases in girls and declines in boys. However, these relative changes are not detected by BMI.27
The variables included in the eight prediction equations we examined varied (Table 1). Only three equations (both Dezenberg equations11and Slaughter equation14) included
sex and only three equations (Dezenberg race equation,11
Loftin equation,13and Slaughter equation24) included race.
We only found bias by sex in the Dezenberg equations. We found differential bias between whites and African Americans in the Dezenberg equation that include race, but not in the equation that did not include race. The Dezen-berg equation was developed in 10- to 12-year-olds and
Figure 2. (A) Mean signed difference (MSD) by sex in 8- to 18-year-old youth from NHANES 1999–2006. A negative MSD indicates that, on average, the skinfold equation underestimated percent body fat measured by DXA, and a positive MSD indicates that, on average, the equation overestimated percent body fat. (B) MSD by race/ethnicity in 8- to 18-year-old youth from NHANES 1999–2006. A negative MSD indicates that, on average, the skinfold equation underestimated percent body fat measured by DXA, and a positive MSD indicates that, on average, the equation overestimated percent body fat. (C) MSD by weight status in 8- to 18-year old youth from NHANES 1999–2006. A negative MSD indicates that, on average, the skinfold equation underestimated percent body fat measured by DXA, and a positive MSD indicates that, on average, the equation overestimated percent body fat. (D) MSD by age categories in 8- to 18-year-old youth from NHANES 1999–2006. A negative MSD indicates that, on average, the skinfold equation underestimated percent body fat measured by DXA, and a positive MSD indicates that, on average, the equation overestimated percent body fat. DXA, dual-emission X-ray absorptiometry; NHANES, National Health and Nutrition Examination Survey.
evaluating the equation in 8- to 18-year-olds might be one of the reasons for the differential bias. The differential bias found in the other equations that did not include sex or race/ethnicity suggest that it may be important for PBF equations to include sex and race/ethnicity and per-haps interaction with those variables if used in a diverse population.
The Dezenberg11and Goran12equations were created in
youth from 4 years of age to 9 (Goran) or 10 (Dezenberg) years of age; however, because DXA measurements were not collected in NHANES on youth younger than 8 years of age, we were unable to validate those equations in the full age range. In addition, these equations calculated FM and were converted to PBF. The conversion from FM to PBF and/or inability to include youth 4–7 years of age might explain why the Goran equation performed poorly in the NHANES sample of 8- to 18-year-olds. The Dezenberg equation was also created in younger youth, and, despite the age restriction in our analysis, it performed relatively well. Although developed in females only, the Loftin equation13was more accurate in boys (MSD= -0.34) than
girls (MSD= -4.59). However, the adjustedR2was higher
in girls than boys (0.759 and 0.611, respectively).
In the present study, we compared PBF prediction equations that included triceps and/or subscapular skin-folds. However, many researchers and clinicians find skinfolds to be challenging to measure accurately, partic-ularly in young youth and obese individuals. With proper training of research staff, it is possible to collect reliable skinfold measurements. A large multinational study con-ducted in six countries found that intraobserver reliability of triceps skinfolds was 99.42%, and the technical error of measurement (TEM) was 0.24 mm.4Waist circumference
had similar intraobserver reliability of 99.02% and TEM of 0.60 cm.4Several studies have shown that including
skin-fold measurements in equations to predict PBF improves the predictability of the equations.5,7–9,28,29
PBF is an important variable that can produce different results than BMI. Unfortunately, gold-standard measures (e.g., DXA) are not feasible in most studies, so researchers need reliable equations to use. Investigators for the Path-ways Trial30found that PBF calculated using an equation
containing skinfolds produced different results compared to BMI. In post-hoc longitudinal analyses of Pathways data, Stevens and colleagues found that normal weight youth with higher levels of physical activity (measured by accelerometry) had lower levels of PBF, but there was no association with BMI.8 Similarly, in the Trial of Activity
for Adolescent Girls (TAAG) study,3,9 Stevens and col-leagues found that between grades 6 and 8, a 10-minute increase in moderate-to-vigorous physical activity was associated with a 0.28-percentage-point decrease in pre-dicted PBF in the adolescent girls (p<0.05), but there was no statistically significant association with BMI. Puder and colleagues31 examined the impact of a school-based
intervention in predominantly migrant preschool youth living in Switzerland. They found no difference in BMI
between the control and intervention groups (-0.07 kg/m2;
-0.19–0.06; p=0.31), but the intervention group had a lower PBF (-1.1%;-2.0 to-0.2;p=0.02). Thus, important associations missed by BMI may detected by PBF pre-diction equations that use measurements that can be col-lected in the field.
To our knowledge, this is the first study to com-pare skinfold equations developed for youth to a nationally representative sample. Our research group previously used the 1999–2004 NHANES data to examine 26 equations to predict PBF in adults.21 Similar to our findings in youth,
the adjustedR2was<0.80 for all equations examined. The
adjustedR2 ranged from 0.59 to 0.68 in males and from
0.51 to 0.61 in females in the four equations for adults that included triceps and/or subscapular skinfold mea-surements. The equations underestimated PBF by 1.1–5.2 percentage points in males and 3.3–5.3 percentage points in females21and also showed differential bias across age,
weight status, and race/ethnicity.
Our research group used 1999–2004 NHANES data to create a new sex-specific PBF prediction equations in youth 8–18 years of age.28In the independent, but internal,
validation data sample, the adjusted R2was 0.818 in girls
and 0.893 in boys. The calculated PBF assessments had high accuracy (MSD= -0.078 in girls and boys) and were not biased across race/ethnicity or weight status groups. Compared to the eight published equations we examined, these equations included more variables (e.g., waist cir-cumference), quadratic terms for anthropometric, and in-teractions between demographic and anthropometric variables. It is not surprising that these equations would have superior performance in the 1999–2004 NHANES data given that they were developed in those data. For a more independent evaluation, we applied those equations28 to the 2005–2006 NHANES data using 2-year sampling weights and found the overall adjusted R2 was 0.787 in
girls and 0.870 in boys and the accuracy remained high for both girls (MSD= -0.030) and boys (MSD= -0.292; un-published data).
percentage points in white boys and–3.6 percentage points in black boys.
A strength of our analysis is that we examined bias in informative subgroups in addition to adjusted R2 and
RMSE. Low random error in a prediction equation is, of course, desirable, as is lack of systematically low or high values across the entire study sample. However, it can be argued that even more important to the validity of a study is that there is not differential bias across subgroups being compared. Our subgroup analyses of MSD allowed us to detect that type of bias. Our work highlights the need for more research in the development of valid equations to predict PBF in youth of all ages, as well as racial and ethnic backgrounds. We suggest that researchers use cau-tion when selecting equacau-tions to predict PBF given that the ability of the published equations to predict PBF might be biased in your sample population.
Author Disclosure Statement
No competing financial interests exist.
References
1. Lohman T, Chen Z. Dual-energy X-ray absorptiometry. In:
Heymsfield S, Lohman T, Wang ZM, et al. (eds), Human Body
Composition, 2nd ed. Human Kinetics: Champaign, IL, 2005. 2. Thomas SR, Kalkwarf HJ, Buckley DD, et al. Effective dose of
dual-energy X-ray absorptiometry scans in children as a function
of age.J Clin Densitom2005;8:415–422.
3. Stevens J, Taber DR, Murray DM, et al. Advances and
contro-versies in the design of obesity prevention trials.Obesity (Silver
Spring)2007;15:2163–2170.
4. Stomfai S, Ahrens W, Bammann K, et al. Intra- and inter-observer
reliability in anthropometric measurements in children.Int J Obes
(Lond)2011;35(Suppl 1):S45–S51.
5. Stevens J, Murray DM, Baggett CD, et al. Objectively assessed associations between physical activity and body composition in
middle-school girls: The Trial of Activity for Adolescent Girls.Am
J Epidemiol2007;166:1298–1305.
6. Freedman DS, Wang J, Ogden CL, et al. The prediction of body fatness by BMI and skinfold thicknesses among children and
ad-olescents.Ann Hum Biol2007;34:183–194.
7. Caballero B, Clay T, Davis SM, et al. Pathways: A school-based, randomized controlled trial for the prevention of obesity in
American Indian schoolchildren.Am J Clin Nutr2003;78:1030–
1038.
8. Stevens J, Suchindran C, Ring K, et al. Physical activity as a
predictor of body composition in American Indian children.Obes
Res2004;12:1974–1980.
9. Webber LS, Catellier DJ, Lytle LA, et al. Promoting physical activity in middle school girls: Trial of Activity for Adolescent
Girls.Am J Prev Med2008;34:173–184.
10. Bray GA, DeLany JP, Harsha DW, et al. Evaluation of body fat in fatter and leaner 10-y-old African American and white children:
The Baton Rouge Children’s Study.Am J Clin Nutr2001;73:687–702.
11. Dezenberg CV, Nagy TR, Gower BA, et al. Predicting body
composition from anthropometry in pre-adolescent children.Int J
Obes Relat Metab Disord1999;23:253–259.
12. Goran MI, Driscoll P, Johnson R, et al. Cross-calibration of body-composition techniques against dual-energy X-ray absorptiometry
in young children.Am J Clin Nutr1996;63:299–305.
13. Loftin M, Nichols J, Going S, et al. Comparison of the validity of anthropometric and bioelectric impedance equations to assess
body composition in adolescent girls.Int J Body Compos Res2007;
5:1–8.
14. Slaughter MH, Lohman TG, Boileau RA, et al. Skinfold equations
for estimation of body fatness in children and youth. Hum Biol
1988;60:709–723.
15. Schoeller DA, Tylavsky FA, Baer DJ, et al. QDR 4500A dual-energy X-ray absorptiometer underestimates fat mass in
compari-son with criterion methods in adults. Am J Clin Nutr 2005;81:
1018–1025.
16. Schenker N, Borrud LG, Burt VL, et al. Multiple imputation of missing dual-energy X-ray absorptiometry data in the National
Health and Nutrition Examination Survey.Stat Med2011;30:260–276.
17. CDC. National Health and Nutrition Examination Survey: Tech-nical Documentation for the 1999–2004 Dual Energy X-Ray Ab-sorptiometry (DXA) Multiple Imputation Data files. CDC: Atlanta, GA, 2008.
18. CDC. National Center for Health Statistics (NCHS). National Health and Nutrition Examination Survey Examination Protocol. US Department of Health and Human Services, CDC: Hyattsville, MD, 2011. Available at www.cdc.gov/nchs/nhanes.htm Last ac-cessed June 30, 2015.
19. Barlow SE. Expert committee recommendations regarding the pre-vention, assessment, and treatment of child and adolescent
over-weight and obesity: Summary report.Pediatrics2007;120(Suppl 4):
S164–S192.
20. Karpati AM, Rubin CH, Kieszak SM, et al. Stature and pubertal stage assessment in American boys: The 1988–1994 Third
Na-tional Health and Nutrition Examination Survey.J Adolesc Health
2002;30:205–212.
21. Cui Z, Truesdale KP, Cai J, et al. Evaluation of anthropometric
equations to assess body fat in adults: NHANES 1999–2004.Med
Sci Sports Exerc2014;46:1147–1158.
22. Wagner DR, Heyward VH. Measures of body composition in
blacks and whites: A comparative review.Am J Clin Nutr2000;
71:1392–1402.
23. Lohman TG, Caballero B, Himes JH, et al. Body composition
assessment in American Indian children. Am J Clin Nutr1999;
69(4 Suppl):764S–766S.
24. Cameron N, Griffiths PL, Wright MM, et al. Regression equations to estimate percentage body fat in African prepubertal children
aged 9 y.Am J Clin Nutr2004;80:70–75.
25. Dugas LR, Cao G, Luke AH, et al. Adiposity is not equal in a multi-race/ethnic adolescent population: NHANES 1999–2004.
Obesity (Silver Spring)2011;19:2099–2101.
26. Bray GA, DeLany JP, Volaufova J, et al. Prediction of body fat in 12-y-old African American and white children: Evaluation of
methods.Am J Clin Nutr2002;76:980–990.
27. Guo SS, Chumlea WC, Roche AF, et al. Age- and maturity-related changes in body composition during adolescence into adulthood:
The Fels Longitudinal Study. Int J Obes Relat Metab Disord
1997;21:1167–1175.
28. Stevens J, Cai J, Truesdale KP, et al. Percent body fat prediction
equations for 8- to 17-year-old American children.Pediatr Obes
2014;9:260–271.
29. Freedman SB, Haladyn JK, Floh A, et al. Pediatric myocarditis: Emergency department clinical findings and diagnostic evaluation.
30. Lohman TG, Caballero B, Himes JH, et al. Estimation of body fat from anthropometry and bioelectrical impedance in Native
American children.Int J Obes Relat Metab Disord2000;24:982–
988.
31. Puder JJ, Marques-Vidal P, Schindler C, et al. Effect of multi-dimensional lifestyle intervention on fitness and adiposity in pre-dominantly migrant preschool children (Ballabeina): Cluster
randomised controlled trial.BMJ2011;343:d6195.
Address correspondence to:
Kimberly P. Truesdale, PhD Research Associate Professor Department of Nutrition University of North Carolina CB 7461 Chapel Hill, NC 27599