KEY FACTORS TO ADOPT PAID FAMILY LEAVE POLICIES IN U.S. STATES
Erin M. Abramsohn
A dissertation submitted to the faculty at the University of North Carolina at Chapel Hill in partial fulfillment of the requirements for the degree of Doctor of Public Health in the Department of Health Policy and Management in the Gillings School of Global Public Health.
Chapel Hill 2019
Approved by: Pam Silberman
Asheley Cockrell Skinner Gene Matthews
iii ABSTRACT
Erin M. Abramsohn: Key Factors to Adopt Paid Family Leave Policies in U.S. States (Under the direction of Pam Silberman)
In 2019, The United States remains the only developed nation without a paid family leave policy. The Family and Medical Leave Act (FMLA) passed in 1993, grants eligible employees up to 12 weeks of unpaid leave per year. However, due to eligibility limitations only 60 percent of U.S. workers qualify for FMLA benefits and only about half of those eligible utilize the program. Many also report shortening the length of unpaid leave they take due to financial constraints. As of December, 2018, only four U.S. states offered paid family leave (California, New Jersey, Rhode Island, and New York). Starting in 2020, Washington state and the District of Columbia will both begin offering paid family and medical leave benefits, and beginning in 2021 Massachusetts will also provide paid family leave benefits. Bills have been introduced (but not passed) in 23 additional states.
iv
own, including: 1) having a strong, broad-based, and well-organized coalition, 2) conducting a fiscal analysis to estimate potential costs and economic benefits, 3) having a supportive, or primarily Democratic state political climate, and 4) introducing a number of bills in different sessions, or having a longer history of working on efforts related to paid family leave. Three additional factors were critical to the success in both California and New York, including 5) having an existing administrative structure in place (in this case, a state temporary disability insurance program), 6) having the support of key leadership (e.g., a Governor who supported paid family leave, or was not opposed to it, and/or a strong bill sponsor), and 7) having an open window of opportunity. This work is intended to inform future efforts by advocates,
v
vi
ACKNOWLEDGMENTS
This has been a long process, and I am incredibly grateful to many people who helped make this possible for me. To my committee, Cathleen Walsh, Gene Matthews, Asheley
Cockrell Skinner, and Judy Waxman–thank you for your steady guidance and continued support. This is a practice-based program, and my goal was to create something that would be useful in the real world. Your varied expertise and insights allowed me to develop products that I hope will help move states forward on this topic. I could not have done this without you. To Pam Silberman–thank you for taking a chance on me, for investing your time and energy in me, and for believing in me. You saw the light at the end of the tunnel for me even when I couldn’t see it for myself. Your steady direction and consistent feedback allowed me to refine my own ideas and create something that I’m incredibly proud of.
vii
viii
TABLE OF CONTENTS
LIST OF TABLES ... x
LIST OF FIGURES ... xi
LIST OF ABBREVIATIONS ... xii
CHAPTER 1: INTRODUCTION ... 1
Statement of the Issue ... 1
Goal ... 2
Importance and Rationale ... 3
Legislative History and Background ... 7
Conceptual Models ... 22
CHAPTER 2: REVIEW OF THE LITERATURE ... 25
Methods ... 25
Findings ... 26
Limitations ... 37
CHAPTER 3: APPROACH AND METHODOLOGY ... 41
Study Overview ... 41
Conceptual Framework ... 48
Research Questions ... 49
Data Collection ... 49
Analysis ... 53
Data Management ... 57
IRB and Confidentiality ... 58
CHAPTER 4: RESULTS ... 59
California ... 60
New York ... 95
Colorado ... 122
ix
CHAPTER 5: DISCUSSION ... 156
Messaging and Communications ... 156
Themes (lessons learned) ... 162
Limitations ... 181
CHAPTER 6: PLAN FOR CHANGE ... 182
Audiences ... 184
Products ... 186
Executive Summary ... 187
Analysis: Opportunities to Advance Paid Family Leave Policies... 188
Framework for a Model Paid Family Leave Policy ... 188
Communication Strategies ... 189
Clarifying My Role ... 191
APPENDIX A: DEFINITIONS ... 193
APPENDIX B: FAILED STATE LEGISLATIVE ATTEMPTS (as of December 30, 2018), ... 195
APPENDIX C: STATE POLITICAL COMPOSITION WHEN BILLS WERE INTRODUCED... 209
APPENDIX D: NUMBER OF BILLS INTRODUCED BY STATE (CA, CO, NY, IL) ... 211
APPENDIX E: NEWSPAPER ARTICLE SEARCH RESULTS ... 212
APPENDIX F: KEY INFORMANT INTERVIEW GUIDE ... 213
APPENDIX G: RELEVANT CALIFORNIA BILLS, 1946–2018 ... 219
APPENDIX H: RELEVANT NEW YORK BILLS, 1998–2018 ... 223
APPENDIX I: RELEVANT COLORADO BILLS, 2013–2018 ... 230
APPENDIX J: RELEVANT ILLINOIS BILLS, 2005–2018 ... 233
APPENDIX K: CODE BOOK ... 237
APPENDIX L: SUMMARY TABLE OF RESULTS ... 240
APPENDIX M: ANTI–LOBBYING ACT ... 245
x
LIST OF TABLES
Table 1: States that have Passed Paid Family Leave Legislation….………...………..18
Table 2: Literature Review Search Terms………...……….25
Table 3: Barriers and Facilitators to Adopting Health-related Policies……..…...……..…………39
Table 4: Case Study States–California and Colorado………...44
Table 5: Case Study States–New York and Illinois………..………..46
Table 6: Sample Data Presentation for Qualitative Data……….………..………..50
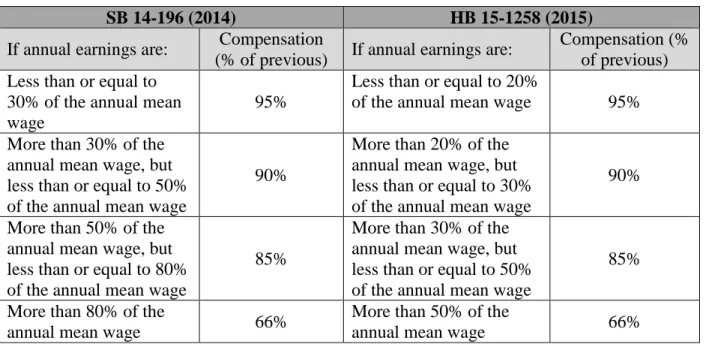
Table 7: (Colorado) Changes in Income Brackets and Percent Compensation……….126
xi
LIST OF FIGURES
xii
LIST OF ABBREVIATIONS
AARP American Association of Retired Persons ACLU American Civil Liberties Union
AFL-CIO American Federation of Labor and Congress of Industrial Organizations
AWW Average Weekly Wage CFRA California Family Rights Act
DOL Department of Labor
EDD Employment Development Department (California)
ERISA Employee Retirement Income Security Act FLI Family Leave Insurance
FLIP Family Leave Insurance Program (Illinois)
FMLA Family and Medical Leave Act of 1993 FTE Full-time Equivalent (staff)
FUTA Federal Unemployment Tax Act
IDC Independent Democratic Conference (New York) ILO International Labour Organization
xiii
NFIB National Federation of Independent Businesses
PFL Paid Family Leave
SAWW State Average Weekly Wage SDI State Disability Insurance
SEIU Service Employees International Union (SEIU) TABOR Taxpayer Bill of Rights (Colorado)
TCI Temporary Caregiver Insurance (Rhode Island)
TDI Temporary Disability Insurance UI Unemployment Insurance
1
CHAPTER 1: INTRODUCTION
Statement of the Issue
Many workers in the U.S. are unable to take time off from their jobs to care for a new child, an ailing family member, or themselves. Without paid leave, workers are forced to choose between physically caring for their families, and their family’s economic security. Paid family leave allows an employee to have time away from work with a portion of their pay to care for a family member, and in some cases, for themselves. This leave may be available to care for a new child (biological, foster, or adopted), or a family member with a serious illness, and is provided in addition to any sick, vacation, personal leave, or short-term disability leave that is available to the employee (Van Giezen, 2013). Paid family leave policies are critical to helping American families balance competing demands, especially as women (who are more likely to serve as caretakers) make up more of the U.S. labor force, and there are fewer nonworking family members in households to care for children and older relatives (Pew Research Center, 2013a).
In 2019, The U.S. remains the only developed nation without a paid family leave policy. The Family and Medical Leave Act (FMLA), passed in 1993, grants up to 12 weeks of unpaid leave to eligible employees every year for one or more of the following reasons: 1) birth,
2
active duty status (United States Department of Labor, 1993). However, FMLA only applies to workers at companies with 50 or more employees who have been at their job for 12 months, and who have provided 1,250 hours of service in the past year (about 24 hours per week). Due to eligibility limitations, only 60 percent of workers qualify for FMLA benefits. Additionally, only about half of those eligible utilize FMLA, and many take less time away from work than they are eligible to take, due to financial constraints (National Partnership for Women and Families, 2013).
As of December 30, 2018, only four U.S. states (California, New Jersey, Rhode Island, and New York) had paid family leave programs in place. Bills had passed in Washington D.C. and Washington State in 2016 and 2017 respectively, with programs slated to begin in 2020, and a bill passed in Massachusetts in 2018 with the program set to begin paying out benefits in 2021. Additionally, some private employers offer generous voluntary paid leave policies, and some use short-term disability insurance as a workaround to provide women with maternity leave. This patchwork of different laws and policies has resulted in a nation where an
individual’s access to time off to care for themselves or their family is determined by the state they live in, the company they work for, or their ability to afford time without pay.
Goal
3 Importance and Rationale
Almost every worker in the U.S. will need to take time off from work at some point in order to care for themselves, a new baby, or a sick family member (National Partnership for Women and Families, 2016). Many aging individuals require care and support to manage
illnesses or daily activities (which is frequently provided by family members), women need time to recuperate after pregnancy and the delivery of a baby, and families need time to bond after birth or adoption. Paid family leave programs benefit families and businesses through cost savings and increases in the financial and physical health of working families.
In a survey conducted by the Pew Research Center, women were more likely than men to report that they had taken career interruptions to care for their family (39 vs. 27 percent) which can have a negative impact on long-term earnings (Pew Research Center, 2013b). Paid family leave policies have been shown to promote economic stability and gender equality at work by increasing parents’ ability to maintain their attachment to the labor force after they have children (Aitken et al., 2015). Access to leave (paid or unpaid) has been shown to increase women’s rate of employment in Europe (Ruhm, 1996), increase the likelihood of women returning to work after having children, and increase the likelihood of women returning to the same job (Hofferth & Curtin, 2006). A 2012 study conducted by the Center for Women and Work at Rutgers
University examined the economic effects of paid family leave compared to the effects of taking unpaid leave or no leave. Controlling for multiple individual‐level job characteristics and
4
compared to women who did not take any leave or took unpaid leave (Houser & Vartanian, 2012).
Providing new parents access to paid time off when a baby is born or adopted has also been shown to result in healthier babies and stronger families (Houser & Vartanian, 2012). Income and economic stability have been directly associated with better health outcomes in adults (Adler & Ostrove, 1999) and the association between family poverty and children’s health outcomes, behavior, and achievement has been well-documented (Brooks-Gunn & Duncan, 1997). A parent’s ability to maintain their family’s economic security can have long-term, positive health impacts for both the parent and their children.
Previously developed economic theories suggested that parental leave policies in general (paid or unpaid) would positively affect infant health outcomes by increasing a parent’s time away from work. However, research specifically found that policies that provided paid time off had the ability to positively impact infant health through access to medical care or household commodities, including immunizations and access to nutritious foods (Leibowitz, 2005; Ruhm, 2000). Paid and job-protected leave across a number of countries, including the U.S., has been associated with significant decreases in infant mortality rates (infant deaths before 1 year of age) compared to other forms of leave (i.e. unpaid leave or leave that is not job-protected), primarily because paid leave allows parents to spend more time with their children (Heymann, Raub, & Earle, 2011; Ruhm, 2000; Staehelin, Bertea, & Stutz, 2007; Tanaka, 2005).
5
health outcomes may be due in part to higher birth weights (Tanaka, 2005). Unpaid maternity leave was not found to have a substantial effect on infant health indicators, including birth weight, the likelihood of premature birth, or infant mortality (Ruhm, 2000; Tanaka, 2005). Additional studies have shown that increases in income alone have the ability to improve child health outcomes (Leibowitz, 2005).
Studies have also shown that the length of leave matters. Returning to work within 12 weeks of childbirth (whether leave was paid or unpaid) has been shown to have significant negative impacts on child health outcomes (Berger, Hill, & Waldfogel, 2005). Specifically, children whose mothers returned to work before 12 weeks postpartum were less likely to have regular medical check-ups and to receive all of their immunizations by 18 months. These children were also less likely to be breastfed and for those that were breastfed, they were more likely to be breastfed for a shorter period of time.
Notably, job-protected leave in general (paid or unpaid) has been associated with increased breastfeeding initiation and duration (Baker & Milligan, 2010; Calnen, 2007; Camurdan et al., 2008; Cooklin, Rowe, & Fisher, 2012; Guendelman et al., 2009; Ogbuanu, Glover, Probst, Liu, & Hussey, 2011; Staehelin et al., 2007). However, multiple studies found that mothers were more likely to initiate and continue breastfeeding if they had access to paid leave, and a strong positive association was found between the length of maternity leave and a mother’s duration of breastfeeding; the longer a mother delayed her return to work post-partum, the more likely she was to have started and continued breastfeeding (Hawkins, Griffiths,
6
The majority of paid family leave programs are financed and administered through private companies, require the use of an employee’s accrued sick and vacation time, or are financed by employee contributions and administered through state disability insurance programs (e.g., CA, NJ, RI, and NY). A 2014 report by the White House Council of Economic Advisors examined the costs and benefits of paid family leave programs from an employer’s perspective. The Council found that family leave, whether paid or unpaid, can have a positive effect on long-term productivity by improving recruitment, retention, and employee motivation (White House Council of Economic Advisors, 2014).
Additionally, employers can benefit from paid family leave policies through
increased employee retention, reduced turnover, and increased employee loyalty and morale (Rudd, 2004).
By increasing worker retention and reducing turnover, businesses can save significant costs associated with replacing employees (United States Department of Labor, 2015b). After California and New Jersey passed paid family leave laws, most businesses in those states reported positive or neutral experiences, and few reported negative impacts. Over 90 percent of employers affected by California’s paid family leave initiative reported either positive or no noticeable impacts on their profitability, employee turnover rates, and employee morale (Appelbaum & Milkman, 2011).
In addition to state-level policies, many companies have established their own paid family leave programs. The National Partnership for Women and Families found that over 100 brand-name companies announced new or expanded paid leave policies that impacted U.S.
“A modest, affordable investment in paid leave makes plain sense when balanced against costs. For employers, the cost of providing a few weeks
of leave to just some of their employees each year should be measured against the alternative
potential cost and burden of replacing experienced talent.”
7
workers between 2015 and 2018. All of these policies acknowledged the importance of paid parental leave for all employees, regardless of gender, and several also provided paid leave to employees to care for other family members and recognized an expanded set of family relationships (National Partnership for Women & Families, 2018a). U.S. workers, especially millennials, are demanding more inclusive workplace policies. Offering paid family leave can help businesses attract the best workers and keep them (Connecticut Campaign for Paid Family Leave, 2016; Wilkie, 2015).
The U.S. currently does not provide any public funding for parental leave, although the Obama Administration made a commitment to supporting cities and states seeking to enact paid leave policies between 2014 and 2016, providing technical expertise, and investing in research and analysis to help state and local policy makers understand what works and design the best possible programs. The Administration awarded $500,000 in 2014, $1.55 million in 2015, and $1.1 million in 2016 to help states, municipalities and federally recognized tribes conduct research, analysis, evaluation, and feasibility studies for paid leave programs (United States Department of Labor, 2015a).
Legislative History and Background
Many other countries provide generous paid leave policies for new parents and caregivers (European Commission, 2018; Moss, 2012; Organization for Economic Cooperation and
8
recently introduced in 2017 by Senator Kirsten Gillibrand (D-NY)–and the Economic Security for New Parents Act introduced in 2018 by Senator Marco Rubio (R-FL). However, it is important to note that my research project and the resulting findings and recommendations are intentionally focused on state-level policy adoption. States and major cities have seen more traction with paid family leave bills compared to bills at the federal level, and although policies in other countries may serve as good models, it is important to determine what provisions policymakers and constituents in U.S. states will support. Continuing to build momentum at the state level in the current political climate may help amass a critical number of state policies and reach a tipping point where a federal policy will be more likely.
Several states already had some form of unpaid parental leave policy in place prior to enactment of the FMLA in 1993, and a number of states have expanded access to unpaid leave either by extending coverage to more workers or by increasing the length of unpaid,
job-protected leave (Grant, Hatcher, & Patel, 2005). State advocates and legislators are also leading the way by introducing and adopting strong state-level paid family leave policies. However, specific aspects of paid family leave programs vary from state to state, including who is eligible, the amount of wage replacement offered, and how the program is funded and administered.
Temporary Disability Insurance
9
enacted social insurance programs to provide up to 6 weeks of partial compensation to eligible employees for the loss of wages caused by a temporary, non-work-related disability (including pregnancy). These programs are called temporary disability insurance (TDI) because the duration of payments is limited (Social Security Office of Retirement and Disability Policy, 2011). State TDI programs are financed through employee contributions or through a combination of
employer and employee contributions to a state fund. In most states, more workers are covered by TDI than are covered by FMLA, but TDI policies (unlike FMLA) typically do not offer job-protection to those taking leave (Fass, 2009).
Four states have now moved beyond this system to pass paid family leave laws. The programs in California, New Jersey, Rhode Island, and New York operate through each state’s TDI program, and currently provide an additional six to ten weeks of paid family leave for bonding with a newborn or newly adopted child, or for taking care of a seriously ill family member (the New York program will increase to 10 weeks in 2019, then 12 weeks in 2021).
Employees in Hawaii are entitled to 26 weeks of temporary disability insurance (TDI) benefits for pregnancy or any other illness or injury that is not work-related. Benefits provide 58 percent of an employee's wages, up to a maximum weekly benefit amount that is set annually by the Disability Compensation Division (the maximum in 2018 was $620.00 per week). TDI benefits cannot be claimed for leave taken to care for a family member, and the employee’s job is not protected while taking leave under TDI. To be eligible, employees must have worked at least 20 hours per week for their employer, over at least 14 weeks, and must have been paid at least $400.00 per week during that time.
10
agents who are paid solely on a commission basis, student nurses and hospital interns, and other workers who are specifically excluded by the law. Eleven bills were introduced in Hawaii
between 2014 and 2018. Almost all of these bills would have allowed eligible workers to take up to 12 weeks of paid, job-protected family and medical leave per year, at up to 67 percent of their regular pay. In all of the bills, the program would have been funded by employee payroll
contributions (State of Hawaii Disability Compensation Division, 2018).
Under the California TDI program, eligible individuals who are unable to work due to a non-work-related illness, injury, or pregnancy can receive partial wage replacement (60 to 70 percent, depending on income) up to a maximum of $1,216.00 per week, for up to 52 weeks. New mothers specifically can receive partial pay for four weeks prior to a child’s birth, and for six to eight weeks after birth. This applies to women only, for all pregnancies and births. Job-protection during leave taken through TDI is extended to workers in companies with five or more employees (State of California Employment Development Department, 2016).
California passed the first paid family leave policy in 2002, and the program went into effect in 2004. California’s Paid Family Leave (PFL) Insurance program offers workers up to six weeks of leave annually with partial pay to care for a seriously ill child, spouse, domestic
partner, or for parents to bond with a newborn, newly adopted, or recently placed foster child. As established, the program did not cover leave for self-care, which is covered under the state TDI program (California State Legislature, 2002).
11
eliminated a one-week waiting period for PFL claims. As of 2018, benefits provided under both programs are 60 to 70 percent, depending on income, up to a maximum of $1,216.00 per week. The California TDI and PFL programs are both funded by employee payroll deductions.
Almost all private sector workers in California are eligible for partial wage replacement through the PFL program, including part-time workers and employees of small businesses (those who work for companies with five or fewer employees). However, PFL in California does not provide job protection (Milkman & Appelbaum, 2004; State of California Employment
Development Department, 2018b). Eligible workers in California may have their jobs protected for 12 weeks under FMLA or the state equivalent, the California Family Rights Act (CFRA).
The provisions of CFRA are similar to FMLA with respect to the birth of a child or the placement of a child for adoption, but pregnancy is not covered as a serious health condition under CFRA–this leave can only be used by an employee following the birth of a child, to care for a parent, spouse, or child with a serious health condition, or for the employee’s own serious health condition. Under FMLA, a disabling condition related to pregnancy is considered a serious medical condition, so if a woman is having a difficult pregnancy and needs time off prior to the birth of her child, that time will count toward her 12-week leave entitlement under FMLA (State of California Department of Fair Employment and Housing, 2017; United States
Department of Labor, 1993).
Additionally, the California Fair Employment and Housing Act (CA-FEHA), is the state law that prohibits discrimination, and provides protection from discrimination based on
12
for foster care or adoption (State of California Department of Fair Employment and Housing, 2018).
Use of California’s PFL program has grown steadily since it was implemented in 2004, with 245,387 claims paid in state fiscal year 2016–17 (July 1–June 30). Each year, the majority of claims have been for bonding (87.3 percent in 2016–17) with the rest (12.7 percent) for providing care. In 2016–17 the average weekly benefit amount paid to a covered employee was $585.00, and individuals that filed claims for paid leave took an average leave of 5.36 weeks (State of California Employment Development Department, 2018d).
Despite growing use of the program over time, about half (51.4 percent) of California workers surveyed in 2009 and 2010 were unaware of it, and respondents who stood to benefit the most from paid family leave were least likely to know about the program. This included younger respondents, non-Whites, those with lower educational attainment, and respondents who did not have employer-provided paid sick days or vacation benefits. Additionally, a third of those who reported knowing about the program said that they did not apply for benefits because the wage replacement was too low. Others did not apply because they did not think they were eligible, or because they feared retaliation by their employer (Appelbaum & Milkman, 2011).
13
injury that was not caused by the employee’s job), which is covered under the state’s TDI program. The FLI program is funded entirely by an employee payroll tax of 0.08 percent.
Workers who already pay into the state’s existing TDI program, have worked for at least 20 weeks in the past year, and who have earned at least $143.00 per week during that time are eligible for wage replacement under the FLI program (State of New Jersey, 2016). Part-time workers and employees of small businesses are covered by the program, but the FLI program does not guarantee job protection, so only workers who are also covered by FMLA will be guaranteed their jobs upon returning from leave.
New Jersey’s FLI program processed 32,171 eligible claims in 2016 and payments totaled $87.9 million. The average weekly benefit amount was $524.00, and the average amount paid for a completed case in 2016 was $2,711.00. The average duration for an FLI leave taken was 5.2 weeks. Over 83 percent of eligible FLI claims were filed to bond with a newborn or newly adopted child, with just over seven percent of total eligible claims filed to care for a family member other than a child or spouse (which includes parents). Women under the age of 45 were the largest single group of FLI claimants, accounting for 77 percent of all FLI eligible claimants (New Jersey Department of Labor and Workforce Development, 2017).
Eligible employees in Rhode Island can take up to 13 weeks in 24 months of
14
contributions and provides a portion of a worker’s salary for up to 30 weeks when they are unable to work due to a temporary illness or injury, including pregnancy. This “Temporary Caregiver Insurance” (TCI) program was folded into the TDI program to compensate workers who take a temporary leave from their job to care for a relative with a serious health condition or to bond with a new baby.
Rhode Island’s TCI program applies to all private sector employees and public
employees who opt into the program (public sector employees do not automatically pay for the insurance). The TCI program is funded through a separate payroll deduction, and allows
employees to take up to eight weeks of leave per year. Notably, the eight weeks of TCI leave are included in the 30 weeks of leave available to employees under the TDI program; an employee who uses eight weeks of paid caregiving leave would only have 22 weeks of TDI coverage available for the rest of the year. Benefits are paid at 4.62 percent of all wages paid to the
employee in the highest quarter of their base period (for three months), ranging from a minimum of $89.00 to a maximum of $831.00 per week for the benefit year that started on July 2, 2017. Additionally, an employee’s job and health benefits are protected while taking TCI leave (Rhode Island Department of Labor and Training, 2014).
15
employer-provided benefits. This study found no evidence of significant impacts on small or medium sized employers (those with 10–99 employees), and found that a majority of the employers interviewed in 2015 supported the new law (Bartel, Rossin-Slater, Ruhm, & Waldfogel, 2016).
New York’s paid family leave program began in 2018 and started by providing eligible workers in the state with up to eight weeks of job-protected leave per year at 50 percent of their average weekly wage, with benefits capped at 50 percent of the statewide average weekly wage. Benefits increased to 10 weeks in 2019, paid at 55 percent of the worker’s average weekly wage (capped at 55 percent of the state average weekly wage, which was $746.41 in 2019), and will increase to 12 weeks paid at 67 percent and capped at 67 percent of the statewide average weekly wage in 2021 (State of New York, 2016). The new law amended New York’s existing TDI law to cover employees who need time off for injury, sickness, or pregnancy, to care for a newborn or newly adopted child, or a seriously ill family member. The program is funded through small employee paycheck deductions of around a dollar per week per employee (State of New York, 2016).
16
who spend more than 50 percent of their work time for that employer working in the District, or whose employment for the employer is based in the District and who regularly spend a
substantial amount of their work time for that employer in the District and not more than 50 percent of their work time for that employer in another jurisdiction (District of Columbia Department of Employment Services, 2018).
Washington’s Paid Family and Medical Leave law was passed in 2017. Premium assessments began on January 1, 2019 and benefits can be taken by workers starting January 1, 2020. Workers in Washington will be able to take up to 12 weeks, as needed, to care for a new child or an ill or ailing family member, for their own serious illness or injury, and for certain events connected to military service. Workers in the state may be eligible to take more than 12 weeks of leave in a given year. For example, an employee may be eligible to take up to 16 weeks of leave if they experience multiple events in a given year, or up to 18 weeks if they experience a serious health condition with a pregnancy that results in incapacitation. Weekly benefits will be calculated based on a percentage of the employee’s wages and the state weekly average wage– which is currently $1,082.00–but will be capped at $1,000.00 per week. Workers who earn less than the state average will receive 90 percent of their income (Washington State Employment Security Department, 2018).
The Massachusetts bill passed in 2018. Premium assessments in the state will begin on July 1, 2019 and workers will be able to claim benefits starting on January 1, 2021. In
17
weekly wage (which would currently amount to a cap of $850.00 per week) (The General Court of the Commonwealth of Massachusetts, 2018). The programs in Washington and Massachusetts will both be funded by a payroll tax that is split between employers and employees, and
administered largely like unemployment insurance. In Washington, the tax will be 0.4 percent of the employee’s pay in 2019, with employers paying 37 percent of the total premium and
employees paying 63 percent (although employers can elect to pay the employee’s entire portion of the premium). In Massachusetts, companies will be charged a 0.63 percent payroll tax, split roughly 50–50 between employees and employers.
Notably, Washington passed the Family Leave Insurance Act in 2007 but never identified a funding mechanism for the benefit, which delayed implementation. The state received
a $247,000 Paid Leave Analysis grant from the Women’s Bureau of the U.S. Department of Labor in 2015 to provide analysis of issues related to study the feasibility and impact of the 2007 Act. The Legislature approved Senate Bill 5975 during the 2017 legislative session and the new law went into effect on October 19, 2017. The regulations necessary for this program to function are currently being established.
Massachusetts also received a Paid Leave Analysis grant from the Women’s Bureau of the U.S. Department of Labor. In 2014, the Massachusetts Department of Labor Standards received a grant for $117,651 to conduct research and inform key stakeholders, the legislature, and the public about the costs and benefits of paid family and medical leave. They were also able to use this funding to develop a micro‐simulation model to estimate eligibility, take‐up, and
Table 1: States that have Passed Paid Family Leave Legislation
California New Jersey Rhode Island New York D.C. Washington1 Mass.
Date Passed 2002 2008 2013 2016 2016 2017 2018
Date
Implemented 2004 2009 2014 2018 2020 2020 2021
Governor Davis
(D, 1999-2003) Corzine (D, 2006-2010) Chafee (R, 2011-2015) A. Cuomo (D, 2011-) Bowser (Mayor) (D, 2015-) Inslee (D, 2012-) Baker (R, 2015-)
State Senate D D D R 13 member
Council (11-D, 2-I)
D D
State House D D D D D D
Length of
Leave 6 weeks 6 weeks 8 weeks (2015)
10 weeks
(2019)2 2-8 weeks 12-18 weeks 12-26 weeks
Percent
of Pay 60-70% 2/3 of AWW
4.62% of
wages 55% (2019) Up to 90% Up to 90%
Based on income3
Weekly
Maximum $1,075 $637 in 2018
$831/week as of 7/2017
55% SAWW (2019)
$1,000 (before
Oct. 1, 2021) $1,000/week
64% of SAWW ($850/ wk. in
2018)
Includes
Self-care? No No No Yes Yes, 2 weeks Yes Yes
Job
Protection: No No Yes Yes No Yes Yes
Paid for by: Employee
contributions Employee contributions Employee contributions Employee contributions Employer contributions Employer & Employee Contributions Employer & Employee Contributions
1 Washington passed the Family Leave Insurance Act in 2007 but never identified a funding mechanism for the benefit, which delayed implementation. The Legislature then approved SB 5975 during the 2017 legislative session and the new law went into effect on October 19, 2017.
2 The New York law provided 8 weeks at 50% pay in 2018, up to a weekly max. of 50% of the statewide average weekly wage (SAWW); 10 weeks at 55% pay in 2019, up to a weekly max. of 55% of the SAWW, and this will increase to 12 weeks at 67% pay in 2021, up to a weekly max. of 67% of the SAWW.
3 Employees in Massachusetts will be able to claim 80% of their previous wages (capped at 50 percent of the SAWW) and then 50 percent of their wages beyond that amount (capped at $850.00 per week).
19
Additional State Attempts to Pass Paid Family Leave Policies
As of December 30, 2018, 23 additional states had proposed bills to provide paid family leave that did not end up passing, including: Arizona, Connecticut, Colorado, Georgia, Hawaii, Illinois, Indiana,4 Louisiana, Maine, Maryland, Minnesota, Mississippi, Missouri, Montana,
Nebraska, New Hampshire, Ohio, Oklahoma, Oregon, Texas, Vermont, Virginia, and
Wisconsin.5 All of these bills would have allowed individuals to take paid time off for the birth of a child or the placement of a child with the employee for adoption or foster care, to care for a family member with a serious health condition, or because of a serious health condition of the employee (Appendix B).
The states that have passed paid family leave legislation were heavily democratic in terms of political composition (including the District of Columbia), but the 23 additional states that have made attempts to pass similar legislation were controlled by both Democrats and Republicans. The states listed above introduced 76 paid family leave bills between 2005 and 2018. Out of 76 bills introduced, 42 were introduced while Republicans had control of at least two out of three bodies (Governor, Senate, and House), while 34 bills were introduced while Democrats had control of at least two out of three bodies. Twenty-six bills were introduced while Republicans controlled all three bodies, while 22 were introduced at a time when Democrats controlled all three (Appendix C).
4 The bill in Indiana would have established a family leave insurance program to provide benefits to employees who elected to participate in the program (would have been voluntary for both employers and employees).
5 Sources include: The National Partnership for Women and Families, Work and Family Policy Database:
http://www.nationalpartnership.org/issues/work–family/work–family–policy–database/, LegiScan:
20
Multiple other bills have been proposed (and some passed), including bills that would provide tax incentives for employers to offer programs to their employees (e.g., bills introduced in Oregon in 2015 and 2017), bills that would require employers to allow an employee to take their own accrued leave for the purpose of family leave (introduced in Michigan and Florida in 2015), or bills that would mandate a fiscal impact or other paid family leave study (e.g., bills that recently passed in New Hampshire and New Mexico). Additionally, bills have been proposed (and a few passed) that would provide paid parental leave only for state employees (ranging from 10 days in Missouri to 12 weeks in Delaware), or provide paid leave for both public and private employees but only following the birth or adoption of a child (e.g., multiple bills introduced in Vermont ranging from five to 15 weeks).
For bills providing paid time off for birth, adoption or foster care, to care for a family member with a serious health condition, or because of a serious health condition of the
21
22 Conceptual Models
Policymaking involves multiple overlapping phases, including: 1) identifying problems, 2) analyzing policy options, 3) formulating policy proposals, 4) enacting (legitimizing) policy, 5) policy implementation, and 6) policy evaluation. The policymaking process is complex, and multiple conceptual models exist that attempt to explain why and how specific policies get adopted.
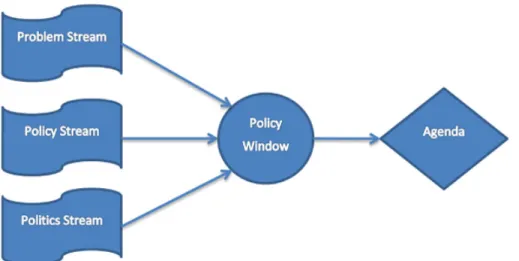
Multiple Streams Theory (John W. Kingdon)
In the late 1970s, John Kingdon researched the policy process of the U.S. federal
government. He looked at how an agenda is set, why some ideas gain traction and others do not, how alternatives are developed and how choices and decisions are made. Kingdon described the policy process as “highly fluid and loosely coupled…” and stated that “…various streams– problems, policies, and politics–seem to flow through and around the federal government largely independent of one another, and big policy changes occur when the streams join” (Kingdon, 1997).
23
cluster of policy actors” (including the president, president’s staff, high-level political appointees, Congress, interest groups and the media) (Kingdon, 1997).
Figure 2: Kingdon’s Multiple Streams Model
Kingdon explained that an issue is most likely to make it onto a policy agenda when all three streams (problem, policy, and politics) converge. This happens when a problem is clearly defined and effectively communicated to policy makers, a feasible and politically acceptable solution has already been developed and is waiting to be implemented, and public perception for both the problem and the solution is positive. When all three streams align, a policy window can result, creating an opportunity for a public policy. Policy windows can open due to both
24
Policy Entrepreneurs (Michael Mintrom, Pamela A. Paul-Shaheen)
Michael Mintrom looked at the role of policy entrepreneurs (actors who seek to initiate dynamic policy change) in promoting policy innovations and energizing the diffusion process (Mintrom, 1997). Policy entrepreneurs use multiple activities to promote ideas, including identifying and communicating the problem in a way that both attracts the attention of decision makers and indicates the need for a policy response, networking within policy circles and
developing strategies for presenting their ideas to others, shaping the terms of policy debates and crafting arguments in support of their policy innovation, and building coalitions (Mintrom, 1997).
25
CHAPTER 2: REVIEW OF THE LITERATURE
Methods
I conducted a systematic literature review to better understand what evidence existed about specific barriers and facilitators to adopting Health-related policies at the state-level. I performed a single search in January 2016 of the English-language literature indexed in PubMed over the last 20 years (from January 1996 to January 2016) using a broad set of search terms to maximize sensitivity (Table 2). The search terms listed in Table 2 were combined for one single, complete search: (barriers OR challenges OR facilitators OR facilitating factors) AND (state OR state-level) AND health AND (policy OR legislation OR bill) AND (adoption OR adopting OR passing OR passage). First, I gathered studies from the peer-reviewed literature indexed in PubMed. Then, I used snowballing to identify additional relevant articles and related citations. I also included a few additional articles that were brought to my attention by separate sources. I developed a review form (an excel spreadsheet) to systematically record specific information from each article.
Table 2: Literature Review Search Terms
26
My initial PubMed search returned 187 articles. Snowballing resulted in the inclusion of 8 more articles, and 5 additional studies were included for review after they were brought to my attention. I reviewed titles and abstracts for relevance and identified 39 articles that I then retrieved in full text and reviewed for inclusion (22 from PubMed, 9 from snowballing, 8 from an outside source). Of the 39 articles that I reviewed fully, I found 24 to be relevant in terms of providing information about specific barriers and facilitating factors to adopting Health-related policies at the state-level (13 from PubMed, 8 from snowballing, and 3 from an outside source).
I included articles that specifically discussed barriers and/or facilitators to passing or adopting legislative or regulatory Health-related policies within U.S. states. I excluded articles if they discussed national-level policy or policies passed in other countries. I also excluded articles if they were too specific to be relevant to other health policy issues (e.g., cost as a barrier to vaccine coverage, or barriers to adopting electronic health records). I did include a few key articles that addressed the adoption of voluntary policies or policy adoption at the local level.
Findings
The articles that I reviewed considered barriers and facilitators to passing or adopting a number of different legislative or regulatory Health-related policies. Five studies were
27
and facilitators to state-level implementation of primary stroke center (PSC) policies (O'Toole, Slade, Brewer, & Gase, 2011), and one that explored legislative efforts to attain direct access to a physical therapist without a physician referral or prescription (Shoemaker, 2012).
Seven studies explored barriers and facilitators to adopting tobacco control policies at the state or local level (Ahrens, Jones, Pfister, & Remington, 2011; Flynn et al., 1998; Francis, Abramsohn, & Park, 2010; Goldstein et al., 2003; Satterlund, Cassady, Treiber, & Lemp, 2011; Satterlund, Treiber, & Cassady, 2013; Satterlund, Treiber, Haun, & Cassady, 2014). Seven additional studies looked at factors that enabled, impeded, or predicted enactment of state legislative action to address obesity, including six articles that specifically addressed legislation aimed at preventing childhood obesity (Boehmer, Luke, Haire-Joshu, Bates, & Brownson, 2008; Cawley & Liu, 2008; Dinour, 2015; Dodson et al., 2009; Eyler, Nguyen, Kong, Yan, &
Brownson, 2012), and one article that looked at enactment of adult obesity prevention legislation (Donaldson et al., 2015). One additional study looked at policy changes to support breastfeeding, examining barriers and factors that facilitated the adoption and implementation of breastfeeding policy changes (Johnson, Lamson, Schwartz, Goldhammer, & Ellings, 2015)
Four articles looked at barriers and facilitators related to legislative health reform efforts, including three that specifically discussed the development and enactment of single-payer health care reform legislation in Vermont (Blanchet & Fox, 2013; Fox & Blanchet, 2015; Hsiao,
28
studies that were specific to the barriers or facilitating factors to adopting paid family leave policies.
Many of the barriers and facilitating factors outlined in these articles fit within one of Kingdon’s three streams, (problem, policy, or politics) or supported the concept of an open policy window. Additional barriers and facilitating factors supported Mintrom’s theory of policy entrepreneurs and the importance of dynamic political actors. Some of the factors identified from the literature did not fit neatly into one of these categories. These factors were primarily related to the socioeconomic and demographic (non-political) environment within the state that made it more or less likely to enact Health-related legislation. This is discussed in more detail below.
Environmental Context
Multiple state-level socioeconomic and demographic characteristics were associated with passing Health-related policies, including a higher percentage of college-educated adults, higher per capita income, a higher percentage of African Americans, more households that did not use English as their primary language at home, and anticipated issues related to population growth (Boehmer et al., 2008; Cawley & Liu, 2008; Schmeida & McNeal, 2013).
29
populations. Additionally, state legislative action to address childhood obesity was more likely in states that reported a greater gap between adults’ actual and desired weight. Controlling for state-level adult obesity prevalence rates, greater deviation from desired weight may reflect greater dissatisfaction with being overweight among adults in the state, which may lead to more public support for policies to prevent childhood obesity (Cawley & Liu, 2008).
Schmeida and McNeal looked at 18 U.S. states that passed language laws promoting equitable mental health services for children with limited English proficiency, and 32 states that had not (Schmeida & McNeal, 2013). In this study, growth management innovation, an index based on the presence of programs to address the state’s ability to manage both growth and population decline, was used as an indicator of state agency resources and a measure of a state’s ability to anticipate and respond population growth and decline. Growth management innovation was positively associated with the adoption of children’s mental health language access laws, suggesting that states that anticipated problems related to population growth or decline were more likely to adopt children’s mental health language laws. Additionally, states with a higher number of residents that did not speak English as their primary language (ages 5 and over) were more likely to adopt and implement these laws.
Problem Stream
30
For example, despite a window of opportunity to pass comprehensive health care reform in Vermont in the early 1990s, the attempt failed for a number of reasons. Multiple stakeholders that were interviewed discussed a misleading story in the media concerning a potential tax increase and a grassroots opposition campaign that developed in response to the perceived tax increase, which significantly weakened public support (Fox & Blanchet, 2015).
In a study looking at barriers and facilitating factors related to the adoption and implementation of breastfeeding policies in community health clinics, misperceptions about breastfeeding and available support were major barriers, including the perception that
breastfeeding did not need to be a focus of clinical care because it was being taken care of by staff from The Women, Infants, and Children (WIC) program (Johnson et al., 2015). An additional study investigated the primary success factors and barriers to adopting a Medicaid waiver that would allow state Medicaid agencies to create specific programs to serve individuals with Autism Spectrum Disorder (ASD). States that chose not to adopt an ASD-specific waiver perceived that children and youth with ASD were served sufficiently well through other
Medicaid benefits, and that intervention and monitoring would be more difficult than what they were currently doing (Merryman et al., 2015).
Being able to demonstrate clear evidence of the consequences of the problem and the ability to personalize health concerns were common factors that facilitated bill passage (Cawley & Liu, 2008; Goldstein et al., 2003; Satterlund et al., 2011). Additionally, national media
exposure around childhood obesity helped contribute to a growing awareness regarding the need to address the problem, and aided the passage of state-level childhood obesity prevention
31
perceived significance of the problem and impeded bill passage (e.g., that there were other, more “pressing” issues, and that the need to address the problem did not outweigh perceived individual rights) (Satterlund et al., 2013; Satterlund et al., 2014).
Policy Stream
The policy stream includes feasible and acceptable policy solutions to the problem(s). Two specific barriers were identified that were related to the policy itself, or to potential policy alternatives. High costs associated with a bill (or a lack of financial resources to address the problem) and administrative concerns about additional reporting and monitoring that would be required were reported as significant barriers to passing strong, Health-related policies (Dinour, 2015; Johnson et al., 2015; Merryman et al., 2015; O'Toole et al., 2011; Sams et al., 2013).
Insufficient funding was the primary barrier to adopting a Medicaid waiver that would allow state Medicaid agencies to create specific programs to serve individuals with ASD (Merryman et al., 2015). Likewise, cost was a major barrier to adopting bills to limit the
32
for organizational changes to accommodate actions like monitoring breastfeeding rates and allowing providers training time in response to new policies (Johnson et al., 2015).
Bill content was also critical, with bills related to more politically feasible and acceptable policy solutions (which varied by state) more likely to be adopted. For example, bills related to “safe routes to school” (programs that aim to make it safer for students to walk and bike to school), access to healthy food, physical activity, or educational programs, health and nutrition content, and those related to modifying rules and procedures (e.g., preemption) were more likely to be enacted than bills related to product or menu labeling, or food or beverage taxes (Boehmer et al., 2008; Donaldson et al., 2015; Eyler et al., 2012). Bills related to areas considered to be controversial by policymakers and their constituents, or by the business community or large industries (e.g., menu labeling) were less likely to be considered or adopted. Additionally, bills that were viewed as having the potential to create an unfavorable environment for business by imposing regulations or fees were less likely to pass (Satterlund et al., 2014).
Politics Stream
33
Liu, 2008; Eyler et al., 2012; Fox & Blanchet, 2015; Paul-Shaheen, 1998). Legislative power and influence have long been associated with legislative success, as measured by bills being passed into law. Legislators who held a formal office in the legislature (e.g., in the party leadership, as a committee chair, or as a ranking member), those within the majority party, and those from safe districts (those not facing strong competition for re-election) have been found to be more influential and effective (Ellickson, 1992). Having more than one sponsor or bipartisan
sponsorship increased enactment (Boehmer et al., 2008), as did more activity in general by civil rights and interest groups (Schmeida & McNeal, 2013) and the existence of relatively weak opposition (Fox & Blanchet, 2015).
Notable other facilitating factors included obtaining the support of influential or senior legislator(s) as well as other key players, including parents, physicians, school officials, and other influential champions (Dodson et al., 2009; Goldstein et al., 2003; Merryman et al., 2015; Satterlund et al., 2014). The ability to demonstrate constituent support for a proposed policy to policymakers was instrumental to passing tobacco control policies at the local level (Satterlund et al., 2011).
Prominent barriers to passing Health-related policies included having a small number of supporters with limited political influence, opposition by powerful lobbyists and/or a large number of opponents with greater political influence (Dodson et al., 2009; Shoemaker, 2012), and facing legislators in powerful positions who opposed a bill (Shoemaker, 2012). Additionally, tobacco control advocates reported multiple barriers specific to the policymaking process,
34
Timing was also found to strongly influence bill passage (Fox & Blanchet, 2015; Paul-Shaheen, 1998). In the case of health reform, the defeat of the Clinton Administration’s health care reform package at the national level in 1993 weakened support for the state-level effort in Vermont later that year. Seventeen years later, the passage of the Patient Protection and
Affordable Care Act (ACA) in 2010 helped raise the saliency of health care reform as a political priority issue, and in May 2011 Vermont became the first state to lay the groundwork for a single-payer health care system (Fox & Blanchet, 2015). The state-level policy process can be viewed as a continuum, with major reforms being the product of earlier, smaller efforts at the state and local level (Paul-Shaheen, 1998). Pursuing a statewide policy prematurely can result in a weak policy that has the ability to stymie local efforts and delay the adoption of a more
meaningful statewide policy (Francis et al., 2010). The influence of timing can be viewed both as a political condition and as the opening of a policy window.
The Policy Window
As stated above, an issue is most likely to make it onto the policy agenda when all three streams (problem, policy, and politics) converge, creating a window of opportunity for the policy to pass (Kingdon, 1997). Policy proposals may exist but may not be viewed as feasible,
35
In the problem stream, Herschel Cleveland who was the Speaker of the House at the time (and a Democrat) and then-Governor Mike Huckabee, a Republican, both experienced serious personal health problems related to obesity. Their experiences brought attention to the issue and made it clear that the fight against obesity was bipartisan. Additionally, several significant actions occurred in the political stream leading up to the 2003 legislative session that greatly influenced the attitudes of Arkansas policymakers. In 1999, the Legislature commissioned an Obesity Task Force to study the effects of obesity and make recommendations for state action. In 2000, the task force recommended legislation to enact a comprehensive statewide program to raise public awareness and enhance school policies and practices related to nutrition and physical activity.
Arkansas legislators attended a series of meetings and conferences in 2001 and 2002. At the 2001 National Foundation for Women Legislators Conference, one legislator recalled that “all across the whole wall was plastered ‘Little Rock, Arkansas–number 1 in the nation for childhood obesity and type 2 diabetes,” noting that seeing this really woke them up and
influenced them to speak out. In early in 2002, Arkansas legislators and other policymakers met with leaders from six neighboring states and discussed potential approaches to addressing health issues in their states, including childhood obesity. Later in 2002, leaders were invited to a one-day summit to develop practical, achievable policy alternatives related to nutrition and physical activity in the school environment (R. L. Craig et al., 2010). These activities set the parameters for defining the problems and helped legislators develop realistic, feasible interventions.
36
already established a commission on health care to make recommendations, they had multiple single-payer champions and policy entrepreneurs in the state, a progressive social movement around the issue, and heightened attention was being paid to health reform efforts at the national level. This momentum led to the development of three different proposals that were all too costly for the fiscally conservative governor, and no single plan rose to the top for advocates and
supporters to rally behind (Fox & Blanchet, 2015).
A crisis (real or perceived) and media attention (due to a crisis or on its own) can also serve as a facilitator and create a window of opportunity for policy change. National media exposure was found to influence the passage of legislation intended to prevent childhood obesity in a number of states (Dodson et al., 2009). Additionally, the perception of a crisis alone was able to create a window of opportunity for legislation and serve as a catalyst for political action. The escalating cost of health care in the states served as the key “crisis” (in terms of costs to the middle class, the government, and the business community) that influenced state-level health reform efforts (Paul-Shaheen, 1998).
Policy Entrepreneurs
37
the system so that when a window opens they can push a policy through (Weissert, 1991). In the Arkansas experience described above, the innovative, comprehensive bill to combat childhood obesity was pushed through an open policy window with the help of policy entrepreneurs who were willing to invest their own reputation and resources to advocate for the policy (R. L. Craig et al., 2010). Former House Speaker Cleveland and then-Governor Huckabee were broadly commended by respondents for their willingness to openly share their experiences and focus attention on the issue.
In the mid-1990’s, Pamela Paul-Shaheen looked at health care reform policy activity among the seven U.S. states that had shown the most progress at the time (Florida, Hawaii, Massachusetts, Minnesota, Oregon, Vermont, and Washington) and found that effective
leadership was a major factor in achieving reform in each of the states (Paul-Shaheen, 1998). An open policy window was important for legislative action to occur, but matching a problem with a potential solution or solutions was often the work of a driven and gifted leader who was able to design and shepherd innovative ideas and guide the policy process.
Limitations
38
socioeconomic and demographic (non-political) environment within the state that made it more or less likely to enact health-related legislation.
These categories are not discrete, and some concepts, barriers, or facilitating factors may belong in more than one category. For example, the influence of timing can be viewed both as a political condition and as the opening of a policy window. Likewise, the concept of media coverage highlighting the importance of a specific problem may be viewed as part of the
Table 3: Barriers and Facilitators to Adopting Health-related Policies
CONSTRUCT FACILITATING FACTORS BARRIERS
Environmental Context
• Higher percentage of college-educated adults
• Higher per capita income
• Higher percentage of African Americans
• More households that did not use English as their primary language
• Anticipated problems related to population growth
• Lower percentage of college-educated adults
• Lower per capita income
Kingdon’s Problem Stream
• National media exposure
• Ability to personalize health concerns
• Ability to demonstrate clear evidence of the consequences of the problem
• Negative media exposure
• Misperceptions about the problem
• Arguments that reduced the perceived
significance of the problem (e.g., that there were other, more “pressing” issues, or that the need to address the problem did not outweigh perceived individual rights)
Kingdon’s Policy Stream
• More politically favorable bill content (e.g., “safe routes to school,” access to healthy food, physical activity, or educational programs, health and nutrition content; specific to childhood obesity legislation)
• Insufficient funding/high projected costs
• Administrative concerns about additional reporting and monitoring
• Potential to create an unfavorable environment for business
• Less politically favorable bill content (e.g., related to product or menu labeling, or food or beverage taxes)
Kingdon’s Politics Stream
• Democratic governor
• Unified Democratic government (or a legislature not controlled by Republicans)
• Bipartisan support
• More than one sponsor or bipartisan sponsorship
• Term limits for offices held at the state level
• Support of influential or senior legislator(s)
• Support of other key players including parents, physicians, and schools, constituents, and other influential champions
• Civil rights/interest group activity
• Weak opposition
• Success of a similar effort at the national level
• Small number of supporters with limited political influence
• Large number of opponents with greater political influence
• Opposition by powerful lobbyists
• Legislators in powerful positions who oppose a bill
• Cumbersome, lengthy decision-making process
• Difficulty gaining access to policymakers
• Difficulty effectively presenting information to policymakers
• Defeat of a similar effort at the national level
Characteristics of an Open Policy Window (Kingdon)
• Changes in one of Kingdon’s three streams (problem, policy, politics)
• Convergence of Kingdon’s three streams
• Timing
• National efforts
• Media coverage
• Crisis (real or perceived) Characteristics
of Policy Entrepreneurs (Mintrom, Paul-Shaheen)
• Individuals within the public or private sector
• Willingness of individuals to invest their own reputation and resources to advocate for the policy
• Willingness of individuals to share adverse experiences which focused attention on the issue
• Passion for change
• Political pragmatists
• Ability to match a problem with a potential solution(s)
• Ability to design and shepherd innovative ideas
• Ability to guide the policy process
41
CHAPTER 3: APPROACH AND METHODOLOGY
Study Overview
I conducted four case studies to explore state-level attempts to pass paid family leave policies and identify the barriers and facilitating factors that arose, as well as the lessons that were learned through this process. My case studies used two sequential, qualitative strategies, including an in-depth content analysis and key informant interviews.
First, I completed a review of information that was publicly available in early 2016 (including Web sites, peer-reviewed publications, and other formal enactments) in order to determine state policy activity. Through this review I identified five U.S. states that had adopted a paid family leave policy at the time, including California, New Jersey, Rhode Island,
42 Case Selection
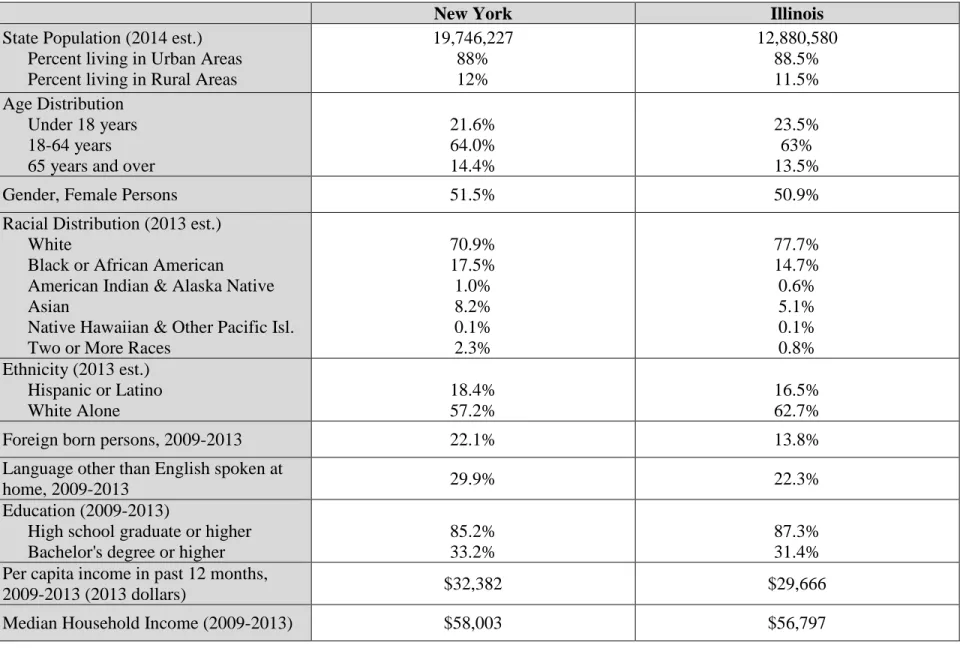
I then selected four states (California, New York, Colorado, and Illinois) for in-depth case studies to better understand their respective processes, barriers, facilitating factors, and lessons learned related to their efforts to adopt a policy (Tables 4 and 5 provide state
comparisons). I chose California and New York over New Jersey and Rhode Island because of the potential applicability of their programs to other states, and because of the potential for a “control” state (Colorado for California and Illinois for New York). Washington was not selected for a case study because at that time, the state still had not determined how to implement the law that had been passed. The New York budget bill was signed on April 4, 2016 and the paid family leave program went into effect on January 1, 2018. The California law was initially enacted in 2002, and was amended and strengthened in 2013, 2016, and 2018 by additional bills. Both California and New York had ongoing efforts around paid family leave for a number of years. Colorado and Illinois had both made attempts to pass a paid family leave policy in 2015 or 2016 that did not succeed.
My intent was to analyze the efforts of these four states as separate case studies. I attempted to select states that were comparable in terms of geographic location, population size, rurality, and political and other socio-demographic factors, in an attempt to limit external factors that would influence outcomes. While all states are different, the comparison states that were unsuccessful did share many characteristics with those that were successful in passing paid family leave legislation.
43
are both considered “western” states, and are similar in terms of political composition. At the time of study, California had a Democratic governor, and Democrats held a majority in both chambers of the legislature. Colorado had a Democratic governor, a slight Republican majority in the Senate, and a Democratic majority in the House. However, California is much larger than Colorado, has a higher Asian population, and a higher percent of the population that identifies as Hispanic or Latino. Additionally, a higher percent of California residents were born in a country other than the U.S. and a higher percentage of the population in California speak a language other than English at home compared to Colorado.
Table 4: Case Study States–California and Colorado
California Colorado
State Population (2014 est.) Percent living in Urban Areas Percent living in Rural Areas
38,802,500 87% 13% 5,355,866 86% 14% Age Distribution
Under 18 years 18-64 years 65 years and over
23.9% 63.6% 12.5% 23.5% 64.2% 12.3%
Gender, Female Persons 50.3% 49.8%
Racial Distribution (2013 est.) White
Black or African American
American Indian & Alaska Native Asian
Native Hawaiian & Other Pacific Isl. Two or More Races
73.5% 6.6% 1.7% 14.1% 0.5% 3.7% 88.0% 4.4% 1.6% 3.0% 0.2% 2.8% Ethnicity (2013 est.)
Hispanic or Latino White Alone
38.4% 39.0%
21.0% 69.4%
Foreign born persons, 2009-2013 27.0% 9.7%
Language other than English spoken at
home, 2009-2013 43.7% 16.8%
Education (2009-2013)
High school graduate or higher Bachelor's degree or higher
81.2% 30.7%
90.2% 37% Per capita income in past 12 months,
2009-2013 (2013 dollars) $29,527 $31,109
Median Household Income (2009-2013) $61,094 $58,433
Persons below poverty level (2009-2013) 15.9% 13.2%
Date Most Recent Bill Passed/Failed 2016 (P) 2015 (F)
Date Most recent bill Implemented 2018? N/A
Previous attempts (Pass/Fail) 2002 (P), 2013 (P), 2014 (F)
Governor Jerry Brown (D, 2011–2018) John Hickenlooper (D, 2011–2018)
State Senate Majority D (26–14) R (18–17)
State House/Assembly Majority D (52–28) D (34–31)
Senate Sponsor(s) N/A Ulibarri (D)
House/Assembly Sponsor(s) Jimmy Gomez (D), Autumn R. Burke (D) Winter (D), Salazar (D)
Presidential Candidate Supported (2012) Obama Obama
Who is Eligible
Employees who participate in the State Disability Insurance (SDI) Program or a
voluntary DI plan
All employees in the state who have worked at least 680 hours in the last year
Length of Leave 6 weeks 12 weeks
Percent of Pay Currently 55%
60–70% in 2018 66% to 95% depending on earnings
Weekly Maximum $1,075 $1,000
Includes Self-care? No Yes
Includes Job Protection? No Yes
Paid for by: Employee contributions Employee contributions