http://www.jscdss.com Vol.5 No.3 June 2018: 1-6 Article history:
Accepted 26 April 2018 Published online 27 April 2018
Journal of Soft Computing and Decision
Support Systems
Energy Optimization in Wireless Sensor Networks Using Grey Wolf
Optimizer
Zohreh Jabinian a, Vahid Ayatollahitafti b,*, and Hadi Safdarkhani c
a
Department of Computer Science, Yazd Branch, Islamic Azad University, Yazd, Iran
b
Department of Computer Science, Taft Branch, Islamic Azad University, Taft, Yazd, Iran
c
Department of Electrical Science, Yazd University, Yazd, Iran
* Corresponding author email address: [email protected]
Abstract
Wireless Sensor Network (WSN) has some great advantages such as various communication and arrangement, low power consumption and low cost. These sensors are small in sizeand they can carry out the process of sensing eventsand communicate with each other. These networks are used to detect events or phenomena, collect and process data, and send sensory information to the user. In WSNs, due to the short battery life span of sensors, optimal energy consumption has always been a challenge. In this paper, an energy optimization method is proposed using Grey Wolf Optimization and Genetic algorithms for communications.The proposed method uses different energy model to optimize energy consumption with an arbitrary set of parameters.Simulation results show that the proposed method has a good performance in terms of energy consumption and network lifetime compared with the similar method.
Keywords: Wireless Sensor Network, Grey Wolf Optimizer, Energy
1. Introduction
Wireless Sensor Networks (WSNs) have been taken into consideration in recent years due to their low cost and extensive applications such as national security, military, and environmental monitoring (Akyildiz et al., 2002). WSN consists of a large number of low power and low cost sensor nodes equipped with communication, data processing, and sensor components. The sensors in these networks use a limited power supply; as if they end the network lifetime since the resources are non-renewable (Rault et al., 2014).
To further utilizing and extending the life of these types of networks, researchers are always looking for ways to reduce energy consumption. To reduce the amount of energy consumption while transmitting roaming-based clustering protocols, using mechanisms such as selecting cluster heads from sensor nodes to cluster heads, and aggregating information in the cluster head and transmitting information from cluster heads to the main station can have a significant effect on energy reduction (Lia, 2012).
Consumers are involved in saving energy. The length of the knots is short due to the power limitation of the power supply. In addition, in some cases, the special position of a node in a network intensifies the problem. For example, a
node located at a distance of one step from the centre node, on the one hand, will lose its energy very quickly due to its high workload, and, on the other hand, it will interrupt the connection of the central node with the entire network and thus cause the network to fail (Akkaya et al., 2005). The problem of early energy depletion is also true for nodes in low-density regions in non-uniform distribution of nodes. In such cases, it is appropriate to have an energy management within nodes and to provide informed energy solutions that use the least critical nodes (Rana et al., 2010).
According to the stated statements, all the algorithms and techniques used in sensor networks should consider serious limitation and should try to act with awareness of the energy level to consume the least amount of energy (Pour et al., 2016; Rault et al., 2014).
In this research, we try to optimize energy consumption in WSN using the latest meta-heuristic and intelligent algorithm designed for engineering issues, the Grey Wolf Optimizer (GWO) (Al-Aboody et al., 2016). The grey wolf optimization algorithm is one of the newest superconductor algorithms inspired by the hierarchical structure of the wolf's hierarchy of leadership and social behaviour during hunting. This algorithm is based on population and uses four types of grey wolves, such as alpha, beta, delta and omega to simulate the hierarchy of leadership. In addition,
three main steps in the hunting process (targeting, baiting, and attacking bait) are also implemented in this algorithm. The process of this algorithm is simple and easy to generalize to large-scale issues.
2. Related work
Authors in (Norouzi et al., 2014; Peiravi et al., 2013) use a method based on a single control parameter in order to obtain an agreement between lifetime and network efficiency. Using the Markov chain scheme, it compares with the standard method in terms of node efficiency and overall lifetime of the network. Finally, by stimulating the network's topologies in a real-world sensor network, it shows the impact of this map, which increases the average life expectancy of the battery and speed of the receiver.
In (Pal et al., 2016), the reduction of energy consumption of wireless sensor networks is examined by using the selection of efficient clusters based on a new bioeconomic optimization inspired bioecology clustering protocol. Simulation results show that this method improves network lifetime and network stability.
In (Malekan et al., 2014), the Antarctic Optimization Algorithm (ACO) is based on the backplane problem used to spread sensors. Spreading sensors is one of the most important issues in the WSN, because an optimal expansion plan can reduce costs, increase the ability of WSN routing, view and monitor quality in WSN by increasing coverage areas.
In (Jha et al., 2017), minimizing energy level is considered as one of the most important challenges ahead of wireless sensor networks, and choosing a method to maximize battery life is important. Optimization methods have been recognized as an important tool to solve the limited battery power problem in the WSN, in order to achieve optimal network cost, reliability and energy efficiency.
In (Man and Singh, 2017), energy routing in wireless sensor networks is a challenge that requires unusual patterns to design and develop power protocols. Group-based integration intelligence methods in decentralized and self-sustained systems can be used to optimize the energy consumption of data routing. In the paper, a clustering algorithm is presented, which deals with a Haste-based hierarchy routing protocol to optimize energy consumption in the.
Grey Wolf Optimizer algorithm (Al-aboody et al., 2016) is an algorithm inspired by the hierarchy of leadership structure and the social behaviour of grey wolves during hunting. This algorithm is based on population and uses four types of grey wolves, such as alpha, beta, delta and omega to simulate the hierarchy of leadership. In addition, the three main steps in the hunting process (targeting, baiting, and attacking bait) are also implemented in this algorithm. The process of this algorithm is simple and easy to generalize to large-scale issues. This algorithm is inspired by the surrounding wilderness.
Different energy consumption models have been used for wireless sensor networks. Melodia et al. (2007)
describes an energy consumption model for each bit of information in the physical layer.
Raghogutan et al. (2002) have consider the cost of energy for transmitting a bit of information as a function of packet size (L), header size (H), total expenditures, or required processing with symbol for launch.
The radio energy is calculated for a M-ray modulation scheme.
Hinselman et al. (2002) have proposed a low-power chain-hierarchy algorithm for WSNs. This algorithm selects a few nodes as chain headers, so that the gap between the chain and the central node (hole) is greater than the distance between the central node (hole) and the other nodes of the sensor in which the chain is located.
According to the stated materials, all algorithms and techniques, used in wireless sensor networks, mentioned that energy is a serious constraint. They try to be aware of the energy level to consume the least amount of energy and thus increase the lifetime of the sensor network.
3. Proposed Method
This section introduces the proposed method based on the GWO algorithm and describes the proposed model and algorithm.
3.1 Modeling of Hierarchical Structure
Grey wolves are at the top of the food chain and have a social life. The average number of wolves per herd is between 5 and 12. There are 4 main categories in each herd.
Leaders or alpha wolves: These wolves are dominant in
herds and manage things like resting or hunting. But in addition to the dominant behavior of alpha wolves, a democratic structure is also seen in the group. Alpha wolves are not necessarily the strongest member of the herd, but they are the best in terms of herd management. This shows that organization and discipline are more important than one in a group.
Beta wolves: They are helping alpha wolf in decision
making or other herd activities and are also prone to being selected instead.
Delta wolves: Below the beta wolves, including waggons,
watchers, elders, hunters.
Omega Wolves: The lowest order which has the lowest
right to the rest of the herd, they eat after others and do not participate in the decision-making process and play the role of the victim in the herd. Optimization is done using the wolf alpha, beta and delta. A wolf is assumed as the main alpha of the algorithm, and a beta and delta wolf also helps wolf alpha and the rest of the wolf (omega) is considered as their follower (Mirjalili et al., 2014).
3.2 Modeling the Hunting Siege Process
behavior, we use two of the following modeling relationships.
⃗⃗
⃗⃗
⃗
⃗⃗
(1)⃗⃗
|
⃗
⃗⃗
⃗⃗
|
(2)
Where ⃗⃗⃗ ⃗⃗ are the coefficients of the vector, ⃗⃗ is the hunting location vector and ⃗⃗ is the vector of the
location of each wolf, and t is the number of repetitions. The two vectors ⃗⃗ and ⃗ are calculated as follows:
⃗⃗⃗ ⃗ ⃗ (3)
(4)
Where the components of are linearly reduced from 2 to zero during successive repetitions, and and are random vectors in the interval [0,1].
(
) (5)
3.3 Modeling the hunting process
Grey wolves have the ability to estimate hunting positions and encircle them. Hunting is usually driven by alpha. The beta and delta wolves may also occasionally participate in hunting. However, we have no idea about the preferred place (prey) in an abstract search space, it is assumed that alpha, beta, delta have the first best knowledge of hunting status (the optimal solution point). Therefore, it stores three of the best solutions so far and requires the rest of the search factors (including omega) to update their position according to the location of the best search factors.
3.4 Searching for hunting (exploration)
The process to search a procedure is precisely reverse of the attack process: when searching for wolves, they move away from each other to track the hunt (| A |> 1), while after tracing the hunt, the wolves are approaching each other in the attack phase (| A | <1)
The local and global search is highly dependent on how the parameter works and how elitism is selected to update the population of candidate solutions. This approach will eventually bring the wolves closer to the alpha, beta, and delta, thereby reducing the local and global search for global optimization. Reducing local and global search will make the Grey wolf algorithm susceptible to falling into the optimal local trap.
3.5 Optimization of energy using GWO
In previous studies, the cluster was selected as distributed which energy consumption was high or concentrated, as a node decides for the entire network, traffic on this node is high and if this node is affected the whole network will be in trouble. In this study, in addition to optimizing energy consumption (E), several effective steps have been taken to reduce computations and increase the life span of the network.
A value is defined as the minimum amount of energy required for clustering, so that each node which its energy is less than the threshold is not suitable for clustering.
i. A blind spot, or a very small number of neighbors, cannot be a leader, even if it has a lot of energy. ii. Each node calculates the odds parameter itself,
which indicates that each node has a good chance of clustering than the rest of the nodes. Due to the longer lifetime of the network, if two nodes have the same odds and are in the neighborhood, one of them will be shut off at that point to help with the lifetime of the network.
In each round, the nodes that qualify run this wolf algorithm; a lucky amount is found for each node. In our method, the cluster head is selected in a decentralized manner based on the grey wolf algorithm. There are many parameters that can be used to select the cluster, but it should be noted that as the number of parameters increases,
calculations and, consequently, time and energy
consumption increases.
3.6 Adjustment of productivity and exploration parameters
The hunting process in the grey wolf algorithm is performed using a linear reduction of a vector . According to Equation 3, vector ⃗⃗ is a random vector in the interval
[-2a, 2a], with decreasing a, the vector of the coefficients ⃗⃗ decreases. When | A | <1, the alpha wolf approaches the hunts (the rest of the wolves) and causes searching locally and improving efficiency of the proposed method. If | A |> 1 wolf will go away from hunting (the rest of the wolves) and will search globalization and increasing the discovery of the proposed method.
3.7 Termination condition of gray wolf algorithm
After the next generation was generated by the Grey Wolf algorithm, one of implementation phase is over. The initial population in the repetition loop is first evaluated and then arranged in ascending order based on the energy consumption functions. The energy consumption of each population of 70 per replication is maintained in arrays so that at the end of the implementation of the grey wolf algorithm using this array, the graph of the grey wolf algorithm is mapped. The termination condition in the grey wolf algorithm depends on three modes:
ii. Convergence to an optimal answer when it is not aware of the optimal value.
iii. No change after a certain number of repetitions.
4. Performance Evaluation
4.1 Simulation
The nodes are dispersed in an environment of 100 meters in 100 meters using a Poisson homogeneous distribution. The primary energy of the nodes is 1 μJ, and the nodes consume 50 nJ/bit of energy for sending and receiving data. The radio range of each node was 50 meters. The target node is fixed in coordinates (50, 50), and is used to determine the distance between the nodes in Euclidean. One of the most basic issues in various uses is how to form data structures on a set of points to calculate the nearest neighbour. In order to solve this problem in two-dimensional space, there are proper solutions, the most common of which is the formation of a Voronoi diagram on the data. Voronoi diagram is the basic computing tool in geometric computing, which is used in applications such as clustering, motion planning, learning, and retrieval levels.
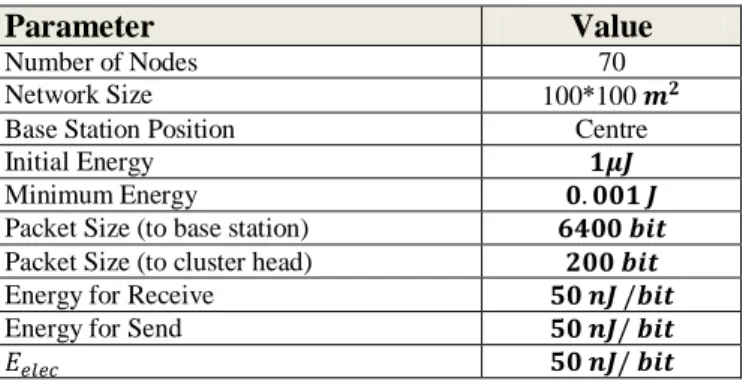
Information about the distance between nodes is stored in the matrix. It can also be used as a connection matrix to be aware of the existence of the connection between the two nodes. In all simulations, the unit graph is considered with 70 randomly distributed nodes. A matrix is also used to store the energy of the nodes, which is updated after each run. The default values for the energy consumption model are described in Table 1. The reason for using the parameters in Table 1 is the concept of sensor network parameters testing, which are common in the experiments in the research and papers related to the wireless sensor network, and in most related articles, these parameters are used as test parameters.
Table 1
Simulation Parameters
Value Parameter
70 Number of Nodes
100*100 Network Size
Centre Base Station Position
Initial Energy
Minimum Energy
Packet Size (to base station)
Packet Size (to cluster head)
Energy for Receive
Energy for Send
The number of generations of grey wolf algorithms is 80 generations and the size of the population is 70 wolves in order to compute some computational overhead at run time. Also, number of iteration is 200.
4.2 Experiments and simulation results
The proposed method is compared with the GA algorithm (Jha and Eyong, 2017). Different GA techniques are designed using different combinations of selection, cutting and mutation operations. In particular, three mutation functions, four selection functions, and four cut-off functions are used; the details of these operators are as follows.
4.2.1 Selection operator
At the selection stage, a pair of chromosomes are selected to combine, the operator selects the interface between the two generations and transfers some members of the current generation to the next generation; after selection, the genetic operators are applied to the two selected members, the criterion choosing members is their matching value, but the selection process has a random state. The methods of Stochastic Uniform Selection, Uniform Selection, roulette wheel selection and tournament selection have been used in this analysis (Goldberg, 2006; Deb et al.,2002).
4.2.2 Cutter operator
In the nature, the survival of the generation is one of the most important factors, and the only possible operator for this is mixing. There are also genetic algorithms that interact. Coupling with the exchange of genes occurs between the two chromosomes, and each of the chromosomes transmits characteristics from their own to the children. Obviously, chromosomes that have more fit are more likely to mix. The most important operator in the genetic algorithm is the cutting operator. Cutting is a process in which the old generation of chromosomes are mixed together to form a new generation of chromosomes. The couples that were considered as the parent in the selection section will exchange their genes together and create new members.
The cutting of members with a high adaptation results in the creation of members that are more consistent with the average adaptation. Cutting in the genetic algorithm destroys the genetic dispersion or genetic diversity of the population, because it allows good genes to come together. Of the four common cutting functions, the constraint dependent, the single-point cut, the two point cut; the heuristic cut is used in analyses (Goldberg, 2006; Deb et al., 2002).
4.2.3 Mutation operator
dependent, uniform, and adaptive constraints (Goldberg, 2006; Deb et al., 2002).
4.3 Results of experiments
In Fig. 1, the GWO and GA-11 algorithms are compared with each other in terms of network power loss over 200 periods of sending and receiving. As we can see, our algorithm is much smoother and more uniform than the GA-11 in terms of energy degradation. The non-uniformity of network energy in the GA-11 and the imbalance in energy consumption in the cluster lead to a reduction in network lifetime.
Fig. 1. The energy loss rate of the network for model 1
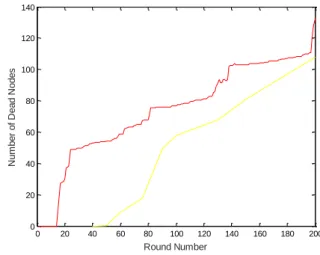
In Fig. 2, the number of dead nodes in each round is the implementation of the GWO algorithm along with the GA-11 algorithm. Death of the first node in the GWO algorithm occurs in this scenario at round 44, and the first node in the GA-11 algorithm dies at round 25. Therefore, in this scenario, the GWO algorithm has been able to delay the first node with the GA-11 algorithm.
Fig. 2. Compare the number of dead nodes for model 1
The best suited functions for each of the three energy models for data communications in the WSNs are presented in Figs. 3, 4, and 5, respectively. Each of the shapes draws and adjusts the amount of compatibility (the value of the
compatibility function or energy function) versus the number of generations.
Fig. 3.Fitness of energy model 1 using GWO
Fig. 4. Fitness of energy model 2 using GA-11
Fig. 5. Fitness of energy model 3 using GWO
0 20 40 60 80 100 120
1 2 3 4 5 6 7 8 9 10x 10
-4
Generation
F
it
n
e
s
s
Va
lu
e
Best Fitness Mean Fitness
0 20 40 60 80 100 120 140 160 180 200 0.02
0.04 0.06 0.08 0.1 0.12 0.14 0.16
Round Number
Av
e
ra
g
e
En
a
e
rg
y
o
f
Ea
c
h
N
o
d
e
GA-11 GWO
0 20 40 60 80 100 120 140 160 180 200 0
20 40 60 80 100 120 140
Round Number
N
u
m
b
e
r
o
f
D
e
a
d
N
o
d
e
s
0 20 40 60 80 100 120
-6 -4 -2 0 2 4 6 8x 10
-8
Generation
F
it
n
e
s
s
Va
lu
e
Best Fitness Mean Fitness
0 20 40 60 80 100 120
1 2 3 4 5 6 7 8x 10
-4
Generation
F
it
n
e
s
s
Va
lu
e
5. Conclusion
Grey Wolf Optimizer algorithm is one of the newest superconductor algorithms inspired by the structure of the hierarchy of leadership and wolf's social behaviour during hunting. In this research, various methods of GA and grey wolf algorithm are implemented independently of energy models for WSN data communication with the aim of finding the desired energy consumption conditions. The fitness criterion is based on the minimum energy consumed by the network nodes during each period of data sending operations during the tests. Selection of the population of the new generation with the "least disturbance of network energy" criterion in the previous period in the grey wolf algorithm has caused a balance and uniformity in energy consumption and nodes and prolonged network life. As future work can be done by taking exploration and exploitation in the grey wolf algorithm, instead of the linear function, we use a reduction of non-linear functions such as polynomial functions. Linear learning automata and cellular automata can also be adapted to some sort of grey wolf algorithm by setting different penalty rules and rewards in the automata.
References
Akkaya, K., & Younis, M. “A survey on routing protocols for wireless sensor networks.” Ad hoc networks, 2005, 3(3), 325-349.
Akyildiz, I. F., Su, W., Sankarasubramaniam, Y., & Cayirci, E. “Wireless sensor networks: a survey.” Computer networks, 38(4), 2002, 393-422.
Al-Aboody, N. A., and H. S. Al-Raweshidy. "Grey wolf optimization-based energy-efficient routing protocol for heterogeneous wireless sensor networks." Computational and Business Intelligence (ISCBI), 2016 4th International Symposium on. IEEE, pp. 101-107, 2016
Deb, K., Pratap, A., Agarwal, S. and Meyarivan, T. “A fast and elitist multiobjective genetic algorithm: NSGA-II,” IEEE Trans. Evol. Comput., vol. 6, no. 2, pp. 182–197, 2002. Goldberg, D. E., Genetic algorithms. Pearson Education India,
2006.
Heinzelman, W. B., Chandrakasan, A. P. and Balakrishnan, H., “An application-specific protocol architecture for wireless microsensor networks,” IEEE Trans. Wirel. Commun., vol. 1, no. 4, pp. 660–670, 2002.
Jha, S. K. and Eyong, E. M.,“An energy optimization in wireless sensor networks by using genetic algorithm,” Telecommun. Syst., pp. 1–9, 2017.
Liu, X. “A survey on clustering routing protocols in wireless sensor networks”. sensors, 2012, 12(8), 11113-11153. Malekan, Z., Mirabedini, S. J., Zarei, H. and Aboksar, M. A.,
“Optimizing Energy consumption in sensor networks using ant colony algorithm and fuzzy system,” Int. J. Comput. Appl., vol. 1, no. 4, 2014.
Mann, P. S. and Singh, S., “Energy-Efficient Hierarchical Routing for Wireless Sensor Networks: A Swarm Intelligence Approach,” Wirel. Pers. Commun., vol. 92, no. 2, pp. 785– 805, 2017.
Melodia, T., Pompili, D., Gungor, V. C. and Akyildiz, I. F., “Communication and coordination in wireless sensor and actor networks,” IEEE Trans. Mob. Comput., vol. 6, no. 10, 2007.
Norouzi, A. and Zaim, A. H., “Genetic Algorithm Application in Optimization of Wireless Sensor Networks,” The Scientific World Journal, 2014. [Online]. Available: https://www.hindawi.com/journals/tswj/2014/286575/. Peiravi, A., Mashhadi, H. R., and Hamed Javadi, S., “An optimal
energy-efficient clustering method in wireless sensor networks using multi-objective genetic algorithm,” Int. J. Commun. Syst., vol. 26, no. 1, pp. 114–126, 2013.
Pour, N. K., “Energy Efficiency in Wireless Sensor Networks,” ArXiv Prepr. ArXiv160502393, 2016.
Pal, R., Pandey, H. M. A., and Saraswat, M. “BEECP: Biogeography optimization-based energy efficient clustering protocol for HWSNs,” in Contemporary Computing (IC3), 2016 Ninth International Conference on, 2016, pp. 1–6.
Rana, R., Hu, W., & Chou, C. T. “Energy-aware sparse approximation technique (east) for rechargeable wireless sensor networks.” In European Conference on Wireless Sensor Networks, 2010, (pp. 306-321). Springer, Berlin, Heidelberg.
Rault, T., Bouabdallah, A. and Challal, Y., “Energy efficiency in wireless sensor networks: A top-down survey,” Comput. Netw., vol. 67, pp. 104–122, 2014.