THE EFFECTS OF BORING SPONGE ON OYSTER SOFT TISSUE, SHELL INTEGRITY, AND PREDATOR-RELATED MORTALITY
Sara E. Coleman
A thesis submitted to the faculty at the University of North Carolina at Chapel Hill in partial fulfillment of the requirements for the degree of Master of Science in the Department of Marine
Sciences in the College of Arts and Sciences
Chapel Hill 2014
Approved by:
iii ABSTRACT
Sara E. Coleman: The effects of boring sponge on oyster soft tissue, shell integrity, and predator-related mortality
(Under the direction of F. Joel Fodrie)
iv
ACKNOWLEDGEMENTS
v
TABLE OF CONTENTS
LIST OF TABLES………..vi
LIST OF FIGURES………...………..vii
INTRODUCTION………..……….1
CHAPTER 1: EFFECTS OF BORING SPONGE ON OYSTER SOFT TISSUE AND SHELL INTEGRITY………...………8
Introduction……….…….8
Methods………...……….………..…11
Results……….……….………..13
Discussion……….……….16
CHAPTER 2: PREDATOR PREFERENCE AND CHANGES IN FEEDING RATES IN THE PRESENCE OF CLIONA………..……34
Introduction………...34
Methods……….….36
Results………...38
Discussion………..39
CONCLUSION………..47
vi
LIST OF TABLES CHAPTER ONE
vii
LIST OF FIGURES
CHAPTER ONE
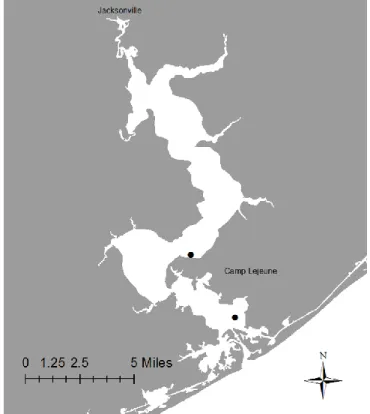
Figure 1.1 Map of Eastern North Carolina showing the collection
sites for oysters from the multi-site survey………...….23 Figure 1.2 Map showing the collection sites for the targeted
North River sample, just south of North River Bridge………..24 Figure 1.3 Map showing the collection sites for the targeted New River sample……….24 Figure 1.4 Average Condition Index based on sponge infestation and site……….…..25 Figure 1.5 Average Condition Index for the targeted New River sample
based on oyster mass categories………..…..25 Figure 1.6 Average Condition Index for the targeted New River
sample based on oyster length categories………..……26 Figure 1.7 Average thickness index based on site for the multi-site survey………..27 Figure 1.8 Average crushing force for a subset of oysters from
the multi-site survey………...…27 Figure 1.9 Average crushing force based on oyster mass for
the targeted North River sample………28 Figure 1.10 Average stiffness for oysters from the targeted North River
sample based on oyster mass……….29 Figure 1.11 Average stiffness for oysters from the targeted North River
sample based on oyster length………..…29 Figure 1.12 Average force required to crush live oysters from the
targeted New River sample, based on oyster mass……….….30 Figure 1.13 Average stiffness for live oysters from the targeted
New River sample, based on oyster mass……….…30 Figure 1.14 Average density of oysters from the targeted New River
viii
Figure 1.16 Average reward/effort ratio for oysters from the targeted
New River sample based on oyster length………32 Figure 1.17 A comparison of the average force required to crush
oysters when tested live or as bleached shells………..32 Figure 1.18 A comparison of the average stiffness of oysters when tested
live or as bleached
shells………..33 CHAPTER TWO
Figure 2.1 Average number of oysters eaten per trial in the foraging
rate experiment as a function of ambient water temperature……….……44 Figure 2.2 Average number of oysters eaten per trial in the foraging
rate experiment before being corrected for temperature………44 Figure 2.3 Average number of oysters eaten per trial in the foraging
rate experiment adjusted for temperature………..…45 Figure 2.4 Results of the selection experiment………..…45 Figure 2.5. Handling time in seconds as a function of oyster size
1
INTRODUCTION
Optimal foraging theory is a well-studied model for predicting an organism’s feeding behavior. This concept suggests that an animal should maximize its net energy intake per unit of time foraging (MacArthur & Pianka 1966). An expansion on optimal foraging theory states that in cases where predators can evaluate the profitability of a prey item, food preferences will evolve in such a way that the predator will choose those items which give it the most food value in return for its efforts. This framework is used to explain most predator-prey interactions.
Predator-prey dynamics have the ability to determine the abundance and size structure of prey populations (Paine 1966, Sih et al. 1985), but an interesting caveat arises with the
consideration of parasitism. Parasitism is becoming an increasingly recognized factor that may alter predator-prey interactions and food web dynamics (Minchella & Scott 1991). Parasitized prey may be more conspicuous or less likely to show an escape response, and therefore more susceptible to predation (Holmes & Bethel 1972). Several studies have shown that parasitized prey are disproportionately consumed by predators (Hudson et al. 1992, Bakker et al. 1997). For example, amphipods are visibly altered by infection by acanthocephalan parasites
Pomphorhynchus laevis, which leads to significantly more predation by fish than on uninfected individuals. Artificially coloring uninfected amphipods to mimic parasitized individuals
reinforced the notion that parasite color increases amphipod vulnerability to predation (Bakker et al. 1997). Similarly, killifish Fundulus parvipinnis infected by a trematode parasite are
2
If parasitism has the ability to impact predator-prey dynamics, and therefore optimal foraging theory, perhaps other changes to prey condition may have this effect as well. For example, destruction by bioeroders, such as boring sponges, has been shown to increase prey susceptibility to predation. In a gastropod, Cliona spp. weakens shell strength and eliminates a size refuge from crab predators, by making large snails an attractive food source. Severely bored
Littorina littorea require a 29% lower mean compressive force to break than unbored snails (Stefaniak et al. 2005). Such results suggest increased predation on bored snails, since optimal foraging theory predicts that an organism will forage in a way to maximize energy intake and minimize time and effort spent. This thesis examines the changes in susceptibility to predation and mortality, in regard to optimal foraging theory, of another mollusk when infested with
Cliona spp.
Boring sponges have long been recognized as eroders of mollusk shells. Described in the early 1800s in Europe (Grant 1826) and in North America a few decades later (Leidy 1889),
Cliona celata was thought to be especially prevalent among sedentary, epibenthic bivalves, such as the Eastern oyster Crassostrea virginica. Cliona sp. excavate tunnels and galleries into
3
spicules. Further research indicated that a combination of acidic secretions and mechanical etching was responsible for shell excavation (Warburton 1958).
The next pressing matter was to determine why Clionids infest calcareous materials. Contrary to original hypotheses, the structure and physiology of the boring sponge are the same as those of any other free living sponge, and it obtains no food or nutrients from its ‘host’ (Thomas 1979). It appears that Cliona spp. burrow into the shells of bivalves and other
calcareous material as a means to escape predation. In field and laboratory experiments, ten out of thirty species of molluscs, crustaceans, polychaetes and echinoderms consume the sponge. Of these, the urchins Arbacia and Lytechinus are the most damaging spongiovores (Guida 1976). With a large suite of potential predators, boring sponges are under high predation pressure.
In the mid-Atlantic, C. virginica provide a multitude of ecosystem services, and are often infested with Cliona spp. These reef-building bivalves form complex, three-dimensional
4
Oyster populations have experienced precipitous declines in the last century, and the loss of this key species is likely to have adverse consequences. Reduction in the abundance of
ecosystem engineers has been shown to have significant impacts on the surrounding environment (Coleman & Williams 2002). Since the early 1900’s there has been a trend of declining oyster reef extent and biomass with evidence of losses up to 85% globally and 88% within the United States (Beck et al. 2011, zu Ermgassen et al. 2012). Reduction of oyster reefs can potentially have significant impacts on the ecosystems they inhabit. For example, Newell (1988) estimated that subtidal oysters in Chesapeake Bay feed for over 23 hours per day, and that in the late 1800s, the population was great enough to filter the entire water volume of the bay every 3.3 days. As of the late 1980s, filtering the entire volume of the bay would take the oyster population 325 days, and surely this number has only grown in recent decades (Newell 1988). Reduced oyster populations can lead to decreased water quality, as oysters lessen the concentrations of suspended sediments and detritus in the water column (Gerritsen et al. 1994). While
unsustainable harvest of oysters is most likely the largest factor contributing to reef decline (Kirby 2004), a number of other stressors may also contribute to reef degradation. Destructive fishing techniques, such as trawling and dredging, can reduce reef height and structural
complexity, making oysters more susceptible to other threats such as hypoxia and anoxia which are more severe at deeper depths (Lenihan & Peterson 1998). Additionally, terrestrial
5
1991). Increasing levels of pollutants present in sediments, as well as higher temperatures, make these diseases more virulent (Chu & Hale 1994).
The bioeroding sponge, Cliona celata, may be another biotic threat to oyster health and abundance. Due to the high commercial value of oyster fisheries, impacts of Clionids have the potential to inflict economic loss. This threat to oyster fisheries has been long-recognized (de Laubenfels 1947, Hancock 1969) and fishermen agreed that it was one of the chief reasons for loss of otherwise marketable oysters, as heavily infested shells are easily crushed and unsightly. Such individuals are not salable and deemed “rottenbacks” (Hancock 1969). To rid shells of boring sponge, various techniques have been employed by fishermen, including periodically moving oysters above the low-water mark on shore, where the sponge dies, or dipping oysters in a brine solution (Hancock 1969). Even in younger oysters, shells weakened by sponge boring may disintegrate upon being opened, and the sulfurous smell of decaying sponge after harvesting can detract from market value (Carver et al. 2010). The sponge has also become an enemy of the pearl industry. In Western Australia, Cliona is a chief concern of the future sustainability of the pearling industry, one of Australia’s most valuable aquaculture industries, generating around $125 million annually (Daume et al. 2009). Oysters Pinctada maxima, harvested from wild stocks and transferred to farms, are experiencing substantial levels of infestation of bioeroding sponges (Daume et al. 2009).
6
Surveys of oyster and boring sponge populations on oyster sanctuaries constructed in the eastern region of Pamlico Sound by the NC Division of Marine Fisheries and their academic and not-for-profit partners have shown the failure of once expanding oyster populations, particularly in sanctuaries in Ocracoke and Clam Shoal. These oyster population crashes have been attributed in part to the high abundance of oyster drills and the invasion of Cliona spp. sponges into the oysters and more importantly, into the marl substrate of these reefs (Lindquist. 2011). Alternatives to marl, non-carbonate materials like granite and concrete are currently being
researched as reef building materials that may better resist Clionid infestation (Dunn et al. 2014). As the reef substrate becomes infested, further recruitment may be limited as boring sponges have been found to significantly hinder settlement and increase larval mortality (Barnes et al. 2010).
With the ability to directly quantify how Clionids impact the soft tissue and shell strength of individual oysters, further research could better elucidate the impacts of boring sponges on individual oysters and oyster reefs. There are challenges for measuring the extent to which infestation by boring sponges, especially when excavations reach the inner surface of the valve, potentially increase the metabolic expenditures for infested oysters and thus retard growth rates (Rosell et al. 1999). Furthermore, great uncertainty remains as to how Clionids alter species interactions, such as fouling and predation. Some evidence suggests that perforations by the boring sponge render oysters more susceptible to damage by polychaetes or other infections, and cause oysters to secrete more nacre in an attempt to seal off perforations (Alagarswami &
Chellam 1976). And while many studies speculate that oysters are weakened by sponge
7
8
CHAPTER 1: THE EFFECTS OF BORING SPONGE ON OYSTER SOFT TISSUE AND SHELL INTEGRITY
Introduction
Cliona sp.are bioeroding sponges that excavate vast galleries and tunnels in calcareous objects through mechanical etching and acidic secretions (Rützler & Rieger 1973, Warburton 1958). These sponges are found throughout the world, and are assumed to negatively impact their hosts, often bivalve mollusks and corals. Infestation by Clionids has long been linked to losses in the oyster fishery, as heavily infested bivalves are unsightly, easily crushed, and sometimes malodorous (Hancock 1969, Carver et al. 2010). In oysters in the mid-Atlantic in particular, Cliona celata burrows deep into the shell, almost coming into contact with the
animal’s flesh. This stimulates the oyster to repair and build new shell material, which can divert resources from growth and prevent the oyster from becoming “large and succulent” (de
Laubenfels 1947). The tissue from oysters heavily infested by Cliona sp. often appears thin and watery (Old 1941). In another mollusc, the snail Littorina littorea was seen to increase lip thickness and produce more shell material on the inside when infested with boring sponge (Stefaniak et al. 2005). Such shell thickening led to reduced body size, and therefore reduced fecundity. Prevalence of sponge infestation decreased with increasing tidal height and increased with increasing snail size (Stefaniak et al. 2005).
9
counterparts. Conditon Index was developed by Hopkins (1949) to give a picture of the quality of the meat when reduced to a dry basis, in an attempt to eliminate errors caused by osmotic effects and spawning. The formula is as follows:
𝐶𝑜𝑛𝑑𝑖𝑡𝑖𝑜𝑛 𝐼𝑛𝑑𝑒𝑥 = 100 x 𝑑𝑟𝑦 𝑤𝑒𝑖𝑔ℎ𝑡 (𝑔) 𝑉𝑜𝑙𝑢𝑚𝑒 𝑠ℎ𝑒𝑙𝑙 𝑐𝑎𝑣𝑖𝑡𝑦 (𝑐𝑐)
Many factors can affect Condition Index (CI), including time of year and spawning status (Baird 1958). Perhaps most usefully, CI can be an indicator of oyster health when parasites and disease are present. Paynter and Burreson (1991) found that infection by the protist Perkinsus marinus
caused a significant reduction in CI when measured from January to October in Chesapeake Bay. Similarly, P. marinus infection is also associated with reduced condition in Louisiana oysters (Gauthier et al.1990). Oysters in poor condition also have higher concentrations of pigment cells, greater atrophy of the digestive diverticula and increased parasitism by the sporozoan
Nematopsis ostrearum (Gauthier et al. 1990). Infestation by polychaete Polydora sp. has been shown to reduce condition in oysters as well (Wargo & Ford 1993).
For sessile bivalves like oysters, a strong, resilient shell is the best defense against
10
ways, depending on the breakage process. Compressive force is most often studied because it is an experimentally simple technique that can shed light on a broad range of shell parameters as well as a mollusk’s susceptibility to predation from crushing predators (Lombardi et al. 2013).
Taking into account both soft tissue quality and shell integrity, a cost vs. reward value can be determined for each oyster. Optimal foraging theory states that an organism should choose to collect resources in a patchy environment in a way that maximizes the net gain of food per unit time spent foraging (MacArthur & Pianka 1966). Assuming that a predator can rank prey types according to their value, an energy maximization model can be created (Elner & Huges 1978). For instance, when blue crabs Callinectes sapidus were offered three species of bivalve prey, profitability curves correctly predicted crabs would prefer the most profitable soft clam over less energetically profitable options (Ebersole & Kennedy 1995). This chapter seeks to develop a model of oyster profitability based on shell strength and soft tissue reward. In chapter two, that model will be tested through feeding trials with a common oyster predator.
The main focus of this chapter was to determine how boring sponge alters the value of an oyster as a prey item. Essentially, I wanted to know if infestation by boring sponge changes an oyster’s reward to cost ratio. To evaluate this, a first requisite was to quantify the reward, or soft tissue in infested and healthy oysters. This was done using Condition Index. The next step was to quantify the force required to access the soft tissue, or the cost to a predator. This was done using an Instron compression testing device to measure the crushing strength of oyster shells. Since this is a new way of measuring the strength of bivalve shells, the methodology will be discussed and critiqued.
Oysters are relatively amorphous bivalves that do not conform to a single shape.
11
subtidal oysters and thin, pointy intertidal oysters. Therefore I also wanted to examine how site, local salinity, and individual morphology may interact with boring sponge infestation to impact CI or shell strength. Therefore I sampled oysters from Bogue, Back, Core, and Pamlico Sounds to obtain a more comprehensive understanding of the effects of Clionids.
Materials & Methods
To determine how boring sponge effects the reward to cost ratio of an oyster, I first examined reward level. To do this, I calculated condition index for oysters (n=413) from 29 sites. I measured length (mm), width (mm) and sponge growth (mm) from the umbo, since this is where infestation usually begins. I also measured wet mass (g) of whole oysters, volume (mL) of whole oysters and of shucked shells, and dry tissue mass (g) for oysters from several estuaries in Bogue, Back, Core, and Pamlico Sounds (Figure 1). For each site, a sample of ~20 oysters was collected and then frozen before being analyzed. To calculate whole oyster volume, I used a device that measured water displacement with a reduced meniscus. Oysters were shucked and shells and tissue were dried at 60oC for 3 days. Shells were then bleached and volume was measured again.
Larger samples were then collected from two sites, North River and New River to reduce spatial variability. In North River, oysters (n=203) were collected in late 2012 and early 2013 from cultch planting sites south of the North River Bridge, at 34.78285o, -76.60758o and
12
each oyster, similar to the first multi-site sample. After mechanical testing, the tissue from each New River test oyster was removed and dried at 60oC for 3 days then weighed, and the volume of the remaining shell material was measured. I did not calculate CI for the targeted North River sample.
To quantify shell integrity, a proxy for the cost to a predator, I measured shell density, thickness index, and compressive strength. Density was calculated as mass divided by volume for the shell alone. Thickness index was calculated as the shell volume divided by the internal cavity volume. Compressive strength was used to mimic the crushing motion of an oyster
predator, such as stone crabs. An Instron LRX compression tester was used to measure force (N) required to break shells. This machine was used in two different ways, explained below, to compare methods and work towards a better understanding of measuring shell strength.
13
defined as the load in Newtons applied that caused failure of the shell. Maximum deformation is defined as the distance the arm traveled downward before failure occurred. Linear regressions were constructed using the compression data, with load in Newtons on the x-axis and arm extension in millimeters on the y-axis and stiffness was estimated as the slope of the curve just prior to shell failure.
When possible, North Carolina Division of Marine Fisheries Shellfish Sanitation data on salinity were used to interpret differences among sites in oyster condition and shell morphology. These data were collected roughly every two months and I calculated an average value for the 12 months on record prior to collection, as well as a minimum and maximum for each site. Only 12 of the 29 sites were located close to a Shellfish Sanitation site, and therefore my analyses were limited to these locations. For the Neuse River, a sampling site from the Neuse River Estuary Modeling and Monitoring Program (http://www.unc.edu/ims/neuse/modmon/) program was used.
Distributions of independent variables including oyster size and infestation level were used to determine natural break points at which the data could be portioned for analyses. Subsequently, data were divided into categories based on oyster length (mm), whole oyster wet mass (g), and sponge infestation (%). Two-way ANOVAs were run using sponge category, site, length category and/or mass category, along with each dependent variable in JMP 10.0 (SAS Institute Inc.)
Results
Condition Index
14
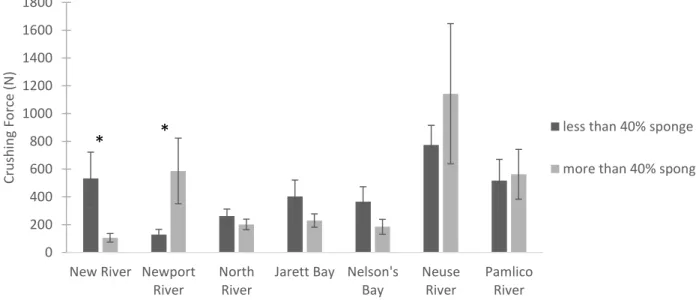
was analyzed individually, sponge infestation significantly reduced CI in Pamlico River and New River (Figure 1.4). In the Pamlico River, sponge and mass also had a significant interaction (p=0.049). In the Neuse and North River sites, heavily infested oysters had a slightly higher CI then uninfested oysters, but the difference was not significant. Examining condition index across sites, Pamlico River had the highest average value, 9.05 ± 2.67 g/mL*100, while the North River had the lowest, 5.97 ± 2.05 g/mL*100 (mean ± 1 SD).
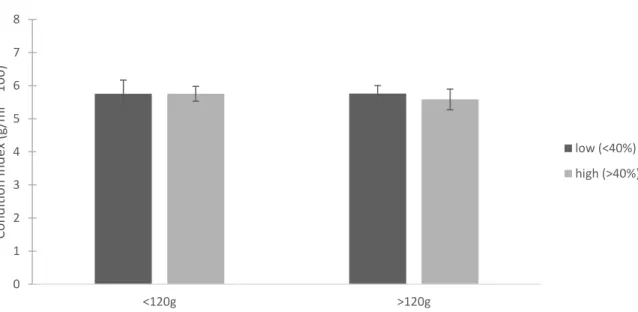
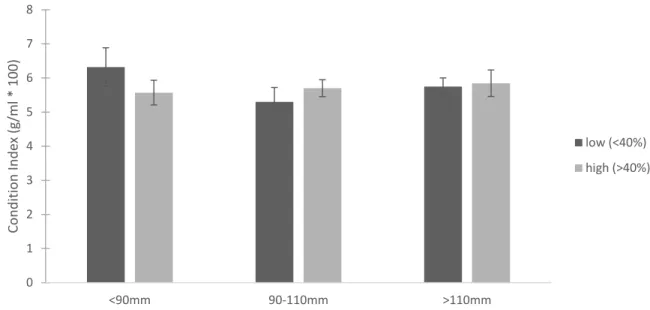
For the targeted New River sample, oysters with less than 40% sponge infestation had an average condition index of 5.76 ± 1.88 g/mL*100 and oysters with more than 40% infestation had an average of 5.69 ± 1.59 g/mL*100 (mean ± 1 SD). CI did not vary significantly with sponge infestation, mass (Figure 1.5), or length (Figure 1.6) (mass p=0.783, sponge p=0.772, mass*sponge p=0.770; length p=0.443, sponge p=0.787, length*sponge p=0.278). Summary statistics for the targeted New River sample are in Table 1.1.
Shell Integrity
Site and sponge had a significant interaction on thickness index in the multi-site survey (site p<0.001, sponge p<0.001, site*sponge p=0.008). Sponge infestation significantly increased thickness index for oysters from Pamlico River (p=0.047), North River (p=0.003), and Neuse River (p=0.009) (Figure 1.7). Mass and site also had a significant interaction (site p<0.001, mass p<0.001, site*mass p=0.007). Mass also had a significant impact on thickness index for oysters from North River (p<0.001).
15
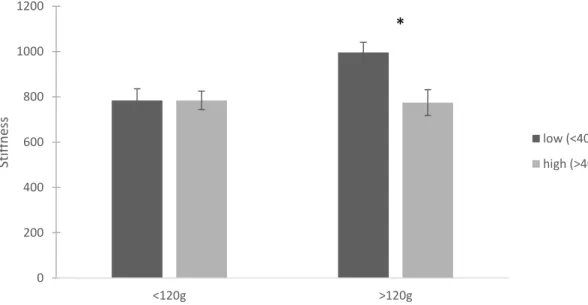
North River sample, sponge infestation had no significant effect on crushing force or stiffness. Crushing force significantly increased with mass (p=0.001) (Figure 1.9). Both mass and length impacted stiffness (p=0.006 and p=0.039, respectively) (Figures 1.10, 1.11). Summary statistics for the targeted North River sample are located in Table 1.2. There was a marginally significant interaction between sponge and mass on crushing force in the targeted New River sample (mass p<0.001, sponge p=0.004, mass*sponge p=0.055) (Figure 1.12). On average, oysters with low infestation required 1376 ± 630 N to crush and oysters with more than 40% infestation required 1046 ± 569 N to crush (mean ± 1 SD). Stiffness followed a similar pattern, but with a stronger interaction (mass p=0.043, sponge p=0.026, mass*sponge p=0.026) (Figure 1.13).
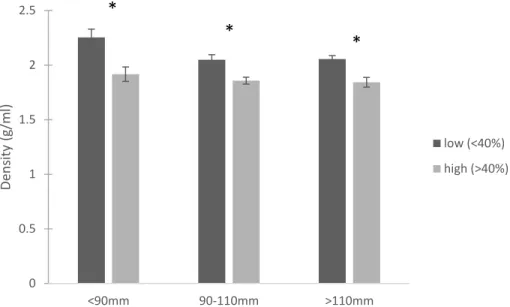
In the targeted New River sample, density was significantly impacted by length (p=0.012) and sponge (p<0.001) but there was no interaction (p=0.295) (Figure 1.14). On average, oysters with high sponge infestation (more than 40%) were 11% less dense than those with low infestation (less than 40%).
Reward/Effort Ratio
In the multi-site survey, site and sponge had a significant interaction on the reward/effort ratio (p=0.042). Oysters from Newport River with less than 40% sponge infestation yielded the highest reward/effort and heavily infested oysters from Neuse, the lowest (Figure 1.15). In the targeted New River sample, sponge and oyster length had a significant interaction on
16 Comparison of Methods
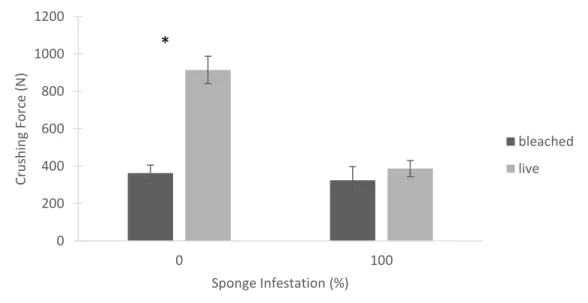
Live oysters withstood a greater amount of force before breaking compared to dried, bleached shells, and this was especially pronounced for oysters from New River (Figure 1.17). There was a significant difference in force required for oysters with 0% infestation, with live oysters requiring more than 2.5 times the amount of force as bleached shells (Wilcoxon p<0.001). Stiffness was also varied between bleached shells and live oysters with no sponge infestation; bleached shells were on average 20% less stiff than live oysters (Wilcoxon p=0.003) (Figure 1.18). There was no significant difference in force or stiffness for shells with 100% infestation tested live or bleached.
Discussion
The amount of oyster soft tissue, as measured by CI, was not affected by sponge
infestation for most sites that I tested. In the multi-site survey, only the Pamlico and New River sites showed a difference in CI between infested and uninfested oysters. In most cases, sponge boreholes do not reach through the entire thickness of the shell into the internal cavity, so I did not expect CI to vary much between infestation levels. Interestingly, the larger sample taken from New River did not show a change in CI based on sponge infestation. Different sites were sampled when re-visiting the New River, so it is possible just a small distance up or down stream can change the impact of boring sponge on CI.
Looking at shell integrity, the bleached shells crushed from the multi-site survey did not appear to be impacted by sponge infestation. Rather, site and oyster wet mass were more important in determining the breaking force. This was a similar pattern to the North River
17
sponge infestation had a significant impact on force, stiffness, and density in the larger New River sample.
New River most closely followed our predictions regarding reward/effort ratio. Force and stiffness were significantly impacted by sponge and oyster wet mass, but CI did not vary with length, sponge, or mass. This led to a reward/effort ratio that was significantly impacted by length and sponge, with a significant interaction. Essentially, if an oyster’s shell is weakened by boring sponge, but the soft tissue reward remains unchanged, it should become a more ideal prey item. This was most pronounced for larger oysters, suggesting that sponge infestation may cause a shift in the size of oysters targeted by crabs and other predators. Larger oysters are likely to be older, and therefore have had more time for sponge infestation to perpetuate. A large oyster may exhibit a crushing force similar to a smaller oyster, but with a much greater soft tissue reward. However, this clear pattern was not recognized in all sites.
In the Neuse, Newport, and Pamlico Rivers a somewhat unexpected pattern was observed in reward/effort ratio. For these oysters, heavily infested individuals required more force to crack than those with less than 40% sponge infestation. This may be explained by a different sponge species acting in these estuaries. Non-celata sp. such as Cliona truitti are proportionally more abundant at less saline sites (Lindquist 2011). This species makes smaller bore holes and appears to be less aggressive than C. celata in eroding carbonate substrate. Mussels infested with
18
threats. When C. virginica were exposed to oyster drills Urosalpinx cinerea for two months, total wet weight and wet shell weight growth were significantly higher than oysters in a control
treatment (Lord & Whitlatch 2012). Conversely, oysters not exposed to U. cinerea had higher dorsal shell area growth, though not significantly so. This difference seen among treatments is most likely due to the switch to shell-thickening processes in the predator treatment from the perceived threat of U. cinerea. Lateral shell growth, as seen in the control oysters, increases the volume of the animal, and is indicated to be the typical summer growth pattern (Lord &
Whitlatch 2012). U. cinerea is a drilling predator, so the response it elicits in oysters may be similar to a response generated by boring sponge. However, no quantitative studies have examined shell thickening in response to boring sponge infestation. Polydora ciliata is a polychaete that infests bivalves in a manner very similar to C. celata, using both mechanical abrasion and chemical dissolution (Dorsett 1961, Haigler 1969). In mussels, P. ciliata infestation had a complicated relationship with shell strength. While infestation weakens shells, there is a large amount of variability at any given level of infestation (Kent 1981) These results suggest that Polydora burrows weaken shells by acting as fracture lines, but that some individual mussels may react to boring by secreting a nacreous blister over perforations (Korringa 1951). The large amounts of variability in my results could likely be caused by a similar mechanism in oysters.
19
force or stiffness. The main driver of changes seen was actually oyster mass. There were also vast differences between the New and North River samples. For example, the average force required to crush live North River oysters was 357N, while in New River the average was 1198N. North River samples came from areas where DMF had planted cultch over the last few years, but these sites historically (the past 120 years) were not areas where subtidal oyster reefs occurred naturally (Grave 1904). It is possible that a system already under stress may be more susceptible to boring sponge. North River has also been under extreme harvest pressure (N. Lindquist, pers comm). This may also inhibit successful restoration by removing healthy individuals from the population and diminishing larval supply. Such results suggest that locations will be differentially impacted by boring sponges.
Size, as measured by both length and mass, also had a large impact on other oyster characteristics. For instance, mass and sponge had a significant interaction on force and stiffness for both North River and New River. Perhaps this is more pronounced in oysters than in other bivalves since oysters are relatively amorphous. While mussels, clams, and scallops all tend to have a similar shape, oyster shape can be influenced by growth rate, salinity, and subtidal vs. intertidal reef location. In North River, when oysters were crushed live, large oysters over 135mm with more than 40% sponge infestation required the least amount of force to crush. Though not statistically significant, this trend could be due to the long, thin morphology of oysters from this area, which may have provided more leverage for the Instron arm. Another explanation is that larger oysters are older and have had more time to become severely infested and weakened by Clionids.
20
examine compressive force only test a small piece of the material in question, I chose not to do that with oysters. Using a complete valve, or in the case of the live samples, the complete animal, is more ecologically relevant. Furthermore, cutting out one piece of shell and setting it in resin would not have worked for heavily bored shells. It was difficult to cleanly cut a section of shell without it crumbling immediately. Setting an infested shell in resin would have artificially strengthened the shell if resin were able to seep into the bore-holes. Another decision had to be made regarding the arm used to crush shells. Previous studies on bivalve shell strength have used a small, needle-like tip to apply force. Dealing with a shell riddled with holes made this
undesirable, as the tip could come in contact with an intact section of the shell or “fall” into a bore-hole. To combat this issue, and in hope of making the results more ecologically relevant, a larger tip was used on the machine. The long, cylindrical bar used to apply force was meant to imitate the dactyl of a crab chelae. As mentioned, when testing the live oysters, any thin fragments of shell along the outer edge were trimmed away prior to force loading. These thin edges were likely to break first and give an artificial reading of overall shell strength.
Similar to Zuschin and Stanton (2001), oysters I tested exhibited a variety of break patterns. While they cite shell thickness as the primary predictor of bivalve shell strength, the authors also acknowledge that large amounts of variability probably reflect shell-multifunctionality. Like any organism, oysters must allocate limited resources to a multitude of functions, and shell strength and thickness may be a trade-off with length, reproductive output, and other processes.
I observed a large difference in the crushing force of bleached shells compared to live, submerged oysters. It is possible that live shell intact samples may have more flexibility before breaking, but it is more probable that using the whole animal meant the shell was more
21
had more exposed surface area for bleach to work on. Drying shells may make them brittle, and bleach may attack some proteins. Interestingly, Lombardi et al. (2013) did not find significant differences in force required to crack wet compared to dry shells. These authors performed compressive testing in a similar way, but always used both valves of the animal aligned to mimic a live oyster. Testing dry shells of various ages, C. virginica were shown to increase in
compressive force required with age. Oysters ages 1 and 4 years old required crushing force of approximately 1000N, while individuals ages 6 and 9 years old withstood forces over 3500N (Lombardi et al. 2013).
Understanding the interaction between boring sponges and mollusks may be increasingly important as climate change acts on marine life in the coming decades. Sea surface temperatures are expected to rise 2 to 4oC over the next century (McCarthy et al. 2001) and few studies have examined what this warming will do to sponges. At temperatures of 18, 25, 31, and 33oC, C. celata exhibits no losses of pigments, indicating a high threshold for thermal stress. In addition, boring sponge shows no significant losses of pigments at practical salinities of 22, 32, or 42 (Miller et al. 2010). Such adaptability could make C. celata highly competitive in a rapidly changing climate. Duckworth and Peterson (2013) sought to quantify the effects of C. celata on scallop Argopecten irradians shells in different temperature and pH regimes. Although mortality for explants of C. celata was higher in seawater of pH 7.8 than 8.1, sponges bored twice the number of papillar holes and removed two times more shell weight at the lower pH.
22
The clearest result gathered from this chapter is that oysters are highly variable in
23
24
Figure 1.2. Map showing the collection sites for the targeted North River sample, just south of North River Bridge.
25
Figure 1.4. Average Condition Index based on sponge infestation and site. Dark gray bars
represent oysters with less than 40% sponge infestation and light gray bars represent oysters with more than 40% sponge infestation. Error bars are 1 standard error. Asterisks denote sites where sponge infestation significantly affected CI. Sites connected by the same letters are not
statistically different.
Figure 1.5. Average Condition Index for the targeted New River sample based on oyster mass categories. Dark gray bars represent oysters with less than 40% sponge infestation and light gray bars represent oysters with more than 40% sponge infestation. Error bars are 1 standard error.
0 2 4 6 8 10 12
New River Newport River
North River
Jarrett Bay Nelson's Bay Neuse River Pamlico River Con d itio n In d ex (g/ m l * 100)
under 40% sponge
over 40% sponge
0 1 2 3 4 5 6 7 8 <120g >120g Con d itio n In d ex (g/ m l * 100) low (<40%) high (>40%)
AB AC
D BD
AC ABD
C
*
26
Figure 1.6. Average Condition Index for the targeted New River sample based on oyster length categories. Dark gray bars represent oysters with less than 40% sponge infestation and light gray bars represent oysters with more than 40% sponge infestation. Error bars are 1 standard error.
Table 1.1 Summary statistics for the targeted New River sample.
summary (avg ± SD) all
length 98.76 ± 16.9
width 49.5 ± 6.6
mass 114.3 ± 39.21
force 1198.1 ± 618.2
stiffness 834.7 ± 296
CI 5.7 ± 1.72
density 1.98 ± 0.26
reward/effort 0.0018 ± 0.00484
n 144
0 1 2 3 4 5 6 7 8
<90mm 90-110mm >110mm
Con
d
itio
n
In
d
ex
(g/
m
l *
100)
low (<40%)
27
Figure 1.7. Average thickness index based on site for the multi-site survey. Dark gray bars represent oysters with less than 40% sponge infestation and light gray bars represent oysters with more than 40% sponge infestation. Error bars are 1 standard error. Asterisks denote sites where sponge infestation significantly affected CI. Sites connected by the same letters are not
statistically different.
Figure 1.8. Average crushing force for a subset of oysters from the multi-site survey (n=168). Dark gray bars represent oysters with less than 40% sponge infestation and light gray bars represent oysters with more than 40% sponge infestation. Error bars are 1 standard error. Asterisks denote sites where sponge infestation significantly affected force.
0 0.5 1 1.5 2 2.5
New River Newport RiverNorth River Jarrett Bay Nelson's Bay Neuse River Pamlico River
Th ickn es s In d ex under 40% sponge over 40% sponge 0 200 400 600 800 1000 1200 1400 1600 1800
New River Newport River
North River
Jarett Bay Nelson's Bay Neuse River Pamlico River Crushin g
Force (N) less than 40% sponge
more than 40% sponge
A AB A BCD ABD
28
Figure 1.9. Average crushing force based on oyster mass for the targeted North River sample. Force required significantly increased with mass but was unchanged by sponge infestation. Dark gray bars represent oysters with less than 40% sponge infestation and light gray bars represent oysters with more than 40% sponge infestation. Error bars are 1 standard error.
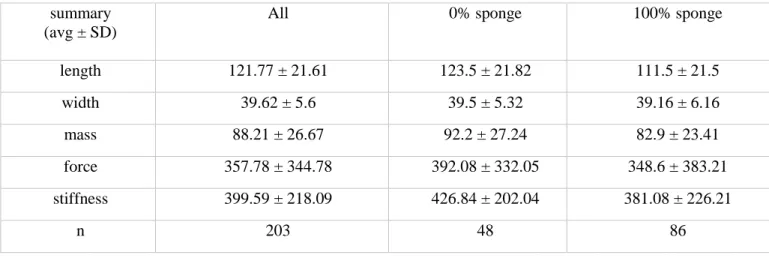
Table 1.2. Summary statistics for oysters from the targeted North River sample. summary
(avg ± SD)
All 0% sponge 100% sponge
length 121.77 ± 21.61 123.5 ± 21.82 111.5 ± 21.5
width 39.62 ± 5.6 39.5 ± 5.32 39.16 ± 6.16
mass 88.21 ± 26.67 92.2 ± 27.24 82.9 ± 23.41
force 357.78 ± 344.78 392.08 ± 332.05 348.6 ± 383.21
stiffness 399.59 ± 218.09 426.84 ± 202.04 381.08 ± 226.21
n 203 48 86
0 100 200 300 400 500 600 700
<70g 70-110g >110g
Crushin
g
Force
(N)
<40% sponge
29
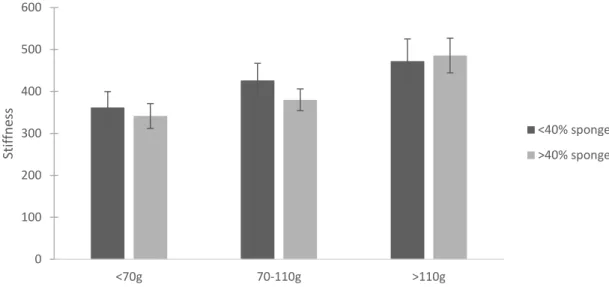
Figure 1.10. Average stiffness for oysters from the targeted North River sample based on oyster mass. Dark gray bars represent oysters with less than 40% sponge infestation and light gray bars represent oysters with more than 40% sponge infestation. Error bars are 1 standard error.
Figure 1.11. Average stiffness for oysters from the targeted North River sample based on oyster length. Dark gray bars represent oysters with less than 40% sponge infestation and light gray bars represent oysters with more than 40% sponge infestation. Error bars are 1 standard error.
0 100 200 300 400 500 600
<70g 70-110g >110g
Stif
fn
es
s
<40% sponge
>40% sponge
0 100 200 300 400 500 600
<115mm 115-135mm <135mm
Stif
fn
es
s
<40% sponge
30
Figure 1.12. Average force required to crush live oysters from the targeted New River sample, based on oyster mass. Dark gray bars represent oysters with less than 40% sponge infestation and light gray bars represent oysters with more than 40% sponge infestation. Error bars are 1
standard error. Asterisks denote significant differences based on sponge infestation.
Figure 1.13. Average stiffness for live oysters from the targeted New River sample, based on oyster mass. Dark gray bars represent oysters with less than 40% sponge infestation and light gray bars represent oysters with more than 40% sponge infestation. Error bars are 1 standard error. Asterisks denote significant differences based on sponge infestation.
31
Figure 1.14. Average density of oysters from the targeted New River sample based on oyster length. Dark gray bars represent oysters with less than 40% sponge infestation and light gray bars represent oysters with more than 40% sponge infestation. Error bars are 1 standard error. Asterisks denote significant differences within a length category.
Figure 1.15. Average reward/effort ratio of oysters from the multi-site survey. Dark gray bars represent oysters with less than 40% sponge infestation and light gray bars represent oysters with more than 40% sponge infestation. Error bars are 1 standard error. Asterisks denote sites where sponge infestation significantly impacted reward/effort.
0 0.5 1 1.5 2 2.5
<90mm 90-110mm >110mm
De n sity (g/ m l) low (<40%) high (>40%) 0 0.01 0.02 0.03 0.04 0.05 0.06 0.07
New River Newport River
North River
Jarett Bay Nelson's Bay Neuse River Pamlico River Re w ar d /e ff o rt (g/ N )
less than 40% sponge
more than 40% sponge *
*
32
Figure 1.16. Average reward/effort ratio for oysters from the targeted New River sample based on oyster length. Dark gray bars represent oysters with less than 40% sponge infestation and light gray bars represent oysters with more than 40% sponge infestation. Error bars are 1 standard error. Asterisks denote significant differences within a length category.
Figure 1.17. A comparison of the average force required to crush oysters when tested live or as bleached shells. Error bars are 1 standard error. Asterisks denote significant differences within an infestation category. 0 0.002 0.004 0.006 0.008 0.01 0.012
<90mm 90-110mm >110mm
Re w ar d /e ff o rt (g/ N ) low (<40%) high (>40%) 0 200 400 600 800 1000 1200 0 100 Crushin g Force (N)
Sponge Infestation (%)
bleached
live *
33
Figure 1.18. A comparison of the average stiffness of oysters when tested live or as bleached shells. Error bars are 1 standard error. Asterisks denote significant differences within an infestation category.
0 100 200 300 400 500 600 700 800
0 100
Stif
fn
es
s
Sponge Infestation (%)
bleached
34
CHAPTER 2: PREDATOR PREFERENCE AND CHANGES IN FEEDING RATES IN
THE PRESENCE OF CLIONA
Introduction
Generally, a predator’s feeding behavior can be predicted by optimal foraging theory. This idea suggests that an animal should maximize its net energy intake per unit of time foraging (MacArthur and Pianka 1966). Any particular foraging activity should be pursued as long as the resulting gain in time spent per unit of food exceeds the loss. This model oversimplifies the inherent complexity present in nature. Other key factors that must be considered when analyzing an animal’s foraging choices are risk aversion, reproductive state, where to forage if food is patchily distributed, and when to leave a particular patch of food (Charnov 1976). Emlen (1968) expanded on optimal foraging theory by stating that in cases where predators can evaluate the profitability of a prey item, food preferences should have evolved in such a way that the predator will choose those items which give it the most food value in return for its efforts. In most cases, this results in a predator feeding on small or medium sized prey. For example, in an analysis of 41 studies of crustaceans feeding on mollusk prey, Juanes (1992) found that crustacean predators often preferentially consumed prey towards the median-to-lower end of the size range offered.
35
consumed by predators (Hudson et al. 1992, Bakker et al. 1997). When amphipods are visibly altered from infection by Pomphorhynchus laevis, fish significantly eat more infected amphipods than uninfected. This pattern was tested by artificially coloring uninfected amphipods to mimic parasitized individuals, and results reinforced the notion that parasite color increases amphipod vulnerability to predation (Bakker et al. 1997). If boring sponge acts as a parasite and alters the predator-related mortality of oysters, there may be consequences for oyster populations and restoration efforts.
36
To test for changes in predator-related mortality of oysters infested with boring sponge, two feeding experiments were conducted. Stone crabs were chosen as the predator in feeding experiments because they are often found living in oyster reefs and are known to feed on bivalves. Firstly, I wanted to address whether or not the presence of boring sponge (physical or implied) change stone crab feeding rates. I also wanted to directly test crab preference for
infested versus uninfested oysters in stone crabs. Lastly, I sought to quantify changes in handling time based on infestation status of oyster prey.
Materials & Methods
Crab Acquisition and Holding
Atlantic stone crabs Menippe mercenaria (mean carapace width 98.5 ± 10.3mm) were collected from Bogue Sound, NC using baited standard and Florida-style crab pots and from hard structure in nearby marshes. All crabs were stored in water tables with a flow-through seawater system at IMS and fed oysters and ribbed mussels ad libitum. Pregnant females and injured (missing one cheliped or containing severely damaged claws/legs) crabs were not collected. Each crab was housed in an individual vexar cage and starved for 72 hours prior to experiments. Experimental Design
37
inhabiting the shells of non-living oysters. Treatment 4 was 20 uninfested oysters with the effluent of boring sponge infesting the shells of living oysters. Treatments 2, 3, and 4 all
introduced the boring sponge, but in different ways. While Treatment 2 directly exposed crabs to infested oysters, Treatments 3 and 4 aimed to test for a sponge-associated chemical cue that may affect crab feeding behavior. Treatment 3 examined the effluent from sponge while Treatment 4 sought to detect a cue from infested oysters. In all trials, a head tank supplied filtered seawater to each of six plastic aquaria at approximately a rate of 150ml per minute. In Treatments 3 and 4, the non-living shell and live infested oysters, respectively, were placed in this tank. All crabs were used only once. Oysters came from Calico Creek and North River and lengths were
measured prior to experiments. All remaining oysters were measured and recorded after the trial to determine which had been consumed.
The ambient water temperature during the foraging rate experiments ranged from 12.7 to 30oC. In order to adjust for differences in feeding rate based on temperature, the average number of oysters consumed per trial was plotted against the temperature during that trial. A curve was fitted to these data and used to calculate temperature adjusted feeding rates (Figure 2.1).
38
I also wanted to quantify the handling time for oysters free of boring sponge and those infested with sponge. The selection experiment was videoed for this purpose. Red lights were used to illuminate the mesocosms, as red light has been shown to not be visible to decapod crustaceans. Video cameras were mounted above the water tables containing the mesocosms and filmed for the duration of the experiments. After the experiments concluded, handling time was calculated from the videos. I defined handling time as when a crab first touched an oyster and ended after the crab left the oyster or remaining shell material for more than one minute. Statistical Analysis
The foraging rate experiment was analyzed with ANOVA, using treatment as the
independent variable. For the selection experiment, a nonparametric test, the sign test, was used. All statistics were conducted in JMP 10.0 (SAS Institute Inc.).
Results
The presence of boring sponge did not change crab feeding rates. Averaging the number of oysters eaten per trial across treatments, treatment 2 (10 uninfested oysters, 10 infested) had the highest average number, 15.2 oysters, with the smallest standard error. Treatment 4 (20 uninfested oysters with the effluent of boring sponge infesting living oysters) had the lowest number eaten, at just under 12 oysters per trial (Figure 2.2). There were no significant differences among treatments (ANOVA p=0.7).
After correcting for temperature, the average number of oysters eaten per trial was 27-42% lower for each treatment (Figure 2.3). All treatments were statistically equivalent (ANOVA p=0.9).
39
infested oyster, and in 30% crabs did not eat at all (Figure 2.4). The sign test was used to analyze the 50 trials in which crabs did feed. A p value of 0.16 was calculated, which was doubled to match the two-tailed nature of the experiment. Thus the probability of obtaining the observed result or a more extreme one if H0 was true is 0.32.
Handling time did not change with sponge infestation. Mean handling time for trials was 1026 ± 1501 s (mean ± SD), or approximately 17 minutes. Handling time significantly increased with oyster size, but was not affected by sponge infestation (ANCOVA, size p = 0.02, type p = 0.96, size*type p = 0.53).
Discussion
Significant prey preference for boring sponge-infested oysters was not displayed during my feeding experiments. There are several reasons why a pattern may not have emerged, including the size of oysters used, the size of stone crabs used, a lack of ecological relevance in crushing force, the mesocosm conditions, or the opportunistic nature of stone crabs. The size of oysters used in the mechanical testing was much larger than the size of oysters used in feeding experiments. Previous literature (summarized in Juanes 1992) has shown that most decapods prefer smaller sized prey. Specifically, Menippe adina (68.8-100.8mm in carapace width) preferred oysters between 10 and 40mm in shell length. But, the biggest changes in force and reward/effort ratios in the oysters analyzed in Chapter 1 were seen for the largest size classes of oysters. It is possible that with a high level of infestation by boring sponge, these larger oysters ‘act’ as small oysters, and contain the soft tissue reward of an uninfested oyster with a lower cost of access.
40
frequently used stone crabs over 100mm in width, sometimes as large as 120mm. Perhaps such large individuals do not need to be as selective when foraging and are capable of consuming most prey they come across. It is also possible that the difference in force required to crush a sponge-infested oyster compared to an uninfested oyster may not be ecologically relevant. Decapod crustaceans feeding on hard-shelled prey have evolved extremely strong claw muscles over time. In fact, crab claws appear to produce some of the strongest mechanical forces
recorded for any group of animals, with pinching/biting forces having been estimated to be as high as 800 N (Vermeij 1987, Blundon 1988). These exceptionally strong claw biting forces are produced by a single closer muscle acting on the first lever arm of the dactyl. This closer muscle produces some of the highest maximum muscle stresses (force per unit area of muscle) ever recorded for any muscle type in any animal group. Stone crab claw closer muscles are capable of producing forces of up to 2000 kN m2 (Blundon 1988). With such powerful claws, it’s possible that stone crabs do not have to consider breaking strength at all when selecting prey. Aronhime and Brown (2009) conducted feeding trials using mussels as prey and Callinectes sapidus and
Menippe adina as predators. They discovered that while blue crabs preferentially fed on smaller mussels, stone crabs (mean carapace width 94.5 ± 3.5 mm) were not size selective.
41
level fluctuations and tides. Food searching activity in decapods is often more extensive during flood tides (Hunter & Naylor 1993, Hughes & Seed 1981).
Finally, the mechanisms of crab foraging and prey selection still remain largely unknown. While some studies suggest that decapods must focus on smaller sized prey in order to avoid cheliped damage, there is still uncertainty. In some instances, stone crabs prefer smaller oysters and smaller oyster drills, but this is likely not active choice (Brown & Haight 1992). Instead, this may be passive selection due to increasing mechanical difficulty when faced with larger prey. In an experiment using blue crabs, Hughes and Seed (1995) found no evidence of size selection. They determined that crabs chose mussel prey based on the ease of removing individual mussels from the substrate. The authors surmised that whether foraging in tactile or visual mode, crabs utilize an opportunistic strategy while responding to the strongest stimuli. Stone crabs may also be unique among crusher crabs. Vermeij (1977) suggests that predators are most powerful at a given size in the Indo-West-Pacific and least powerful in the temperate zones, due to metabolic limits and longer periods of coevolution with prey species. However, the genus Menippe
represents an exception to this pattern, as the relatively largest claws are possessed by two Atlantic species, and the smallest claws are found in M. rumphii, an Indo-West-Pacific xanthid. Such a geographic distribution of claw size in Menippe is hard to explain given the reasoning for other crabs (Vermeij 1977).
42
of boring sponge present in the head tank was not enough to elicit a response, or that stone crabs are simply not strongly stimulated by C. celata effluent. If in fact stone crabs forage mainly using tactile clues, the scent of C. celata infested oysters may not register as a feeding cue. More likely, stone crabs are feeding opportunistically and not responding strongly to any cues. A similar species, the Chilean stone crab Homalaspis plana, attempted to consume every prey it contacted in laboratory trials. This opportunistic behavior suggests that factors beyond
consumption time must be considered in measurement of prey values in regard to the energy maximization hypothesis (Morales & Antezana 1983). Overall, it seems that stone crabs are opportunistic predators that do not exhibit highly selective foraging behavior. Size does not seem to be an accurate indicator of vulnerability to stone crab predation (Powell & Gunter 1968). Perhaps boring sponge is not either; as evidenced by Guida (1976), Cliona spp. is not
unpalatable to an array of marine invertebrates. It is unlikely that the sponge itself deterred crabs from feeding on infested oysters.
Handling time also did not change with sponge infestation. Gunter (1955) acknowledged that stone crabs are strong, voracious predators of adult oysters. He also saw that even after some oysters were eaten, stone crabs continued to crack the shell into smaller pieces in order to obtain the worms and boring clams in the shells. The videos recorded of stone crabs feeding are
difficult to clearly see. I measured handling time as the point when a crab first touched an oyster to the point where it was left for more than 60 consecutive seconds. However, it is possible that the sponge infested oysters crumbled into more pieces than uninfested oysters and enticed the crabs to spend more time investigating the shells after the meat was gone. This could explain why the sponge infested oysters took slightly longer to consume. Also, other studies have
43
be the dry tissue mass in grams divided by crushing force in Newtons. Prey value can also be thought of as calories gained versus calories expended or time spent handling prey.
The significance of this study will likely grow as stone crabs expand their natural range as a result of climate change. Stone crabs were first observed in North Carolina in the early 1900s, but recent observations suggest that they have become better established on certain oyster reefs in these waters (Rindone & Eggleston 2011). Laboratory experiments with adult male stone crabs revealed that they exhibit a continuous-time type II functional response when preying on eastern oysters (Rindone & Eggleston 2011), which may lead to localized extinctions of prey species at low prey densities.
Future work will focus on teasing out the size selectivity of stone crabs. Using larger oysters, such as those tested in Chapter 1, may reveal a stronger pattern between sponge
infestation and crab preference. Using a different predator may also produce different results. As mentioned, stone crabs are capable of extremely high force production. Repeating the
44
Figure 2.1 Average number of oysters eaten per trial in the foraging rate experiment as a function of ambient water temperature. The curve was used to adjust the raw data for temperature effects.
Figure 2.2 Average number of oysters eaten per trial in the foraging rate experiment before being corrected for temperature. Treatment codes are on the x-axis. There was no significant
differences among treatments. Error bars are 1 standard error.
y = -0.0651x2+ 2.9951x - 19.547
R² = 0.6615
0 2 4 6 8 10 12 14 16 18 20
10 15 20 25 30
av era ge e at en p er tria l
Temperature (degrees C)
0 2 4 6 8 10 12 14 16 18 Av era ge N u m b er eat en
45
Figure 2.3 Average number of oysters eaten per trial in the foraging rate experiment adjusted for temperature. Treatment codes are on the x-axis. There was no significant differences among treatments. Error bars are 1 standard error.
Figure 2.4 Results of the selection experiment. Dark gray bar represents crabs that chose the uninfested oyster first, light gray bar represents crabs that consumed the sponge infested oyster first. 0 2 4 6 8 10 12 Av era ge N u m b er Eat en
treatment 1 treatment 2 treatment 3 treatment 4
46
Figure 2.5. Handling time in seconds as a function of oyster size from the selection experiments. Darker gray dots represent crabs feeding on uninfested oysters, light gray dots show crabs feeding on infested oysters. Infestation status did not alter handling time.
0 500 1000 1500 2000 2500
20 30 40 50 60 70
H
an
d
ling
time
(s
)
Oyster size (mm)
no sponge
sponge
Linear (no sponge)
47
CONCLUSION
While the boring sponge Cliona sp. has been recognized and studied for close to two centuries, there remains work to be done on how it impacts bivalves and predator-prey
interactions. Through a broad, multi-site survey, I demonstrated that not all locations are equally affected by bioerosion. However, in most cases, oysters that are heavily infested with C. celata
require less force to break than uninfested oysters. A very clear pattern emerged from the targeted New River study, in which large, heavily infested oysters yielded the greatest reward/effort ratio. This result certainly suggests that as boring sponge infests oysters, larger oysters may become more vulnerable to predation. However, the feeding experiments conducted did not demonstrate a preference of stone crabs for oysters with sponge infestation. It is difficult to determine exactly why a preference was not seen in the feeding trials, but perhaps the size of oysters used or the size of stone crabs used were not appropriate to elicit a response. Also, stone crabs are opportunistic predators with the capability to produce very high forces. The
relationship between Clionids, oysters, and oyster predators must be studied further, as the interactions are not obvious. While a change in feeding preference or rate was not observed in my study, changes may be seen on a larger scale. It is also possible that other oyster predators, such as sheepshead, may exhibit a preference for sponge-infested prey.
48
REFERENCES
Alagarswami K, Chellam A (1976) On fouling and boring organisms and mortality of pearl oysters in the farm at Veppalodai, Gulf of Mannar. Indian J Fish 23:10-22
Aronhime BR, Brown KM (2009) The roles of profit and claw strength in determining mussel size selection by crabs. J Exp Mar Biol Ecol 379:28-33
Baird RH (1958) Measurement of condition in mussels and oysters. Journ Conseil 23: 249-257 Bakker TCM, Mazzi D, Zala S (1997) Parasite-induced changes in behavior and color make
Gammarus pulex more prone to fish predation. Ecology 78: 1098-1104
Barnes BB, Luckenbach MW, Kingsley-Smith PR (2010) Oyster reef community interactions: The effect of resident fauna on oyster (Crassostrea spp.) larval recruitment. JExp Mar Biol Ecol 391:169-177
Beck MW (1997) A test of the generality of the effects of shelter bottlenecks in four stone crab populations. Ecology 78: 2487-2503
Beck MW, Brumbaugh RD, Airoldi L, Carranza A, Coen LD, Crawford C, Defeo O, Edgar G J, Hancock B, Kay MC, Lenihan HS, Luckenbach, MW, Toropova CL, Zhang G, Guo X (2011) Oyster reefs at risk and recommendations for conservation, restoration, and management. BioScience 61: 107-116
Bergman KM, Elner RW, Risk MJ (1982) The influence of Polydora websteri borings on the strength of the shell of the sea scallop, Placopecten magellanicus. Can J Zool 60: 2551-2556
Blundon JA (1988) Morphology and muscle stress of chelae of temperate and tropical stone crabs Menippe mercenaria. J Zool 215: 663-673.
Bowerbank JS (1866) A monograph of the British sponges. Ray Soc, Hardwicke, London, 2, 388pp
Brown KM, Haight ES (1992) The foraging ecology of the Gulf of Mexico stone crab Menippe adina (Williams et Felder). J Exp Mar Biol Eco l160: 67-80
Buschbaum C, Buschbaum G, Schrey I, Thieltges DW (2007) Shell-boring polychaetes affect gastropod shell strength and crab predation. Mar Ecol Prog Ser329: 123-130
Carter HJ (1870) Note on the sponges Grayella, Osculina, and Cliona. Ann Mag Nat Hist 4:7383
49
Charnov EL (1976) Optimal foraging, the marginal value theorem. Theor Pop Biol 9:129-136
Che LM, Le Campion-Alsumard T, Boury-Esnault N, Payri C, Golubic S, Bézac C (1996) Biodegradation of shells of the black pearl oyster, Pinctada margaritifera var. cumingii, by microborers and sponges of French Polynesia. Mar Biol126:509-519
Chu FLE, Hale RC (1994) Relationship between pollution and susceptibility to infectious disease in the Eastern oyster, Crassostrea virginica Mar Envr Research 38:243-256
Coen LD, Luckenbach MW (2000). Developing success criteria and goals for evaluating oyster reef restoration: Ecological function or resource exploitation? Ecol Engineer 15:323-343 Coen LD, Luckenbach MW, and Breitburg DL (1999). The role of oyster reefs as essential fish
habitat: A review of current knowledge and some new perspectives. Ln Fish Habitat: Essential Fish Habitat and Rehabilitation, L.R.Benaka, Ed. Bethesda, MD: American Fisheries Society Symposium 22.
Coen LD, Brumbaugh RD, Bushek D, Grizzle R, Lukenbach MW, Posey MH, Powers SP, Tolley G (2007) Ecosystem services related to oyster restoration. Mar Ecol Prog Ser341: 303-307
Coleman FC, Williams SL (2002) Overexploiting marine ecosystem engineers: potential consequences for biodiversity. Trends Ecol Evol 17: 40-44.
Daume S, Fromont J, Hart A (2009). Management of bioeroding sponges in wild stocks of
Pinctada maxima in Western Australia. Final report to Fisheries Research and
Development Corporation on Project No. 2005/074. Fisheries Research Report No. 196. Department of Fisheries, Western Australia. 48p.
de Laubenfels MW (1947) Ecology of the Sponges of a Brackish Water Environment, at Beaufort, N.C. Ecol Monogr 17:31-46
Dorsett DA (1961) The behavior of Polydora ciliata (Johnst.) tube building and borrowing. J Mar Biol Assn UK 41:383-396
Duckworth AR, Peterson BJ (2013). Effects of seawater temperature and pH on the boring rates of the sponge Cliona celata in scallop shells. Mar Biol 160:27-35
Dunn RP, Eggleston DB, Lindquist N (2014) effects of substrate type on demographic rates of Eastern Oyster (Crassostrea virginica). J Shellfish Res 33:177-185
Ebersole EL, Kennedy VS (1995) Prey preferences of blue crabs Callinectes sapidus feeding on three bivalve species. Mar Ecol Prog Ser 118:167-177
50
maenas. J Anim Ecol 47:103-116
Emlen JM (1968) Optimal choice in animals. Am Nat 102:385-389
Gauthier JD, Soniat TM, Rogers JS (1990) A parasitological survey of oysters along salinity gradients in coastal Louisiana. J World Aquac Soc 21:105-115
Gerritsen J, Holland AF, Irvine DE (1994) Suspension-feeding bivalves and the fate of primary production: an estuarine model applied to Chesapeake. Estuaries 17:403-416
Gunter G (1955) Mortality of oysters and abundance of certain associates as related to salinity. Ecology 36: 601-605
Grabowski JH, Hughes AR, Kimbro DL, Dolan MA (2005). How habitat setting influences restored oyster reef communities. Ecology 86:1926-1935.
Grabowski JH, Peterson CH (2007) Restoring oyster reefs to recover ecosystem services. In: Cuddington K, Byers JE, Wilson WG, Hastings A (eds) Ecosystem engineers: concepts, theory, and applications. Elsevier-Academic Press, Amsterdam, p 281-298
Grant RE (1826) Notice of a new zoophyte (Cliona celata, Gr.) from the Firth of Forth. Edinburgh New Phil J 1:78–81
Grave C (1904) Investigations for the promotion of the oyster industry in North Carolina. In: U.S. Fish Commission report for 1903. Government Printing Office, Washington, DC p 247-341
Guida VG (1976) Sponge predation in the oyster reef community as demonstrated with Cliona celata Grant. J Exp Mar Biol Ecol 25: 109-122
Haigler SA (1969) Boring mechanism of Polydora websteri inhabiting Crassostrea virginica. Am Zool 9:821-828
Hancock A (1849) On the excavating powers of certain sponges belonging to the genus Cliona; with descriptions of several new species, and an allied generic form. Ann Mag Nat Hist Ser 2:321-348
Hancock A (1867) Note on the excavating sponges; with descriptions of four new species. Ann. Mag Nat Hist Ser 3:229-242
Hancock DA (1969) Oyster pests and their control. Laboratory leaflet No. 19, Ministry of Agriculture, Fisheries, and Food; Essex, UK
51
Holmes JC, Bethel WM (1972) Modification of intermediate host behavior by parasites. Zool J Linnean Soc 51:123-149
Hopkins AE (1949) Determination of condition of oysters. Science110:567-568.
Hopkins SH (1962) Distribution of Species of Cliona (Boring Sponge) on the Eastern Shore of Virginia in Relation to Salinity. Chesap Sci3:121-124
Hudson PJ, Dobson AP, Newborn D (1992) Do parasites make prey vulnerable to predation? Red grouse and parasites. J Animal Ecol 61: 681-692
Hughes RN, Seed R (1981) Size selection of mussels by the blue crab Callinectes sapidus: Energy maximizer or time minimizer? Mar Ecol Prog Ser 6:83-89
Hughes RN, Seed R (1995) Behavioral mechanisms of prey selection in crabs. J Exp Mar Biol Ecol 193:225-238
Hunter E, Naylor E (1993) Intertidal migration by the shore crab Carcinus maenas. Mar Ecol Prog Ser 101: 131-138
JMP®, Version 10.0. SAS Institute Inc., Cary, NC, 1989-2007
Juanes F (1992) Why do decapod crustaceans prefer small-sized molluscan prey? Mar Ecol Prog Ser 87:239-249
Kaehler S, McQuaid CD (1999) Lethal and sub-lethal effects of phototrophic endoliths attacking the shell of the intertidal mussel Perna perna. Mar Biol 135:497-503
Kennedy VS, Newell RIE, Eble A (1996) The eastern oyster, Crassostrea virginica. Maryland Sea Grant, College Park, MD
Kent RML (1981) The effect of Polydora ciliata on the shell strength of Mytilus edulis. Journ Conseil, 39:252-255
Kirby MX (2004) Fishing down the coast: Historical expansion and collapse of oyster fisheries along continental margins. Proc Natl Acad Sci 101:13096–13099
Korringa P (1951) The shell of Ostrea edulis as a habitat. Archs neerl Zool 10: 32-152
Lafferty KD, Morris AK (1996). Altered behavior of parasitized killifish increases susceptibility to predation by bird final hosts. Ecology 77:1390-1397
Leidy J (1889) The Boring-Sponge, Cliona. Proc Acad Nat Sci Phila 70-75