USING CONTEXT TO IMPROVE NETWORK-BASED EXPLOIT KIT DETECTION
Teryl Taylor
A dissertation submitted to the faculty of the University of North Carolina at Chapel Hill in partial fulfillment of the requirements for the degree of Doctor of Philosophy in the Department of Computer
Science.
Chapel Hill 2016
ABSTRACT
TERYL TAYLOR: Using Context to Improve Network-based Exploit Kit Detection (Under the direction of Fabian Monrose)
Today, our computers are routinely compromised while performing seemingly innocuous activities like reading articles on trusted websites (e.g., the NY Times). These compromises are perpetrated via complex interactions involving the advertising networks that monetize these sites. Web-based compromises such as exploit kits are similar to any other scam — the attacker wants to lure an unsuspecting client into a trap to steal private information, or resources – generating 10s of millions of dollars annually. Exploit kits are web-based services specifically designed to capitalize on vulnerabilities in unsuspecting client computers in order to install malware without a user’s knowledge. Sadly, it only takes a single successful infection to ruin a user’s financial life, or lead to corporate breaches that result in millions of dollars of expense and loss of customer trust.
Exploit kits use a myriad of techniques to obfuscate each attack instance, making current network-based defenses such as signature-based network intrusion detection systems far less effective than in years past. Dynamic analysis or honeyclient analysis on these exploits plays a key role in identifying new attacks for signature generation, but provides no means of inspecting end-user traffic on the network to identify attacks in real time. As a result, defenses designed to stop such malfeasance often arrive too late or not at all resulting in high false positive and false negative (error) rates. In order to deal with these drawbacks, three new detection approaches are presented.
The technique is evaluated on 3,800 hours of web traffic on a large enterprise network, and results show that it reduces false positive rates by four orders of magnitude over current state-of-the-art approaches.
While utilizing structure can vastly improve detection rates over current approaches, it does not go far enough in helping defenders detect new, previously unseen attacks. As a result, a new framework that applies dynamic honeyclient analysis directly on network traffic at scale is proposed. The framework captures and stores a configurable window of reassembled HTTP objects network wide, uses lightweight content rendering to establish the chain of requests leading up to a suspicious event, then serves the initial response content back to the honeyclient in an isolated network. The framework is evaluated on a diverse collection of exploit kits as they evolve over a 1 year period. The empirical evaluation suggests that the approach offers significant operational value, and a single honeyclient can support a campus deployment of thousands of users.
While the above approaches attempt to detect exploit kits before they have a chance to infect the client, they cannot protect a client that has already been infected. The final technique detects signs of post infection behavior by intrusions that abuses the domain name system (DNS) to make contact with an attacker. Contemporary detection approaches utilize the structure of a domain name and require hundreds of DNS messages to detect such malware. As a result, these detection mechanisms cannot detect malware in a timely manner and are susceptible to high error rates. The final technique, based on sequential hypothesis testing, uses the DNS message patterns of a subset of DNS traffic to detect malware in as little as four DNS messages, and with orders of magnitude reduction in error rates.
ACKNOWLEDGEMENTS
I was supported by so many different people during my time at the University of North Carolina at Chapel Hill. First, I would not be here if it was not for John McHugh who encouraged me to pursue a Ph.D, and was there for many fruitful discussions. I also must express my gratitude to my advisor, Fabian Monrose, for his mentorship through all steps of this program. He learned my weaknesses and used them to make me a better researcher. He was there every step of the way to ensure that I was successful.
I also want to acknowledge my committee members, Ting Wang, Alex Berg, and Jay Aikat, for providing excellent discussion, proof reading, and support. There were also many hours spent with my fellow doctoral students, Srinivas Krishnan, Kevin Snow, and Andrew White, and collaborators, Xin Hu, Marc Ph. Stoecklin, Jiyong Jang, Reiner Sailer, Douglas Schales, Jan Werner, Nathan Otterness, and Scott Coull. UNC Information Technology staff members Murray Anderegg and Bil Hayes were always there when I had a technical problem, and Stan Waddell, Alex Everett, Jim Gogan, and Danny Shue graciously provided data to make this dissertation possible.
I could not have done this research without the financial support of the National Science and Engineering Research Council of Canada (NSERC), the University of North Carolina at Chapel Hill, the National Science Foundation (NSF), the Department of Homeland Security, IBM Research and Cisco Systems.
PREFACE
TABLE OF CONTENTS
LIST OF TABLES . . . xii
LIST OF FIGURES . . . xiii
LIST OF ABBREVIATIONS . . . xv
LIST OF SYMBOLS . . . xvii
1 INTRODUCTION . . . 1
1.1 Detecting Exploit Kits via Subtree Similarity Search . . . 4
1.2 Detecting Exploit Kits via Context and Virtualization on the Wire . . . 4
1.3 Detecting Network Malfeasance via Sequential Hypothesis Testing . . . 5
1.4 Innovations . . . 5
2 BACKGROUND . . . 7
2.1 Exploit Kit Attack Model . . . 7
2.2 Detecting an Exploit Kit . . . 9
2.2.1 Characteristics of an Ideal Network-based Malfeasance Detector . . . 10
2.2.2 Operational Challenges in Network Defense . . . 11
2.3 Exploit Kits Evasion Techniques . . . 12
2.3.1 DNS and DGAs . . . 13
3 BACKGROUND . . . 18
3.1 Modelling HTTP Traffic as Trees . . . 18
3.2 Subtree Mining: A Comparison of Algorithms on Real World Datasets . . . 19
3.3 Subtree Mining Algorithms . . . 21
3.3.2 Review of Selected Algorithms . . . 25
3.4 Methodology . . . 29
3.5 Real World Datasets . . . 30
3.6 Synthetic Datasets . . . 32
3.6.1 Synthetic Tree Generator in Literature . . . 32
3.6.2 Custom Synthetic Tree Generators . . . 33
3.7 Evaluation . . . 36
3.7.1 Output Verification . . . 36
3.7.2 Conventional Subtree Mining Algorithms . . . 38
3.7.3 Closed Subtree Mining Algorithms . . . 46
3.8 Tree Edit Distance: An Alternative to Subtree Mining . . . 51
3.9 Final Thoughts . . . 52
4 DETECTING EXPLOIT KIT TRAFFIC USING SUBTREE SIMILARITY SEARCH . . . 54
4.1 Literature Review . . . 55
4.2 Approach . . . 57
4.2.1 On Building Trees . . . 59
4.2.2 On Building the Malware Index . . . 60
4.2.3 On Subtree Similarity Searches. . . 62
4.2.3.1 Node Level Similarity Search . . . 62
4.2.3.2 Structural Similarity Search . . . 64
4.3 Dataset and Training . . . 65
4.3.1 Implementation. . . 66
4.3.2 Building the Malware Index . . . 67
4.3.3 Establishing Ground Truth . . . 68
4.4 Finding the Needle in a Haystack . . . 68
4.4.1 Comparison with Snort . . . 69
4.4.3 Findings and Discussion . . . 74
4.5 Operational Deployment . . . 76
4.6 Limitations . . . 78
4.7 Discussion and Lessons Learned . . . 80
5 DETECTING EXPLOIT KIT TRAFFIC USING REPLAY . . . 82
5.1 Literature Review . . . 84
5.2 Approach . . . 87
5.2.1 Step¶: Semantic Content Caching . . . 88
5.2.2 Step·: Filtering and Triggering . . . 89
5.2.3 Step¸: Client and Server Impersonation . . . 91
5.2.4 Step¹: Honeyclient-based Detection . . . 94
5.2.5 Prototype Implementation . . . 95
5.3 Evaluation . . . 96
5.3.1 On Detection Performance . . . 96
5.3.2 On Live Traffic Analysis . . . 101
5.4 Case Study. . . 107
5.5 Limitations . . . 109
5.6 Discussion and Lessons Learned . . . 111
6 DETECTING BOTS USING SEQUENTIAL HYPOTHESIS TESTING . . . 113
6.1 Literature Review . . . 115
6.2 Collection Infrastructure . . . 116
6.3 Data Summary for Measurement Period I . . . 117
6.4 Classification based on Features of a Domain Name . . . 119
6.4.1 Shortcomings of Existing Methods . . . 123
6.5 Approach . . . 124
6.6 Evaluation - Measurement Period I . . . 126
6.6.2 Visualizing AGD Traffic . . . 134
6.6.3 Analysis of Live Traffic . . . 135
6.7 Data Summary and Evaluation for Measurement Period II . . . 137
6.7.1 Offline Analysis . . . 138
6.7.2 Online Analysis . . . 139
6.8 Limitations . . . 142
6.9 Discussion and Lessons Learned . . . 142
7 CONCLUSION AND FUTURE DIRECTIONS . . . 144
LIST OF TABLES
3.1 8,000 trees sampled from real-world datasets. . . 30
3.2 Common configs used in Zaki’s tree generator (Zaki, 2005). . . 33
3.3 Characteristics of synthetic datasets. . . 36
4.1 Summary of datasets. . . 66
4.2 Testing and training sets. . . 67
4.3 Node-level thresholds computed by Algorithm 2. . . 67
4.4 Comparison (weighted) to Snort signatures. . . 72
4.5 Comparison (weighted) to binary URL classifier. . . 72
4.6 False positives when using different levels of structural and node similarity. . . 75
4.7 Live comparison to Snort signatures. . . 77
5.1 Number of instances of various file types seen on campus on a busy school day. . . 96
5.2 Detection results for honeyclientH1on offline dataset. . . 97
5.3 Detection results for honeyclientH2on offline dataset. . . 98
5.4 Chaining algorithm match rate. . . 105
5.5 List of exploits injected into the campus network and detected by the framework. . . 106
6.1 DNS traffic stats for three days in March 2012. . . 118
6.2 Summary of bot samples used in the compiled blacklist. . . 118
6.3 Results of the KL classifier for Mar.19, 2012. . . 122
6.4 Accuracy ofk-fold cross-validation while varying window sizes. . . 130
6.5 AGDs that clustered by domain length. . . 135
6.6 DNS traffic stats for seven days in October 2015. . . 138
LIST OF FIGURES
1.1 A typical process to exploit a victim’s machine. . . 2
2.1 The four phases of an exploit kit infection. . . 8
2.2 DNS resolution process. . . 14
2.3 Malware contacting an attacker’s command-and-control server using a DGA . . . 17
3.1 Website modeled as tree-like structure. . . 19
3.2 Types of subtrees. . . 22
3.3 Subtree blanket example. . . 27
3.4 CDF of the number of unique labels per tree depth for all datasets. . . 31
3.5 The number of frequent nodes per threshold (0.0001, 0.001, 0.01, 0.05). . . 32
3.6 Maximum fanout/depth characteristics of real and synthetic datasets. . . 34
3.7 A tree with duplicate labels. . . 39
3.8 Graphs for real datasets. . . 40
3.9 Graphs for real datasets continued. . . 41
3.10 Graphs for synthetic datasets. . . 42
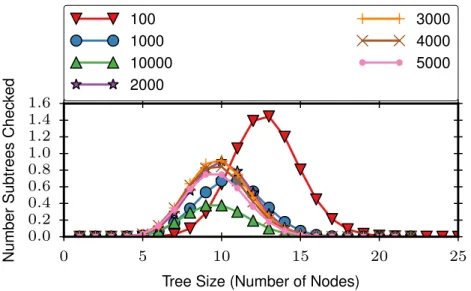
3.11 Number of subtrees checked per tree size for PREFIXISPANonSlabels . . . 43
3.12 Graphs for synthetic datasets. . . 44
3.13 Pruned and checked trees by size for closed algorithms. . . 48
3.14 Number of trees checked by size for closed algorithms. . . 49
4.1 High level overview of the search-based malware system. . . 58
4.2 Ordering HTTP flows for web session tree building. . . 59
4.3 The labeled tree generated from Figure 4.2. . . 60
4.4 The components of a URL for feature extraction. . . 61
4.5 Example similarity search on malware index. . . 62
4.7 The CDF of tree similarity scores for malicious subtrees. . . 76
4.8 Runtime performance of tree-based malware search. . . 78
5.1 Overall workflow of enabling an on-the-wire honeyclient. . . 87
5.2 Analysis of the 177 exploits on VirusTotal. . . 100
5.3 Number of unique Flash files seen on the campus network. . . 102
5.4 CPU and memory statistics for the semantic cache and trigger module. . . 103
5.5 Two-level cache statistics. . . 104
5.6 Elapsed time between Flash to Flash file launches. . . 106
5.7 JavaScript snippet from Angler Exploit Kit. . . 109
6.1 DNS Monitoring Infrastructure . . . 117
6.2 CDF of domain name lengths for benign domains . . . 119
6.3 CDF of lengths for botnet-related domains . . . 120
6.4 ROC Curves for Jaccard Index, Edit Distance and KL Divergence. . . 122
6.5 High-level overview of the workflow. . . 124
6.6 NX zone counts for benign and malicious clients. . . 128
6.7 Error estimation for k-fold cross-validation of varying window sizes. . . 129
6.8 Classification time after first unique NX response. . . 131
6.9 Time between classification and rendezvous. . . 132
6.10 ROC curve for edit distance using NX responses. . . 133
6.11 AGD clusters generated via hierarchical clustering. . . 134
6.12 NX zone counts for benign and malicious clients for October 1-7, 2015. . . 138
LIST OF ABBREVIATIONS
AGD Algorithmically Generated Domain name API Application Program Interface
CAS Compare And Swap
CDF Cumulative Distribution Function CDN Content Distribution Network CPU Central Processing Unit
DGA Domain-name Generation Algorithm DHCP Dynamic Host Configuration Protocol
DNS Domain Name System
DOM Document Object Model
EXE EXEcutable
FN False Negative
FP False Positive
FQDN Fully Qualified Domain Name
GB GigaByte
HTTP HyperText Transfer Protocol HTTPS HyperText Transfer Protocol Secure IDS Intrusion Detection System
IP Internet Protocol
JI Jaccard Index
LRU Least Recently Used
MX Mail eXchange
NIDS Network Intrusion Detection System
NX Non-eXistent
P2P Peer-to-Peer
PEB Process Environment Block
PTR PoinTeR
SSL Secure Sockets Layer
TCP Transmission Control Protocol
TLD Top Level Domain
TP True Positive
TRW Threshold Random Walk
TTL Time To Live
UDP User Datagram Protocol
URL Uniform Resource Locator
VM Virtual Machine
LIST OF SYMBOLS
Bt A blanket oft— i.e., the set of all supertrees oftthat have one more node thant
D A database of trees
E A set of edges nodes
L A labeling function mapping a tree node to its label Σ An alphabet of tree labels
S A Subtree
T A labeled tree
vx Tree nodex
V A set of tree nodes
CHAPTER 1: INTRODUCTION
Today, our computers are routinely compromised while performing seemingly innocuous activities like reading articles on trusted websites (Zarras et al., 2014) (e.g., the NY Times). These compromises are perpetrated via complex interactions involving the advertising networks that monetize these sites. Since crime typically follows the money, it is not too surprising then that cyber criminals have turned their attention to exploiting advertising networks as a way to reach wider audiences. In 2012 alone, web-based advertising generated revenues of over $36 billion (PWC, 2013), and its wide-spread reach makes it an excellent target for fraudsters. Furthermore, the players in the online advertising industry — publishers (who display ads), advertising networks (who deliver ads), and advertisers (who create content) — offer a multitude of vantage points for attackers to leverage, and these compromises can go unnoticed for extended periods. A well known example is the widely publicized case involving advertising networks from Google and Microsoft that were tricked into displaying malicious content by attackers posing as legitimate advertisers (Lemos, 2010). Such abuses are not isolated incidents and so-calledmalvertisinghas plagued many popular websites (Raywood, 2012), exploited mobile devices (Schwartz, 2013), and has even been utilized as vessels for botnet activ-ity (Clark, 2013). These exploits are delivered over HTTP, and detecting and defending against such attacks require accurate and efficient analytical techniques to help network operators better understand the attacks being perpetrated on their networks.
According to Grier et al. (2012); De Maio et al. (2014), approximately 40% of these web-based attacks are launched by exploit kits, which are web services specifically designed to deliver malicious payloads (e.g., bots) to unsuspecting client machines. Exploit kits, such as Fiesta and Blackhole represent an entire software-as-a-service subindustry worth millions of dollars. For example, Cisco estimates that the popular exploit kit Angler is responsible for over 90,000 infection attempts a day and generates revenues of $60 million annually from ransomware alone (Biasini et al., 2015).
(e.g., an advertising link) with an injectediframethat in turn directs (step Ë) the user’s browser to an invisible exploit kit landing page. At that point, information about the victim’s system is passed along to the attacker’s server (stepÌ), which is then used to select a file such as Flash or JAVA, that can exploit the system configuration. The downloaded file exploits a vulnerability on the system that allows the attacker to install a malicious binary (stepÍ) or otherwise control the victim’s machine.
User visits website
www.news.com
Compromised website redirects to exploit landing page
Target client vulnerabilities Install malicious
software
!
"
#
$
Figure 1.1: A typical process to exploit a victim’s machine.
The malicious binary installed on the client’s computer is typically designed to steal sensitive data or utilize system resources to perform some revenue generating tasks such as spamming, click fraud, ransoming data, or mining bitcoins. These binaries may enroll the host machine (called a bot) in a larger pool of infected machines to form a “botnet”. A botnet is controlled by one or more command-and-control servers that relay commands and binary updates to members of the pool, allowing botnet owners to reap the financial rewards of the combined efforts of the bots. In order to maintain contact with the command-and-control server, the bot has some dynamic mechanism for learning the server’s IP address. One of the key ways in which this is done is through abusing the domain name system (DNS) by using a domain name generation algorithm (DGA) to generate thousands of random domain names. The bot queries each domain name looking for a valid address for its command-and-control server. Only one of the domain names is registered and those queries that do not elicit an IP address return a non-existent or NX response.
edge for signature matches or known malicious domain names. Network-based detection approaches are popular because network operators often do not have control over the devices that join their network, and malware can disable critical client-side protections such as anti-virus, making detection difficult. Attackers thwart these defenses by rapidly changing their environment through 1.) using polymorphic techniques on exploit payloads, 2.) frequently moving exploit kits to new servers, 3.) constantly changing domain names, and 4.) morphing traffic to bypass signatures in an effort look “normal” in the context of surrounding traffic. Furthermore, current network-based detection research has ignored the operational impact proposed solutions have on a security analyst’s ability to effectively do their job. Current approaches have high false positive and false negative rates that place a heavy burden on the security analyst who must vet each false positive, and clean up the potential mess of a missed detection. Indeed, even the signatures heavily used by commercial products arrive too late to be effective.
This is not to say that current approaches are not useful. Signatures are a key cog in defending our networks and will not be replaced any time soon; however, more research needs to be done to address their limitations. In this work, I describe the characteristics of an ideal network-based exploit detector and explore the key operational drawbacks of current state-of-the-art approaches that cause them to fall short of the ideal case — i.e., high error rates, timeliness of discovery, lack of necessary and sufficient features, and inability to detect new previously unseen attacks. I then propose new novel detections techniques to help reduce the gap between the ideal case and current conditions. The techniques rely on utilizing structural interactions inherent in both HTTP and DNS traffic in order to detect both exploit kits and their corresponding bots.
The web structure of HTTP traffic is an important feature for detecting exploit kits because the structure encodes the inherent process outlined in Figure 1.1 that is not inherent in benign traffic, thus reducing misclassification rates. Exploit kits are also out-of-the-box solutions with infrastructures of hundreds of machines (Biasini et al., 2015). As a result, it is difficult for the attacker to change the structure for each exploit kit instance, and structure stays relatively constant across instances. Finally, attackers actually enforce a web structure by spreading an exploit across the multiple web files that are downloaded by the client during infection. This is done so that the defender cannot simply analyze an exploitable file in isolation for detection, but must analyze all web files at once.
I hypothesize that by modelling the HTTP traffic associated with the exploitation process as a tree
structure, one can provide enough context related to web-based attacks, in order to reduce the false positive
context and utilizing virtualization, one can reduce false positive rates and detect previously unseen attacks
as they occur. Finally, by leveraging the contextual patterns of NX DNS traffic, one can detect bots —
that abuse the domain name service by using domain generated algorithms — before they contact their
command-and-control server using a single computer on a large enterprise network.
To support this assertion, the dissertation first motivates the problem by discussing the exploit kit attack model, and then proposes three novel network-based techniques to detect such exploits. In each case, I demonstrate the effectiveness of the technique empirically using large-scale real-world network datasets, and compare outcomes with existing approaches. The techniques are outlined below.
1.1 Detecting Exploit Kits via Subtree Similarity Search
One of the key problems with current network-based detection techniques is that they have high false positive and false negative rates (i.e, error rates). In Chapter 4, I propose a new approach for detecting exploit kits by leveraging the inherent structural patterns in HTTP traffic to classify exploit kit instances. The key insight is that an exploit kit leads the browser to download payloads using multiple requests from malicious servers. These interactions are captured in a “tree-like” form, and using a scalable index of malware samples, the detection process is modeled as a subtree similarity search problem. The approach is evaluated on 3800 hours of real-world traffic including over 4 billion flows and reduces false positive rates by four orders of magnitude over current state-of-the-art techniques with comparable true positive rates. I show that the approach can operate in near real-time, and is able to handle peak traffic levels on a large enterprise network — identifying 28 new exploit kit instances during the analysis period.
1.2 Detecting Exploit Kits via Context and Virtualization on the Wire
In Chapter 5, I introduce the design and implementation of a novel framework for adapting honeyclient-based systems to operate on-the-wire at scale. The framework captures and stores a configurable window of reassembled HTTP objects network-wide, uses lightweight content rendering to establish the chain of requests leading up to a suspicious event, then serves the initial response content back to the honeyclient system on an isolated network. The framework is evaluated by analyzing a diverse collection of web-based exploit kits as they evolve over a one year period. Case studies provide interesting insights into the behavior of these exploit kits. The empirical evaluations suggest that the approach offers significant operational value, and a single honeyclient server can readily support a campus deployment of thousands of users.
1.3 Detecting Network Malfeasance via Sequential Hypothesis Testing
Once the attacker has successfully dropped a malicious binary on a client machine, there are relatively few network-level clues available for the defender. However, the domain name system plays a vital role in the dependability and security of modern network and can act as a bellweather to detect such activities. Attackers have turned their attention to the use of algorithmically generated domain names (AGDs) in an effort to circumvent network defenses; however, because such domain names are increasingly being used in benign applications, this transition has significant implications for techniques that classify AGDs based solely on the format of a domain name. To highlight the challenges they face, Chapter 6 examines contemporary approaches and demonstrates their limitations. These shortcomings are addressed by proposing an online form of sequential hypothesis testing that classifies clients based solely on the non-existent (NX) responses they elicit. Evaluations on real-world data show that the technique outperforms existing approaches, and for the vast majority of cases, it can detect malware before they are able to successfully rendezvous with their command- and-control servers.
1.4 Innovations
In summary this dissertation makes the following contributions:
I run four state-of-the-art subtree mining algorithms on 10 real life datasets and provide insight into their characteristics and bottlenecks.
2. Chapter 4 presents a new online technique for detecting exploit kits that uses the tree structure of HTTP traffic to reduce (by orders of magnitude) the false positive rates over existing online approaches. The approach also provides a novel solution to the subtree similarity search problem, whereby, each tree node represents a high dimensional feature space. A version of this work appeared in:
• Taylor, T., Hu, X., Wang, T., Jang, J., Stoecklin, M., Monrose, F., and Sailer, R. (2016a). Detecting malicious exploit kits using tree-based similarity searches. InACM Conference on Data and Application Security and Privacy
3. Chapter 5 proposes a novel model for analyzing HTTP traffic scalably on a network using a honeyclient, as well as, a trigger and replay mechanism in a controlled environment. By utilizing a honeyclient, one can execute traffic from potentially malicious websites and monitor system-level changes to improve detection rates over the current state-of-the-art. A version of the work appeared in:
• Taylor, T., Snow, K. Z., Otterness, N., and Monrose, F. (2016b). Cache, trigger, impersonate: Enabling context-sensitive honeyclient analysis on-the-wire. InSymposium on Network and Distributed System Security
4. Chapter 6 presents a new algorithm for detecting client computers infected by bots that abuse DNS to connect to their command-and-control servers. Unlike current approaches, the algorithm can detect bots in near-realtime and, in 80% of cases, detect them before the bot contacts a command-and-control server. A version of this work appeared in:
CHAPTER 2: BACKGROUND
This chapter reviews the important concepts used throughout the remainder of this dissertation. It covers the exploit kit attack model, as well as a high-level overview of current techniques for detecting such web-based attacks both before and after infection. Finally, the chapter describes domain generation algorithms and how malware uses them to compromise defenses.
2.1 Exploit Kit Attack Model
An exploit kit is a web-based service (website) designed to infect machines that visit the site — usually without a client’s knowledge. Like any other service, an exploit kit generates money for its owner by acting as a malware delivery system. Attackers pay a monthly subscription fee with a guaranteed number of infections, and supply the malware payload to be installed on the infected machines. The malware, in turn, generates revenue for the attacker through some activity such as spamming or click jacking (Grier et al., 2012).
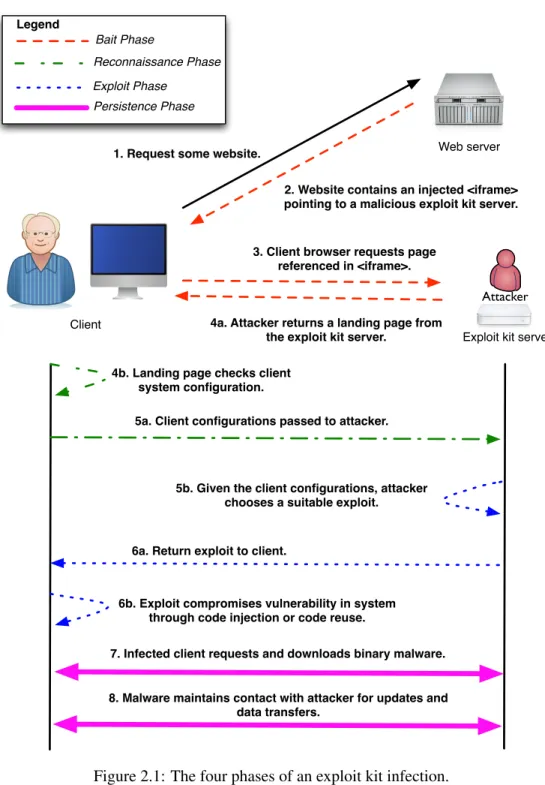
A web-based exploit kit attack is similar to any other scam — the attacker wants to lure an unsuspecting client into a trap to steal private information, or resources. Such attacks typically involve a four-step process as shown in Figure 2.1.
Web server
Attacker
Client
Exploit kit server Bait Phase
1. Request some website.
2. Website contains an injected <iframe> pointing to a malicious exploit kit server.
3. Client browser requests page referenced in <iframe>.
4a. Attacker returns a landing page from the exploit kit server.
4b. Landing page checks client system configuration.
Reconnaissance Phase
5a. Client configurations passed to attacker.
5b. Given the client configurations, attacker chooses a suitable exploit.
6a. Return exploit to client.
Exploit Phase
6b. Exploit compromises vulnerability in system through code injection or code reuse.
7. Infected client requests and downloads binary malware.
Persistence Phase
8. Malware maintains contact with attacker for updates and data transfers.
Legend
Once the user is lead to a malicious landing page, the page analyzes the client machine to determine what operating system, software, and plugins are installed (i.e., web browser, Flash version, etc.) during the
reconnaissance phase. An attacker can determine what software is installed on a client using JavaScript APIs that are already available in all commercial browsers.
With the list of installed software at hand, the exploit kit can choose from exploits that can capitalize on vulnerabilities (bugs) on the victim’s machine (exploit phase). The attacker’s goal is to leverage an exploit in order to download and run unrestricted arbitrary code on the client — effectively allowing the attacker free reign on the device. Exploits result from memory bugs in web browsers and plugins such as buffer overflows wherein application code allows for data to be written past the boundary of a memory buffer (Szekeres et al., 2013). Attackers leverage these bugs by either overwriting the browser’s program stack with their own code (calledcode injection(Aleph One, 1996)), or to redirect the logical program flow to instructions already in memory in order to provide alternative program logic (called return oriented programming (Buchanan et al., 2008)).
The attacker now has full control over the computer and seeks to maintain his foothold by downloading a set of malicious binaries in thepersistence phasethat will persist across system reboots. The binaries serve two purposes. They perform some task to generate revenue for the attacker including: spamming, key logging, click fraud, browser hijacking, bitcoin mining, and ransomware (Grier et al., 2012). The binaries also maintain contact with the attacker by communicating with a command-and-control server over some protocol such as peer-to-peer, DNS, or IRC (Zeidanloo and Manaf, 2009). Such communication allows an attacker to upgrade a host and rent infected clients to customers. The collective combination of infected client machines and command-and-control servers is called abotnetwith individual infected machines calledbots. The following section investigates the prevalent techniques used by network security analysts to detect that a network client has interacted with an exploit kit.
2.2 Detecting an Exploit Kit
not control. As such, users or attackers alike can add new devices to the network that do not have the proper client-side defenses or disable defenses on existing machines. While the network vantage does not give the analyst all the rich information available at the client, it does provide a global view and historical record of all host communication enabling detection of malicious behaviors as they occur. Finding malicious behaviors, such as a client’s interaction with an exploit kit, becomes a data mining problem of finding malicious patterns in a sea of data. The following subsection investigates the characteristics of an ideal network-based malware detector, and discusses at a high-level how current techniques fall short.
2.2.1 Characteristics of an Ideal Network-based Malfeasance Detector
There are four characteristics that are highly sought after in the design and implementation of network-based malware detectors. The first characteristic is that the detector can identify malicious network behavior as it is occurring in order to be able to stop or mitigate an infection before it can do more damage — called the timeliness requirement. The detector should also choose characteristics (features) that are necessary and sufficient to declare something as malicious. These types of features make it harder for the attacker to avoid detection. Next, we want a detector that detects everything that is malicious and nothing that is benign, and, finally, the detectors should be able to adapt to a changing adversary so that it can discover previously unseen attacks. Unfortunately, current detectors face tradeoffs sacrificing certain characteristics in order to achieve others.
to have high false negative and false positive rates (Taylor et al., 2016b,a). Similarly, Provos et al. (2008) reported a 10% false negative rate and Canali et al. (2011) reported a false positive rate of between 5% and 25% when classifying websites as malicious or benign, while Provos et al. (2007) only disclose that using obfuscated JavaScript as an indicator leads to a high number of false positives. Chapter 4 examines the limitations of these types of approaches and investigates their poor detection performances.
Second, in order to maintain high speed analysis, researchers build fast traffic classifiers based on either content-based signatures or machine learning. These approaches implicitly make the assumption that future attacks will look similar to past attacks leaving detectors unable to identify so-called “zero-day” attacks that are completely new. As a result, these approaches are unable to adapt to a changing adversary as will be described further in Chapter 5.
One could improve false negative and false positive rates by running potential exploits associated with websites in a virtual environment and extracting behavioral features based on changes to the web browser and operating system (Provos et al., 2008). These approaches have been successful in identifying zero-day attacks (Taylor et al., 2016a); however, virtualization is slow making it difficult to process the deluge of traffic using such a technique. Consequently, achieving the timeliness requirement of the ideal detector has been a research topic of great importance. Chapter 5 presents a new technique that adapts virtualization to the network enabling more thorough analysis while examining a fraction of the overall data.
2.2.2 Operational Challenges in Network Defense
As described in Sommer and Paxson (2010), there are four major operational research challenges in network defense. These operational challenges were described by Sommer and Paxson (2010) in the context of anomaly detection, but can be extended to network defenses in general. First, there is a high cost of errors. Errors, in this context, describe misclassifications of network traffic. When a network detector incorrectly classifies some traffic as malicious, when the traffic is actually benign, (i.e., a false positive) a security analyst must waste time examining the incident. As the number of false positives increase, the detector becomes unusable (Axelsson, 1999). On the other hand, classifying malicious traffic as benign can have catastrophic implications for an organization enabling an attacker free access to private corporate data.
potentially malicious behaviors, but tell us little about why the behavior is malicious. In order to assist the analyst better, we must investigate ways to provide the necessary context to make analysis faster.
Network traffic is extremely diversified. There are hundreds of network protocols, each with their own format, and some of those protocols such as HTTP and DNS have an infinite number of message content possibilities, and high variability in bandwidth, burstiness, and connection duration (Sommer and Paxson, 2010) over short intervals. Further, in the case of HTTP and DNS, if one goes looking for a particular behavior in the traffic, one can often find it. This makes defining “normal” traffic patterns incredibly difficult. As a result, researchers must use large datasets over time in an effort to measure the impact of an approaches effectiveness.
The latter challenge makes it particularly difficult to conduct sound evaluations on network detectors. For one, there are few publicly available datasets to conduct security research, and those that are available are out of date due to the constant evolution of network traffic. Even when private data sources are available, such as a traffic collector at the edge of a network, restrictions are imposed such that researchers cannot store full traffic traces to disk making dataset labeling challenging. Without large labeled datasets, it becomes almost impossible to train machine learning models that can reliably detect malfeasance on the network.
In this dissertation, I investigate the operational impact of some of the prominent network-based detection and then present new approaches to detecting exploit kits, and bots that help to deal with some of the key operation challenges discussed in this section and push the research community closer to the ideal network-based malfeasance detector. I propose techniques that significantly reduce false positives while improving or maintaining false negatives over existing approaches. Furthermore, I present techniques that are evaluated on large real-world datasets, and scale without the need for large cloud infrastructure. Each technique also detects exploits as they happen and in certain cases before any malicious activity can take place. However, before discussing these approaches, I first discuss some of the key ways in which exploit kits evade detection.
2.3 Exploit Kits Evasion Techniques
URLs, and IP addresses to avoid blacklisting. A blacklist is a list of domain names and IP addresses that are known to serve malicious content and as such, are blocked at the network-level.
During thebait phase, an attacker will redirect a client to a benign website if the client is from a known defender’s IP address space or if the client tries to load the exploit kit multiple times. For example, Google has a large cloud infrastructure that loads thousands of websites to test if they are malicious by monitoring operating system changes (Provos et al., 2008). If a request comes from a known Google IP address, the attacker will redirect to a benign site.
In thereconnaissance phase, the kit checks for signs that the client is a virtualized environment, which indicates that a defender is likely testing whether the site is malicious. To do the check, a kit will capitalize on bugs in the browser or a plugin to check for the presence of registry keys, I/O ports, background process, function hooks, or IP addresses that are specific to known virtual machine software (Kirat et al., 2014). If a virtualized environment is found, the exploit kit will redirect the client to a benign site.
Often, the attacker tries to make things difficult for the defender during theexploit phaseby spreading the components of the exploit across a number web resources (i.e., Flash file, JavaScript, HTML file, images, etc.). For example, a Flash exploit will only attempt to exploit a system if the proper parameters are passed in by the loading website. This prevents a defender from running the Flash file in a virtualized environment in isolation and observing any malicious behavior. Chapter 5 describes a new approach for network-based detection of such web-based exploits by providing context to exploitable files. The chapter also presents case studies with real life exploit kit examples.
Upon successfully infecting a host, the installed malware (bot) contacts its command-and-control server to receive instructions and updates (persistence phase). The bot needs some dynamic process to accomplish this goal without getting blacklisted by the defender. There are several dynamic approaches available to the bot; however, this dissertation focuses on bots that abuse the domain name system (DNS) to contact a command-and-control using a domain-name generation algorithms (DGAs) to bypass defenses which are described in more detail below.
2.3.1 DNS and DGAs
corresponding IP addresses (a process called a name resolution). A domain name consists of one or more parts, called labels, that are concatenated and delimited by dots (e.g., www.facebook.com). The rightmost label (e.g., com) represents the top-level domain, and the hierarchy of domains descends from right to left. Labels on the left represent subdomains of the domain to the right (e.g., www.facebook.com is a subdomain of facebook.com, which is a subdomain of com).
There are two main types of servers in the domain name system. An authoritative nameserver is a server that stores the actual domain name-to-IP address mappings while a recursive resolver is a DNS server that queries an authoritative nameserver to resolve a domain address. Domains are delegated to authoritative servers hierarchically. At the top of the hierarchy is the root server, and below it is the authoritative servers for each top-level domain, and below them are the authoritative servers for the sub domains, etc.
Figure 2.2 shows the process for resolving a DNS request for www.facebook.com. In the Figure, the client queries a recursive resolver for the IP address associated with www.facebook.com. In turn, the resolver will query a root server to find the location of the “com” server. Next, it will query the “com” server for the address of the “facebook.com” server and so on until the IP address associated with www.facebook.com is found and returned to the client. To speed up future queries, the DNS resolver will cache DNS responses for a period of time (called a time to live or TTL) specified by the authoritative server.
Client DNS recursive resolver
root name server
com. name server
facebook.com. name server Where's www.facebook.com?
!
"
#
$
%
69.171.239.12 Try 69.171.239.12
It's 31.13.69.228
198.41.0.4
It's 31.13.69.228
192.55.83.30 Try 192.55.83.30
Figure 2.2: The DNS resolution process is recursive in nature. The client queries its local DNS resolver for the IP address associated with a domain name (e.g., www.facebook.com). In turn, the resolver recursively makes queries down the DNS hierarchy until it finds the requested IP address and returns it to the client.
requested. The most common type of response is an A record which designates that an IP version 4 address should be returned for the query domain name. Other response types include PTR (reverse lookup), which allows the client to lookup a domain name given an IP address, and MX, which contains the address of the email exchange server for the corresponding domain name. Responses also contain status codes to indicate whether a request was successfully fulfilled. If a client makes a request for a domain name that does not exist in the database, an NX response or non-existent status is returned. An in depth discussion of DNS is beyond the scope of this dissertation; however, Mockapetris and Dunlap (1988) provides an excellent overview of how the system works.
DNS was not designed with security in mind, and as a result, any misuse of this service can have a significant impact on a network’s operational health. While some of the attacks attempt to exploit flaws in the resolution process (e.g., cache poisoning attacks (Kaminsky, 2008; Son and Shmatikov, 2010)), others are more subtle and leverage an enterprise’s DNS infrastructure to facilitate their activities. In this dissertation, I focus on the latter problem, highlighting a growing abuse of enterprise name servers whereby infected clients use automated domain-name generation algorithms to bypass defenses.
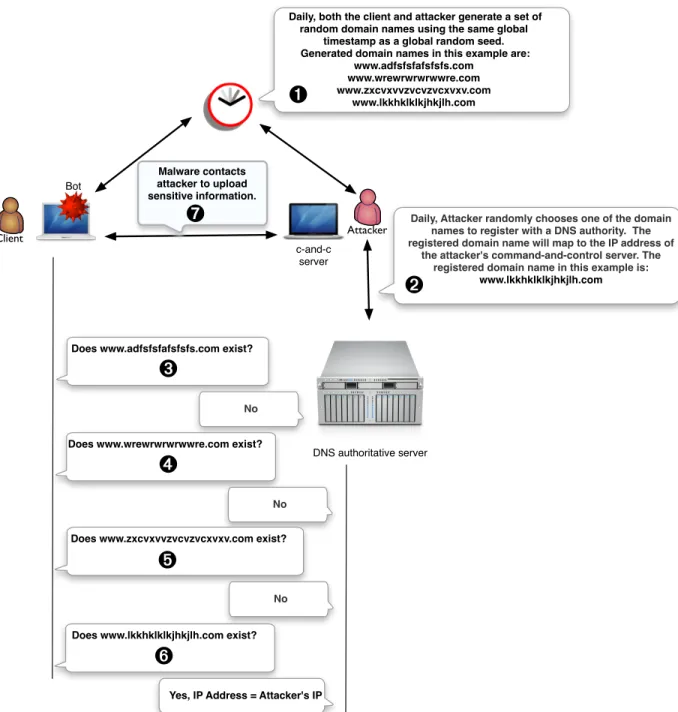
The idea behind a DGA is that the attacker wants to discourage a defender from blacklisting his command-and-control servers by making it extremely costly for the defender to do so. A DGA is designed to generate thousands of random domain names using some global seed. The global seed could be the date and time, the 10 top trending words on twitter, or any publicly available piece of information. A bot (or malware) will then systematically query each domain name while only one of the domain names is actually registered in the DNS database as shown in Figure 2.3. The registered domain name corresponds to the command-and-control server. A bot contacts its command-and-control server everyday generating a new set of domain names each time. Examples of malware that exhibit such behavior are botnets such asconfickerandkraken
and web-based malware and trojans such asRunForestRun(Unmask Parasites, 2012).Confickeris a sophisticated computer worm that propagates while forming a botnet. Since its discovery in 2008, it has remained surprisingly difficult to counter because of its combined use of advance malware techniques. To date, it has infected millions of computers worldwide. The early variants would reach out to 250 pseudo-randomly generated domain per day from eight Top Level Domains (TLDs) in an attempt to update itself with new code or instructions.
describe an AGD as an “automatically generated pseudo-random domain name” created by a botnet using a domain generation algorithm (DGA), whereas other authors (Bilge et al., 2011; Yadav et al., 2010; Born and Gustafson, 2010; Stone-Gross et al., 2009) refer to the process of generating domains as “domain fluxing.” In this dissertation, analgorithmically generated domainis described as a domain that is generated by an automated process with the key objective of minimizing collisions within the DNS namespace. Consequently, algorithmically generated domains tend to be relatively long pseudo-random strings derived from some global seed. Google Chrome’s domain generator, for example, creates three alpha-character strings (each of length ten) upon startup, and these strings are used to test whether the configured DNS server hijacks non-existent (NX) responses. If so, Chrome does not perform prefetching (ISC, 2011) of search terms that are entered into its location bar.
Client
DNS authoritative server
Attacker
Bot
Daily, Attacker randomly chooses one of the domain names to register with a DNS authority. The registered domain name will map to the IP address of
the attacker's command-and-control server. The registered domain name in this example is:
www.lkkhklklkjhkjlh.com
Daily, both the client and attacker generate a set of random domain names using the same global
timestamp as a global random seed. Generated domain names in this example are:
www.adfsfsfafsfsfs.com www.wrewrwrwrwwre.com www.zxcvxvvzvcvzvcxvxv.com
www.lkkhklklkjhkjlh.com
!
"
Does www.adfsfsfafsfsfs.com exist?
No
Does www.wrewrwrwrwwre.com exist?
No
Does www.zxcvxvvzvcvzvcxvxv.com exist?
No
Does www.lkkhklklkjhkjlh.com exist?
Yes, IP Address = Attacker's IP
#
$
%
Malware contacts attacker to upload sensitive information.
&
'
c-and-c server
CHAPTER 3: BACKGROUND
In Chapter 4, I investigate how the structural patterns in HTTP traffic are used to identify exploit kit related traffic while reducing false positives and false negatives over existing approaches. In this chapter, I describe a typical tree structure, and perform an indepth analysis of one of the most popular techniques for analyzing tree data — namely subtree mining. The analysis will help guide the approach chosen in Chapter 4 and inform the research community as to the limitations of subtree mining techniques on large real-life datasets.
3.1 Modelling HTTP Traffic as Trees
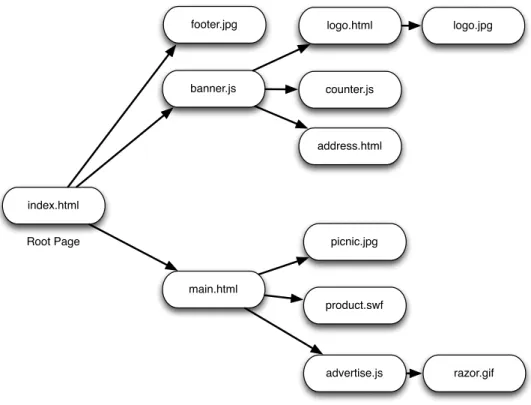
When a user surfs to a website (e.g.,http://www.cnn.com), the web browser retrieves the site’s main page from the server, parses it, and begins retrieving all the embedded web objects that comprise the page. These objects include other embedded pages, JavaScript objects, images, and videos. The embedded pages, and JavaScript objects may, in turn, load even more web objects. From a network perspective, web browsers and servers communicate in a text-based request/response protocol called HTTP whereby each loaded web object corresponds to a new HTTP web request and response by the browser to/from the server(s). Each HTTP request contains the URL (or location) of the file requested, and a list of headers that confer information about the web client to the web server. The most important request header for this dissertation is theRefererheader which contains the URL of the web object that requested the current web object.
The web server responds with an HTTP response that contains the content requested as well as a set of headers describing the content (e.g., content type, content length, etc.), and status code indicating whether the request was successfully fulfilled. In some cases, the server may redirect the web browser to another server responding with a redirection status code, and aLocationheader with the new location of the web object.
the tree. Figure 3.1 shows an example of this tree-like structure for a website that has a root page called
index.html. In this dissertation, such trees are called web session trees.
index.html
Root Page
footer.jpg
banner.js
logo.html
counter.js
logo.jpg
address.html
main.html
picnic.jpg
product.swf
advertise.js razor.gif
Figure 3.1: A root page (index.html) can load several different web resources (e.g., JavaScript, HTML, JPG), which, in turn, can load other web resources. This “loads” relationship forms a tree-like structure.
3.2 Subtree Mining: A Comparison of Algorithms on Real World Datasets
relatively old, semi-structured datasets that represent trees and graphs are ubiquitous and new algorithms based on graph and subtree mining are still being proposed (Bui et al., 2014; Hadzic et al., 2015; Narouei et al., 2015). There are even approaches that reduce graph mining problems into subtree mining problems in order to reduce the runtime complexity of mining (Gemignani et al., 2015). Subtree mining research is still relevant because there are relatively few better alternatives to encode structure for solving problems on semi-structured data. Indeed, mining frequent substructures represents non-trivial challenges. The process often requires scanning the entire database over multiple iterations, which can be prohibitively expensive for large-scale settings. To address numerous practical challenges and limitations, several approaches have been recently proposed (Zaki, 2005; Jim´enez et al., 2012; Zou et al., 2006b; Kutty et al., 2007; Xiao et al., 2003; Tatikonda et al., 2006; Chehreghani et al., 2011; Asai et al., 2002; Chi et al., 2003; Hido and Kawano, 2005; Wang et al., 2004) (see (da Jim´enez et al., 2010) for an excellent survey); however, to date, most evaluations of subtree mining algorithms are on synthetic or small scale real datasets leaving one to wonder how they perform on a variety of real-world datasets. My interest in subtree mining is motivated by the problem of discovering malicious subtree patterns in network traffic, but existing literature does not provide insight as to whether subtree mining represents a viable solution for a real-world networking dataset.
In what follows, I examine a recent line of inquiry on the problem of mining frequent subtrees in a database of rooted and labeled trees. Existing methods can be broadly classified into two categories:
candidate generationandpattern growth. A candidate generation algorithm enumerates all possible subtree combinations and incrementally calculates the frequency count for each subtree using an indexing structure that stores the occurrences of frequent nodes in the database. A pattern growth algorithm follows the divide-and-conquer methodology and generates candidate subtrees by growing subtrees from the data itself.
Despite the substantial body of work, there is still a significant lack of understanding of the strengths and limitations of these algorithms in realistic settings, resulting in a set of widely held, yet questionable, conclusions. For example, it is believed that pattern growth techniques are superior (Zou et al., 2006b; Kutty et al., 2007; Wang et al., 2004; Deepak et al., 2013); however, little evidence suggests a measurable advantage. Second, while the performance of subtree mining algorithms is influenced profoundly by multiple factors (e.g., tree size, degree, depth, label distribution), due to limitations of evaluation datasets, little is known about the intricate interplay between these factors.
realistic settings and ultimately inform better algorithm design by investigating their strengths and limitations. This chapter begins by studying the characteristics of synthetic datasets (Zaki, 2005) used in the majority of studies and demonstrate their shortcomings when compared to real datasets. The work then proposes novel synthetic tree generators that provide great flexibility in setting multiple factors (e.g., tree size, depth, fanout, label distribution) and produce trees closely mimicking the characteristics of real datasets. Leveraging the generated synthetic datasets and seven large real datasets, I investigate the runtime performance of four representative subtree mining algorithms from the two main categories (candidate generation and pattern growth) under varying setting of profounders. The algorithms were chosen because they contain the core concepts of the two categories, are popular in the literature, and represent the current state of the art. I provide insights into the strengths and weaknesses of these algorithms, many of which challenge conventionally held beliefs.
Besides regular frequent subtree mining, the chapter also considersclosedfrequent subtree mining. A frequent subtree is closed if none of its supertrees have the same support. The concept of closed subtree is attractive because special pruning techniques can be applied to speed up the mining performance and reduce the number of subtrees generated. The performance impact gained by leveraging closeness is measured.
The remainder of the Chapter begins with the four subtree mining algorithms compared in this study. Section 3.4 details the methodology, while sections 3.5 and 3.6 describe the real-world and synthetic datasets utilized. Experimental results are provided in section 6.6 before discussion and lessons learned.
3.3 Subtree Mining Algorithms
For pedagogical purposes, I first introduce fundamental concepts and notations used throughout the paper, then formalize the problem of frequent subtree mining. The four representative algorithms for mining subtrees compared in this work are also described.
3.3.1 Background
Alabeled treeis a connected acyclic graph defined asT ={V, E,Σ, L}whereV is the set of tree nodes;
E ⊆V ×V is the set of edges;Σis the alphabet for node labels; andL:V →ΣS
root nodev0 which does not have incoming edges, thenT is called arooted tree. If there is an ordering
relationship defined between sibling nodes in a tree, thenT is called anordered tree.
Depending on whether a binary ordering relationship≤is defined over the tree nodes, rooted trees can be classified into:ordered treeswhere≤is defined for every pair of siblings for every tree node;unordered treeswhen there is no predefined order between sibling nodes; andpartially-ordered treeswhere≤is defined only on some sets of siblings. Most subtree mining algorithms, including those compared in this dissertation, are applicable toordered label trees.
All the tree mining algorithms in this study store trees in a preorder canonical string format. The pre-order string is built by adding the label of each tree node in the order of pre-order tree traversal. A special symbol ↑is used when the traversal backtracks from child to parent. For instance, the pre-order string of tree in Figure 3.2 (a) isABE↑F ↑G↑↑C ↑DH ↑I. The same scheme can be adapted to the representation of unordered or partially ordered tree — see Chi et al. (2005) for more details.
A subtree is a subset of nodes and edges extracted from a larger tree. The three main types of subtrees are induced, bottom-up, and embedded.
A
B
C
D
E
F
G H
I
B
E
F
G
B
E
G
A
E
F
D
(a) (b) (c) (d)
Figure 3.2: Types of subtrees. (a) original tree, (b) bottom-up subtree, (c) induced subtree, (d) embedded subtree
They are defined as follows:
• Bottom-up subtrees: For a rooted treeT with vertex setV and edge setE, a subtreeT0is a bottom-up subtree if and only if (1)V0 ⊆V; (2)E0 ⊆E; (3) all the labels ofV0 andE0are preserved; (4) if
• Induced subtrees: An induced subtreeT0can be defined as a bottom-up tree without the last constraint. For any vertexv∈V0, it can contains only a subset of all its descendant nodes inV; however, ifv1is the parent ofv2inT and both of them are present inT0, thenv1must also be the parent ofv2inT0. Intuitively, an induced subtreeT0can be obtained by repeatedly removing leaf nodes from a bottom-up subtree ofT. Figure 3.2 (c) shows an example of induced subtree.
• Embedded subtrees: An embedded subtree further relaxes the constraints of induced subtrees by allowing breaking parent-child relationships; however, the ancestor-descendant relationships among vertices ofT must be preserved. AT0is an embedded subtree ofT if and only if: (1)V0 ⊆V; (2) the labels of all the nodes ofV0 inT is preserved inT0; (3) ifv1 is the parent ofv2 inT0, thenv1 must be an ancestor ofv2inT; (4) for allv1andv2inV0, preorder(v1)<preorder(v2) inT0 if and only if
preorder(v1)<preorder(v2) inT. Figure 3.2 (d) shows an example of induced subtree. Notice that
verticesEandF are not direct children ofAin the original tree.
Most frequent subtree mining algorithms attempt to discover frequent induced subtrees in a database of ordered, labeled trees, due to their wide-range applications. Therefore in the study I focus on the following problem:
Given a database of ordered, labeled treesD, find all induced subtrees appearing in at least∆trees in D, where∆is a user-specified threshold (called the minimum support). The support threshold is typically
presented as a fraction of the overall number of trees in the dataset.
Existing subtree mining algorithms can be classified into two categories: candidate generation and pattern growth (da Jim´enez et al., 2010), both built upon thea-priori principle: all subtrees of a frequent subtree must also be frequent. Thus both candidate generation and pattern growth form candidate subtrees using frequent nodes as basic building blocks, though different in their particular ways of constructing candidates. A plethora of algorithms based on these basic concepts have been proposed (da Jim´enez et al., 2010), which provide a variety of enhancements to improve performance. To date a broad comparison of approaches has not been done.
stored in a breadth-first or depth-first canonical form (Chi et al., 2005) and a special in-memory structure is built to map frequent nodes to their positions in trees in the database. New candidates are built by continuously adding frequent nodes on either the right-most or left-most path of current ones.
By comparison, pattern growth has been highly touted in the literature as much faster than candidate generation, but has received little attention by the majority of subtree mining studies (da Jim´enez et al., 2010). Pattern growth grows subtree patterns from the data itself, by starting at frequent nodes in dataset and visiting surrounding nodes to build subtrees (Kutty et al., 2007); therefore, it only generates candidates that actually appear in the data eliminating the costly checking phase employed in traditional candidate generation algorithms. The tree dataset is partitioned by frequent nodes and each time a potential frequent subpattern is found, it is mined against all candidates in the partition.
Chi et al. (2003); Kutty et al. (2007) focus on closed and maximal subtree mining to reduce the number of subtrees generated. Closed and maximal subtrees are a subset of all subtrees. A frequent subtree is closed if none of its supertrees have the same support (count). It is maximal if none of its supertrees have a support count higher than the minimum threshold.
weaknesses of two major schools of subtree mining algorithms, I have no vested interest in any of these specific extensions.
The analysis that follows is by no means an easy feat, requiring (in some cases) an implementation of algorithms based off the description in there respective papers, a thorough understanding of each algorithm, and an assurance that the outputs were the same across each dataset. All implementations of the algorithms in our comparative study were written in C++, compiled with GCC 4.1.2, using optimization 3, with STL vectors, and the densehashmap1to ensure a fair comparison. The implementation of the algorithms and correspondence with authors (in some cases) took several months to complete.
3.3.2 Review of Selected Algorithms
FREQT(Asai et al., 2002) is a candidate generation subtree mining algorithm that incrementally constructs sets of subtree candidates of a particular size. As with all algorithms studied, candidates are generated by adding frequent nodes only on the rightmost branch of the tree.
In the first pass, a set of all single-node frequent candidates are mined and their occurrences (in the dataset) are marked using a data structure called an occurrence list. An occurrence list is simply an index which knows the location of all frequent subtree candidates in the dataset. In subsequent passes, the set of all candidates of sizekare computed by merging the candidates of sizek−1computed earlier. All patterns of a certain size and their occurrence lists are maintained in memory.
It is prudent to note that FREQT’s definition of a frequent subtree is slightly different than the typical definition of frequency. That is, FREQT treats an entire dataset of trees as one big tree with a single root node and defines the frequency of a subtree as the number of occurrences of the subtree in the larger tree. The typical definition is to count the frequency as the number of trees in which a subtree appears. For example, if subtreesappeared 5 times in a single tree, FREQT would have a frequency count of 5, while the other algorithms would count it only once. The subtle difference does not have a significant impact on our findings. Implementation The JAVA-based implementation released by Asai et al. (2002)2was reimplemented in C++ for a more fair comparison with the other algorithms. It was modified to read canonical formatted trees (as first described in Zaki (2005)) instead of XML. The rewrite was done based off version 4 of the source code (dated March 24th, 2004). Additionally, Asai et al. (2002) describe two feature additions to
1https://github.com/sparsehash/sparsehash
the base FREQT algorithm: 1) duplicate node detection and 2) node skip. Duplicate node detection detects and minimizes the impact of duplicate nodes in the dataset while node skip prunes infrequent nodes when growing subtrees during the candidate generation phase of the algorithm. I enable the node skip feature and disable the duplicate detection feature so that there is an environment where FREQT and PREFIXISPANare compared fairly. Next, the experiments are run with duplicate detection enabled to show how the feature improves performance.
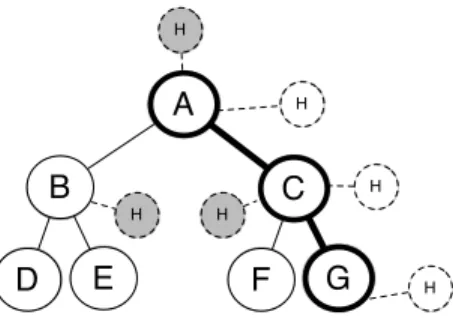
CMTREEMINER is a candidate generation algorithm suggested by Chi et al. (2004) and similar to FREQT, except it only reports closed and maximal subtrees, and generates candidates one by one, instead of all candidates for a fixed sizekat once. Since it generates only closed and maximal trees, it leverages a set of pruners to reduce the number of candidates generated. The core component of the CMTreeMining (Chi et al., 2004) algorithm is called theblanket. The blanketBtof a treetis the set of all supertrees oftthat have one more node thant. A frequent subtree is maximal iff for everyt0 ∈Bt,support(t0)<∆;tis closed iff for everyt0 ∈Bt,support(t0)< support(t).t0 ∈Btandtareoccurrence matchedif for each occurrence oft in the dataset, there is a corresponding occurrence oft0;t0 ∈Btandtaresupport matchedif for each tree in whichtappears, there is a corresponding appearance oft0. If two trees are occurrence matched, they are also support matched.
A
B
D E
C
F G
H
H H
H
H
H
Figure 3.3:sconsists of nodesA−G. A blanket consists of adding a nodeHeither along the rightmost path ofs(e.g., the transparentHnodes) or off the rightmost path (e.g., the shadedHnodes).
If the candidate tree is not pruned, it is checked for closure by calculating a support match blanket. The same principle holds as with the occurrence matched blanket—if there is a support matched candidate in the blanket whose node does not appear on the rightmost path, then the candidate is not closed. Next, the candidate is extended by single nodes on the rightmost path and the algorithm is recursively called on the new candidates.
Each time a candidate is generated along the rightmost path, it is checked for closure and maximality. Finally, maximal trees are tested with a frequency blanket to verify they are maximal. If all treest0in the frequency blanket ofthave a support threshold less than∆, thantis considered maximal. Note that the frequency blanket is only checked after closure is confirmed on all paths, and maximality is confirmed on the rightmost path. In doing so, the number of frequency blanket checks are substantially reduced.
Implementation I use the C++ implementation (dated April 4, 2008) for CMTREEMINER(Chi et al., 2003)3. The implementation was modified to support hashes rather than arrays to improve performance for high cardinality labels (the original implementation only supported216labels).
PREFIXISPAN is a pattern growth technique suggested by Zou et al. (2006b). It generates subtree candidates by traversing the datastore instead of enumerating the space of candidate trees. It is based off the concept of agrowth elementwhich can be thought of as follows: Given a treetofmnodes and another tree
t0of(m+ 1)nodes,tis considered a prefix oft0and the extra node int0is called the growth element oft. The growth element consists of both the node label and attaching position int.
The algorithm is also built on the concept of aprojected instance. The idea is as follows. Suppose we have a treetand a subtree candidates, and some occurrences ofsint. The postfix subtrees attached tos
form a projected instance oft. A postfix subtree is simply the remaining portion of the tree following the occurrence of the subtrees. If we take the projected instances of all occurrences ofsacross all the trees in
D, we get a projection database of all potential growth elements ofs. Given this projection database, we can grow the subtree along the rightmost path and calculate its support as it grows. This process effectively reduces the need to check a subtree with the database, resulting in improved performance. Assis grown, the projection database is continually partitioned until there are no more entries at which point a new set of subtrees is mined.
PCITMINERincorporates two extensions to PREFIXISPANin order to support closure(Kutty et al., 2007). Kutty et al. (2007) propose that the subtree space be reduced by using a backward scan based on the following observation: given two single-node frequent subtreessands0in a datasetD, ifs0is the parent ofswherever
sappears inD, then the projection growth ofscan be halted becauses0will contain all subtrees using the prefix4ofs. Note that the backward scanning approach is similar to an occurrence match blanket idea, but only prunes candidates with occurrence matched parents instead of all occurrence matched nodes not on the rightmost path.
Kutty et al. (2007) also propose the use of a forward and backward extension event checking mechanism. A backward extension event occurs when there is a node that is not on the rightmost path of the current subtree, but is support matched with the subtree. A backward extension is similar to a support match blanket and signals that a subtree is not closed.
A forward extension event occurs when the extra nodenins0pis along the rightmost path and againsp would not be considered closed.
Implementation I was unable to procure an implementation of either PCITMINERor PREFIXISPANfrom the original authors after repeated attempts to contact; therefore, I built a C++ implementation based off the papers5. I diverged from the approach of Kutty et al. (2007) in two ways. I found that the backward scanning feature alone did not provide an adequate enough performance comparison with CMTREEMINERbecause the feature was unable to prune the subtree space as well as an occurrence match blanket (see §3.7.3 for
4Kutty et al. (2007) describes backward scanning incorrectly in Lemma 1. The Lemma says thats0
must be a parent ofsin all trees ofD. However,s0andsmust be occurrence matched for backward scanning to work.
5
further discussion); therefore, I extended the backward scanning technique to include an occurrence matched blanket. This change improved the performance of the original algorithms on real-world datasets.
The closure check in the PCITMINERpaper involves checking for closure by storing a database of “potentially” closed subtrees, upon which new subtrees are checked. I favored a simpler solution that checks
for support matched growth elements and eliminates storing potentially closed subtrees.
3.4 Methodology
The four algorithms (CMTREEMINER, PCITMINER, FREQT, and PREFIXISPAN) were tested against a random sample of 8,000 trees from each of seven real and four synthetic datasets (described next). Eight thousand was the chosen number because theWeatherandWikipediaonly contained 8,000 trees and the number was large enough to show bottlenecks during evaluation. Note that FREQT was run with both duplicate detection disabled and then enabled.
All algorithms were tested against the same samples and the minimum support threshold was varied between each run across four values: 0.05, 0.01, 0.001, and 0.0001. The thresholds were chosen because they represent a wide spectrum of workloads for the algorithms. At the lowest threshold (0.0001), every node is frequent while at the highest threshold (0.05), no dataset has more than 145 frequent nodes.
Metrics To study the performance of the aforementioned algorithms, I analyzed their behavior based on (i) theircandidate generationphase where a set of candidate subtrees are created to be mined and (ii) their
dataset iterationphase where subtrees are verified. I compute (1) the number of subtree candidates generated and checked against the database, (2) the total number of tree nodes visited, (3) the size of occurrence lists in terms of number of items, (4) wall time, and (5) the number and size (in terms of nodes) of each frequent and closed subtree.