Electronic copy available at: http://ssrn.com/abstract=2071615 1
A comparison of performance of Islamic and conventional banks
2004 to 2009
Jill Johnes1, Marwan Izzeldin and Vasileios Pappas2
April 2012
Department of Economics
Lancaster University Management School Lancaster University LA1 4YX
United Kingdom
Abstract
We compare, using data envelopment analysis (DEA), the performance of Islamic and conventional banks prior to, during and immediately after the 2008 financial crisis (2004-2009). There is no significant difference in mean efficiency between conventional and Islamic banks when efficiency is measured relative to a common frontier. A meta-frontier analysis (MFA), new to the banking context, however, reveals some fundamental differences between the two bank categories. In particular, the efficiency frontier for Islamic banks typically lies inside the frontier for conventional banks, suggesting that the Islamic banking system is less efficient than the conventional one. Managers of Islamic banks, however, make up for this as mean efficiency in Islamic banks is higher than in conventional banks when efficiency is measured relative to their own bank type frontier. A second-stage analysis demonstrates that the differences between the two banking systems remain even after the banking environment and bank-level characteristics have been taken into account. Our findings will be useful to both policy-makers and managers.
Keywords: Banking sector; Islamic banking; Efficiency; Data Envelopment Analysis; Meta-frontier analysis
JEL Classification: C14; G21
1
Corresponding author: email: [email protected] 2
Acknowledgement: The authors are grateful to the Gulf One Lancaster Centre for Economic Research (GOLCER) for support.
Electronic copy available at: http://ssrn.com/abstract=2071615 2
1.
IntroductionThe 2008 financial crisis led to difficulties in many conventional banks across the globe. Islamic banks, in contrast, were largely insulated from the crisis (Willison, 2009; Yılmaz 2009). Their highly regulated operational environment guided by Shariah principles prohibited investment in the type of instruments which adversely affected conventional banks and which prompted the crisis (Hasan and Dridi, 2010). The success of Islamic banks relative to conventional banks in the macroeconomic environment is in contrast to expectations of performance (by which mean technical efficiency) in a microeconomic context. The very characteristics which make Islamic banks macroeconomically resilient are ones which are likely to make them less technically (or X-) efficient. Conforming to Shariah principles, for example, means that Islamic banks frequently provide individually-negotiated (rather than off-the-peg) banking products; they are often relatively small in size and hence unable to reap the benefits of any economies of scale; and they are owned by domestic rather than foreign banks and therefore have less opportunity for benefitting from outside innovations and efficient practices. There are few studies, however, which actually evaluate efficiency in Islamic banking relative to conventional banking, and the evidence from these is mixed. Thus the questions of which banking system is more efficient and why remain open.
The first Islamic bank was founded in 1975 (the Dubai Islamic Bank) at which point only the most fundamental contracts were available (safekeeping accounts, sale and profit-and-loss sharing contracts). Islamic bonds were launched in 1978 followed by Islamic equity funds and Islamic insurance during the 1990s. More recently we have seen the introduction of Islamic indexes such as the Dow Jones Islamic Markets (DJIM) and the Financial Times Stock Exchange (FTSE) Shariah. The first Islamic products were largely developed to cater for government and corporate requirements. But the growth in the size and wealth of the Muslim population alongside an increasing desire of Muslims to have available financial instruments which are Shariah-compliant have created a challenge to provide consumers with products with a similar or higher rate of return to those on offer in the conventional sector, yet which still conform to Islamic principles. This has led to banking
3
innovations at the consumer level including Islamic bank accounts, Islamic credit cards and Islamic mortgages.
Pressure on Islamic banks to continue to innovate is provided by the increasing appeal of the traditional values of Islamic finance to Western investors who are disillusioned with the banking practices of conventional banks in the wake of the global financial crisis (Arthur D Little 2009). Appetite for Islamic investment products grows stronger as Islamic banks are found to be less likely to fail than conventional ones (Čihák and Hesse, 2010). As a consequence, Islamic banks are no longer only a feature of traditional Muslim regions: there are more than 300 Islamic financial institutions spread across 70 countries. Indeed, there are now 5 Islamic banks in the UK (the only EU country to have Islamic banks), and 19 Islamic financial institutions in the USA. An in-depth study of the Islamic banking sector and its efficiency relative to the conventional banking sector is therefore of widespread interest.
There is now a sufficiently long history of Islamic banking to allow an in-depth analysis of Islamic compared to conventional banking (Khan, 2010). The primary purpose of this paper is therefore to compare the performance of Islamic and conventional banks using a consistent sample of 210 conventional and 45 Islamic banks across 19 countries over a period of macroeconomic turmoil namely 2004-2009. To this end, we adopt a meta-frontier approach which decomposes efficiency into two components: one due to the modus operandi and one due to managerial competence at converting inputs into outputs. This allows us to reveal previously unseen aspects of efficiency in Islamic compared to conventional banking. In a second stage, we examine the possible determinants of the different measures of efficiency. By investigating the determinants of the different components of efficiency (rather than just the overall efficiency) we are able to uncover more effective ways in which managers and policy-makers can improve efficiency.
The paper is in six sections of which this is the first. Section 2 discusses the methodological approaches to efficiency measurement while a brief literature review is presented in section 3. Sample data and the empirical model are described in section 4 and results are presented and interpreted in section 5. Conclusions and policy implications are discussed in section 6.
4
2.
MethodologyStudying banking efficiency can be done in two ways: by use of traditional financial ratio analysis (FRA); or by the distance function approach whereby a firm’s observed production point is compared to a production frontier which denotes best practice, and the distance between the two points provides a measure of technical efficiency. This approach leads to frontier estimation methods such as data envelopment analysis (DEA) and stochastic frontier analysis (SFA).
Financial ratios are popular for a number of reasons: they are easy to calculate and interpret (Hassan and Bashir, 2005); they allow inter-bank comparisons; they also permit comparisons between banks and the ‘benchmark’ which is usually the average of the industry sector (Halkos and Salamouris, 2004). Performance evaluation can, moreover, be examined from various perspectives including costs, revenue and profit. Banks are complex organisations, though, which produce an array of outputs from a range of inputs. One ratio cannot capture the complete picture of performance of such an organisation over the breadth of its activities, and there is no criterion for selecting a ratio that is appropriate for all interested parties (Ho and Zhu, 2004). In addition, the assumption underlying financial ratios that banks are interested in cost minimisation, profit maximisation, or revenue maximisation is a severe drawback of their application in the context of Islamic banking where these are not the most pressing objectives (Abdul-Majid et al., 2010). We therefore eschew FRA as a means of analysis in this paper.
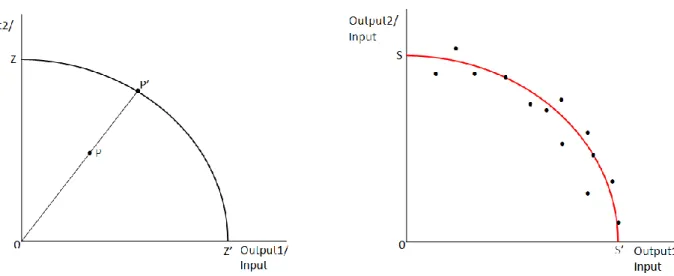
The distance function approach is an attractive alternative because it allows for both multiple inputs and multiple outputs, and does not assume any particular optimizing behaviour on the part of the firms. The approach is founded upon simple production function theory. Consider a bank which produces two outputs (for example loans and other earning assets) from one input (for example fixed assets). Its observed production point is at P in figure 1a, while the production possibility frontier for the industry is shown by ZZ. The measure of technical efficiency of the bank is therefore given by the ratio 0P/0P, the inverse of which represents the radial expansion in output (given input level) which is needed for the firm to become fully efficient.
5
In order to derive this measure of efficiency for each bank we need to estimate the production possibility frontier (ZZ) in figure 1a. On the assumption that we have data on the inputs and outputs of the banks in which we are interested (hypothetical observations are illustrated in figures 1b and 1c), we can do this in two possible ways. The parametric method, SFA, provides an estimated frontier which might look like SS in figure 1b: there is a functional form for the frontier, and random errors are allowed for (that is why some of the observations lie outside the frontier). The estimation method, however, relies heavily on various assumptions regarding functional form and distribution of errors; these require large degrees of freedom and may introduce misspecification bias. SFA is also difficult to apply in the context of multiple inputs and multiple outputs. For these reasons we consider it to be an inappropriate method in the present context.
In contrast, the non-parametric method, DEA, provides a frontier which is piece-wise linear and envelops the observed production points (see DD in figure 1c). There are no underlying assumptions and hence no problems of misspecification. Moreover, by enveloping the observed production points, the DEA frontier allows each bank to have different objectives as it will only be compared with banks of similar input and output mix. In the present context this means that Islamic banks, whose main objectives are likely to differ from those of conventional banks, will not be penalised (in terms of their efficiency measurement) relative to their conventional counterparts. Finally, because DEA is based on linear programming, there are no problems of applying it in a context of multiple inputs and multiple outputs. Our method of choice in the subsequent analysis is therefore DEA a formal presentation and discussion of which can be found elsewhere (Coelli et al., 2005; Majumdar, 1995).
Increasing globalisation and the growing attraction of Islamic finance worldwide has led to direct competition between Islamic and conventional banks. Whilst a comparison of performance between Islamic and conventional banks is therefore of interest, this is only a first step: of particular importance is the identification of the source of any efficiency differences. In particular, do the rules under which Islamic banks must do business affect the efficiency with which they can operate? If so, to what extent? Clearly, policies to improve bank efficiency will depend on whether the source of
6
inefficiency is the banking regime or managerial incompetence. One contribution of this paper is to introduce to the financial literature a meta-frontier methodology (similar to one introduced by Charnes et al., 1981) for decomposing the efficiency of banks into two components: one which is due to the modus operandi i.e. the context in (or rules under) which the bank operates (namely conventional or Islamic); and one which is due to managerial competence at converting inputs into outputs within the context in which the bank operates.
This decomposition can be illustrated by means of a simple example whereby we assume that each bank produces one output (for example loans) from one input (for example fixed assets). The hypothetical production points for a number of banks are plotted in figure 2. The boundary ABCDE envelops all banks in the sample, and banks lying on the frontier are efficient relative to others. Bank Y lies inside the frontier and has an efficiency score of 0y/0y . This represents the proportion of output (loans) achieved by bank Y relative to the best possible output achievable by all banks and given the input level of bank Y.
Figure 2
In order to assess the sources of inefficiency of bank Y, we need to consider each bank’s efficiency relative only to the banks of the same type. Let us assume that banks can be categorised into two types: type 1 and type 2. The original boundary ABCDE is the gross efficiency boundary. ABCDE, in this example, is also the boundary for type 1 banks and FGHIJ is the boundary for type 2 banks. We will call these the net efficiency boundaries. Bank Y, a type 2 bank, has a net efficiency score of
which represents the proportion of output obtained by bank Y relative to the best possible
output achievable by type 2 banks only and given bank Y’s input level. The distance between the net and gross boundaries ( ) measures the impact of bank Y being of type 2 on its output. The type efficiency score is therefore and provides a measure of the impact of operating under a type 2 regime on bank Y.
3.
Literature reviewThere is an abundant literature on the efficiency of banking institutions: detailed (albeit somewhat outdated) reviews can be found elsewhere (Berger and Humphrey, 1997; Berger and Mester, 1997;
7
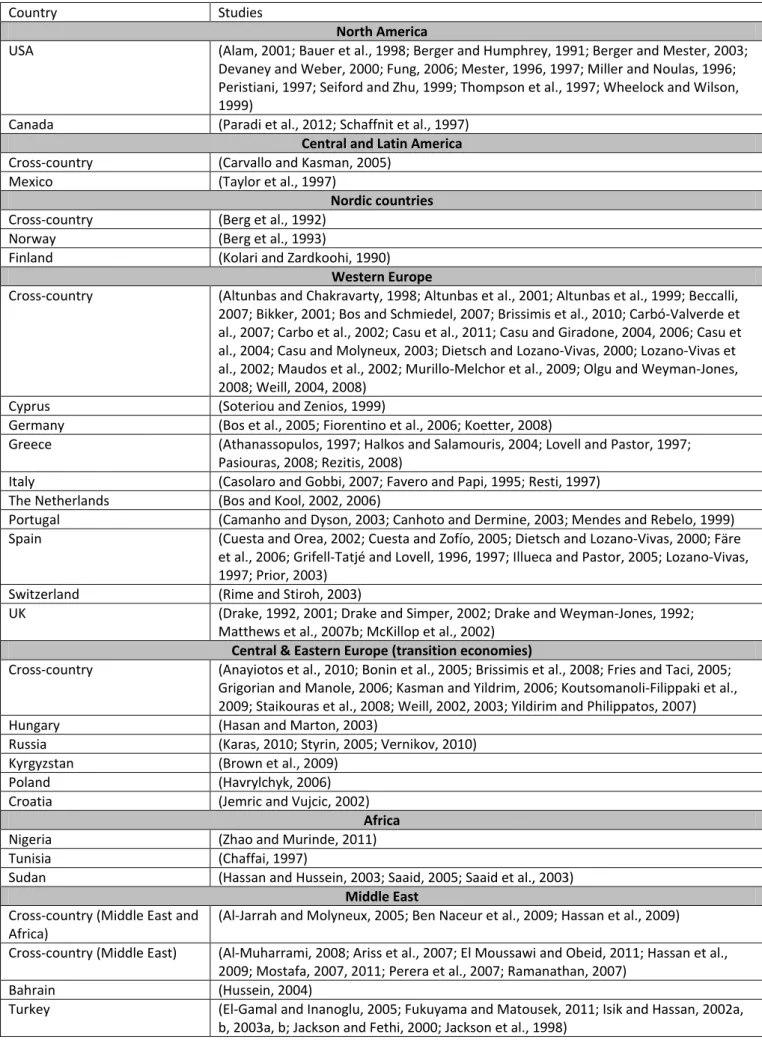
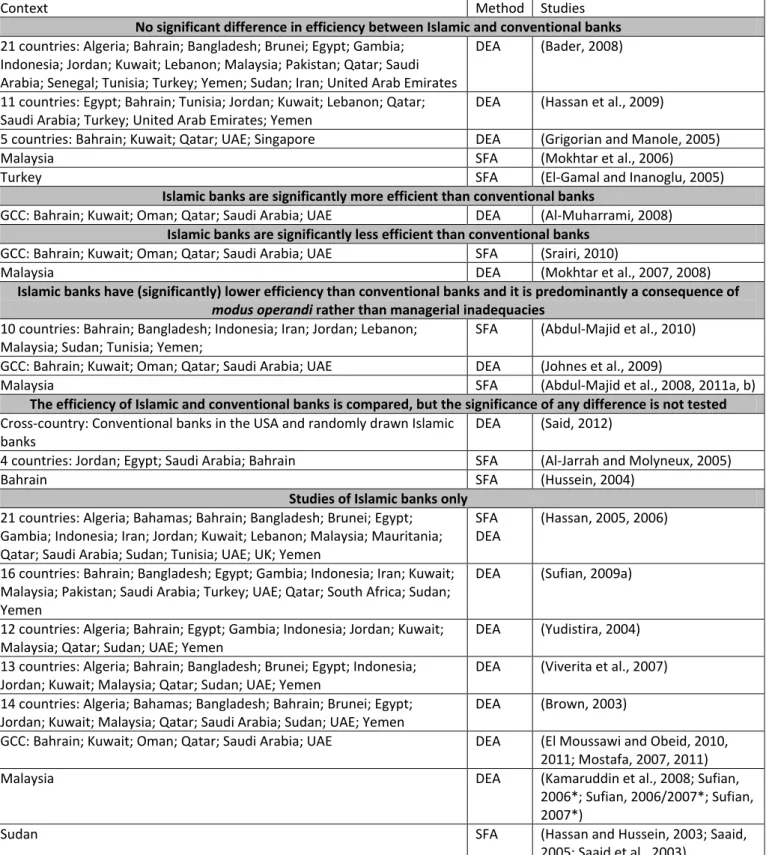
Brown and Skully, 2002), and table 1 provides a summary of banking efficiency studies by country context. A small subset of this literature focuses on Islamic banking either in isolation or in comparison to conventional banking (see table 2 for details of studies which use frontier estimation methods to derive measures of efficiency). The remainder of this section will focus predominantly on the comparative literature.
Table 1 Table 2
Islamic banks might be expected to have lower efficiency than conventional banks for a number of reasons. First, the strict application of Shariah rules means that many of the Islamic banking products are unstandardised thereby increasing operational costs in Islamic banks relative to those of conventional banks. Second, Islamic banks tend to be small compared to conventional banks, and there is evidence that technical efficiency increases with size in the banking industry (Abdul-Majid et al., 2005a; Bhattacharyya et al., 1997; Chen et al., 2005; Drake and Hall, 2003; Drake et al., 2006; Isik and Hassan, 2002b; Jackson and Fethi, 2000; Miller and Noulas, 1996; Sathye, 2003). Third, Islamic banks are often domestically owned and the majority of the evidence suggests that foreign-owned banks are more technically efficient than their domestically-owned counterparts (Hasan and Marton, 2003; Isik and Hassan, 2002b; Jemric and Vujcic, 2002; Kasman and Yildrim, 2006; Matthews and Ismail, 2006; Mokhtar et al., 2008; Sturm and Williams, 2004; Weill, 2003)3.
The evidence from previous empirical studies of Islamic and conventional banking is mixed: some find no significant difference in efficiency between the two types of banking (Abdul-Majid et al., 2005b; Bader, 2008; El-Gamal and Inanoglu, 2005; Hassan et al., 2009; Mokhtar et al., 2006); some studies (in some cases because the sample size is small) do not test whether observed differences in efficiency are significant (Al-Jarrah and Molyneux, 2005; Hussein, 2004; Said, 2012); one study claims
3 Although some studies suggest the opposite Rizvi, Syed Fawad ALi, 2001. Post-liberalisation efficiency and productivity of the banking sector in pakistan. The Pakistan Development Review, 40(4 Part II), 605-632, Sathye, Milind, 2001. X-efficiency in Australian banking: An empirical investigation. Journal of Banking and Finance, 25(3), 613-630, Sensarma, Rudra, 2006. Are foreign banks always the best? Comparison of state-owned and foreign banks in India. Economic Modelling, 23(4), 717-735, Sufian, Fadzlan, 2006. The efficiency of the Islamic banking industry in Malaysia: Foreign vs domestic banks. Review of Islamic Economics, 10(2), 27-53..
8
that Islamic banks are significantly more efficient than conventional banks, but results of significance tests are not shown and, in any case, the result is based on a sample which only contains 7 Islamic banks (Al-Muharrami, 2008). Only a small number of studies find, as expected a priori, that Islamic banks are significantly less efficient than conventional banks, but the reasons for the difference are not explored further (Mokhtar et al., 2007, 2008; Srairi, 2010).
One group of studies deserves particular mention because they make a distinction between ‘gross’ and ‘net’ efficiency (Abdul-Majid et al., 2008, 2010, 2011a, b; Johnes et al., 2009). Gross efficiency incorporates both managerial competence and efficiency arising from modus operandi; net efficiency isolates the managerial component and therefore provides a measure of managerial efficiency. In the context of banks in Malaysia, gross efficiency scores are derived from a SFA estimation of a cost function which makes no allowance for various characteristics of each bank (including whether or not it is Islamic), while net efficiency scores are estimated by taking into account the operating characteristics of banks in the SFA cost function (Abdul-Majid et al., 2008, 2011a, b). Gross efficiency is found to be highest for conventional banks and lowest for Islamic banks, and the significance of the Islamic dummy in the cost equation including the environmental variables suggests that this difference is significant. There are, however, only slight differences in net efficiency between the different types of banks. Another study, based on a sample of banks across 10 different countries, takes the analysis one step further by examining the determinants of net efficiency, and finds that the Islamic dummy is not a significant determinant (Abdul-Majid et al., 2010). These results offer evidence that any inferior performance of Islamic banks is mainly due to the constraints under which they operate rather than the shortcomings of their managers.
Johnes et al (2009) take a different approach by examining gross and net efficiency in the production context. They define gross efficiency as the efficiency score derived from the DEA output distance function estimated using all observations. Net efficiency, on the other hand, is derived from a DEA output distance function estimated relative only to banks of the same type. They find (like Abdul-Majid et al., 2008, 2011a, b) that gross efficiency is significantly higher amongst conventional relative to Islamic banks in their sample drawn from Gulf Cooperation Council (GCC) countries, while net
9
efficiency does not differ significantly between the two bank types. This also provides support for the hypothesis that the lower performance of Islamic banks is due to modus operandi rather than managerial incompetence.
These studies are interesting and offer a way forward in terms of isolating the underlying causes of the differing performance of Islamic and conventional banks. There is scope, however, for extending these studies by examining the factors underlying the gross and net efficiency scores. Thus, it is not enough to know whether it is modus operandi or managerial inadequacies which underpin a bank’s performance; bank managers need to know how and to what extent their behaviour can affect their efficiency. Thus a detailed second stage analysis of both gross and net efficiency scores is needed to provide this information.
4.
Sample data and modelsThe empirical analysis presented in this study is based on banks drawn from countries where at least 60% of the population is Muslim, and for which a complete set of data can be compiled, using the data source Bankscope, for the period 2004 to 2009. This is an interesting time period over which to undertake this study as it also allows us to gain insights into the effects of the macroeconomic turmoil and instability on the performance (or efficiency) of individual banks. Figures for 255 banks (210 conventional and 45 Islamic) across 19 countries4 are extracted in US dollars (USD) having been converted from own currencies by end of accounting year exchange rates. In addition, all variables are deflated to 2005 prices using appropriate deflators5. The banking sectors (conventional and Islamic) of the sample countries all follow standardized procedures in publishing financial data and adhere to the guidelines of the Basel II Framework. The number and type of banks included in the sample and population is shown in table 3.
Table 3
4 The sample of countries is similar (but not identical) to that used in some previous studies Bader, Mohammed Khaled I, 2008. Cost, revenue, and profit efficiency of Islamic versus conventional banks: international evidence using data envelopment analysis. Islamic Economic Studies, 15(2), 23-76, Hassan, M Kabir, 2005, The cost, profit and X-efficiency of Islamic banks, Paper presented at 12th ERF Annual
Conference, Hassan, M Kabir, 2006. The x-efficiency in Islamic banks. Islamic Economic Studies, 12(2), 49-78.. 5
These were calculated using data from World Development Indicators (WDI) and Global Development Finance (GDF).
10 4.1 Estimation of efficiencies
The choice of variables qualifying for the DEA model is guided by previous literature and data availability. We define bank output in accordance to the intermediation approach (Pasiouras 2006). We therefore assume the banks perform an intermediary role between borrowers and depositors and use deposits and short term funding, fixed assets, general and administration expenses and equity as inputs to produce total loans and other earning assets.
Islamic banks do not offer loans in the same way as conventional banks, and so the term ‘total loans’ is used to encompass the equity financing products they use. Conventional banks earn money from the spread between lending interest and borrowing interest rates. Islamic banks have a similar spread which is defined in terms of profit share ratios between the entrepreneurs (borrowers) and the depositors (lenders).
General and administration expenses are used as a proxy for labour input. While it may not be a perfect reflection of labour input, it is more easily available than better measures (e.g. employee numbers or expenditure on wages) and has been used in previous studies (e.g. Drake and Hall, 2003) where it is argued that personnel expenses make up a large proportion of general and administration expenses.
It has been suggested that an indicator of risk-taking should explicitly be incorporated into any model of banking efficiency (Charnes et al., 1990), and the variable equity is included to fulfil this role (Abdul-Majid et al., 2008; Alam, 2001; Mostafa, 2007). It is particularly important to incorporate a measure of risk-taking activity in the context of Islamic banking, where one would expect a difference in behaviour between Islamic and conventional banks (Sufian, 2006).
Descriptive statistics of the DEA variables are presented in table 4. Over the whole period of study, the typical conventional bank has just over US $6000 million in total loans and US $2500 million in other earning assets. These are 1.5 and 3 times the values for Islamic banks (respectively). There has been growth in these output variables in both banking sectors over the period but this has slowed down (understandably given the world economic climate) towards the end of the period. Input variables are typically up to twice as big in the conventional compared to the Islamic banking sector.
11 Table 4 4.2 Second stage analysis
In a second stage, an investigation of the possible determinants of the different types of efficiency scores (gross, net and type) of the banks is undertaken. We will divide these into two broad categories: the banking environment, over which managers have no control, is particularly relevant in cross-country studies, (Dietsch and Lozano-Vivas, 2000; Lozano-Vivas et al., 2002); and the characteristics of the individual banks. Five variables – sourced from World Development Indicators (WDI) and Global Development Finance (GDF) databases – are included to reflect the overall banking environment.
The normalised Herfindahl index6 (HHI). This variable reflects the competitive environment in which banks operate. The ‘quiet life’ theory suggests that increased industry concentration is related to lower technical efficiency as there is little incentive to be efficient when competition is low (Berger and Mester, 1997). The ‘efficiency hypothesis’, on the other hand, argues that concentration and efficiency are positively related. This might be because larger banks can attract high-calibre management and might be able to exploit economies of scale and scope; or it might be that some firms have superior efficiency (for example through 'uncertain imitability' - see Lippman and Rumelt, 1982) and this can lead to increased market concentration (Demsetz, 1973; Evanoff and Fortier, 1988; Smirlock, 1985). There is evidence from previous studies to support both the ‘quiet life’ theory (Staikouras et al., 2008; Yudistira, 2004) and the ‘efficiency hypothesis’ (Dietsch and Lozano-Vivas, 2000; Koutsomanoli-Filippaki et al., 2009).
The degree of market capitalization i.e. the percentage valuation of listed firms across all sectors relative to the country’s GDP (MCAP). This is included to reflect the level of stock
6The normalized Herfindahl index is
where HI is the Herfindahl index and N is the number of
firms. The normalised Herfindahl index ranges from 0 to 1 and gives lower rankings than the original
Herfindahl index for industries with small number of firms (Baks et al 2006) and hence it is more appropriate in the present context.
12
market activity in the economy, and its possible effect on bank efficiency is unknown a priori.
Growth in real GDP (GDPGR). This variable is included to capture the buoyancy of the economy in which the bank is located. Its precise effect on efficiency is ambiguous a priori, but previous evidence has shown a positive relationship between GDP growth and efficiency (Awdeh and El Moussawi, 2009; Staikouras et al., 2008)
Inflation (INF). This variable is also an indicator of the buoyancy of the economy. Precisely how it will affect efficiency is unknown a priori, and previous work has found that the inflation rate has no significant effect on efficiency (Awdeh and El Moussawi, 2009).
Per capita GDP (GDPPC). This variable reflects the level of institutional development and the supply and demand conditions in the market in which the bank is located. While previous evidence has shown a positive relationship between per capita income and costs (Dietsch and Lozano-Vivas, 2000), the precise effect of this variable on efficiency is ambiguous a priori.
Seven variables are included in the second stage analysis to reflect bank-level characteristics.
A binary variable to reflect whether the bank is operating under Islamic principles (ISLAMIC). The inclusion of this variable in the second stage is to assess whether any differences in efficiency remain after the economic environment and the bank’s own characteristics have been taken into account.
A dummy variable to reflect whether the bank is listed on the stock market (LIST). This variable has been found to have a positive effect on efficiency in the European context (Casu and Molyneux, 2000), but a negative effect in the context of Islamic banks (Yudistira, 2004).
An interaction term between ISLAMIC and LIST(ISLIST). This variable is included to capture the potentially different effects between Islamic and conventional banks of stock market listing on efficiency as discussed above.
The value of a bank’s assets (ASSETS). This variable is included to reflect bank size. Previous research examining the stability of banking suggests a non-linear relationship between bank
13
stability and size (Abdul-Majid et al., 2005b); we check for a non-linear relationship between efficiency and size by also including the square of ASSETS (ASSETSSQ).
The ratio of loan loss reserves to loans (LOANLOSS/LOANS). This variable acts as a proxy for credit risk (the higher the loan loss reserves ratio the lower the credit risk). In managing increasing credit risk, banks may incur additional expenses to monitor their loans (Barajas et al., 1999) which might lead to lower efficiency; on the other hand, a lower ratio has been
associated with increased profit margins (Miller and Noulas, 1997) and this may lead in turn to higher efficiency. Previous evidence finds no significant relationship between the ratio of loan loss reserves to loans and efficiency (Staikouras et al., 2008).
The ratio of total loans to assets (LOANS/ASSETS). Total loans is the sum of reserves for impaired loans (relative to non-performing loans) and net loans. The rationale for its inclusion is discussed in conjunction with the variable below.
The ratio of net loans to assets (NETLOANS/ASSETS). Net loans are derived by subtracting reserves for impaired loans (relative to non-performing loans) from total loans, and the variable is therefore related to the ratio of total loans to assets (LOANS/ASSETS) above. By including both variables we obtain the effect on efficiency of the components of total loans. Thus the sum of the coefficients on these two variables will reflect the effect on efficiency of net loans (relative to assets), and the coefficient on LOANS/ASSETS will indicate the effect on efficiency of the value of reserves for impaired loans (relative to non-performing loans): the greater are these reserves, the higher is the bank’s liquidity and hence the lower its exposure to defaults; on the other hand, the lower are the reserves, the higher are potential returns. Thus the potential overall effects of NETLOANS/ASSETS and LOANS/ASSETS on efficiency are unclear, a priori, although previous research has suggested a positive relationship between liquidity and efficiency in both Islamic and European banks (Hasan and Dridi, 2010).
Finally year dummies are included to allow for changes in efficiency over time (year dummies are used in preference to a trend variable in order to allow different effects on performance in different
14
years). In addition the interactions between the Islamic dummy and year dummies are included to examine whether Islamic and conventional banks have experienced different effects on their efficiency over the time period. Country dummies are included to allow for differences in efficiency between countries, perhaps because of regulatory or institutional variations, not captured by the other country level variables (this is in line with Pellegrina, 2008).
The performance of a second stage analysis of DEA efficiencies is often undertaken using a Tobit regression model (examples in the banking context include: Ariff and Can, 2008; Casu and Molyneux, 2003; Drake et al., 2006; Jackson and Fethi, 2000; Sufian, 2009a). The choice of a Tobit model is based on the premise that the dependent variable comprising DEA efficiency scores is a censored variable. In fact, recent literature argues that efficiency scores are not censored but are fractional data (McDonald 2009), thus making Tobit analysis inappropriate. Evidence from a comparison of various possible second stage approaches (Hoff 2007; McDonald 2009) suggests that ordinary least squares regression analysis (with White heteroscedastic-consistent standard errors) is the best second stage approach in terms of producing consistent estimators and valid (large sample) hypothesis tests which are robust to heteroscedasticity and the distribution of disturbances. Owing to the panel nature of the data here, we choose to use a (bank) random effects estimation approach with heteroscedasticity corrected standard errors.
We will therefore estimate, using random effects the following equation:
where denotes efficiency in bank i ( in country c at time t ( ) where separate equations are estimated for gross, net and type efficiency respectively;
is the intercept term and denotes the mean of the unobserved heterogeneity; and is the random heterogeneity specific to the ith bank and is constant over time; and is uncorrelated over time; is a Nx8 matrix of bank-level explanatory variables; is a Nx5 matrix of country-level explanatory variables; country dummies, year dummies, and interactions between the years and the Islamic dummy are also included in the equation.
15
Descriptive statistics of the second stage variables are presented in table 5. There are clear differences between Islamic and conventional banks in terms of these variables. Most notably Islamic banks are much smaller (less than half the size) and, through their country location, they face a much higher (nearly double) per capita GDP than their conventional counterparts. These differences between the two types of banks in terms of underlying factors of efficiency may therefore explain the differences in efficiency we have already observed between Islamic and conventional banks.
Table 5
5.
Results5.1 DEA efficiencies
The results of the DEA are derived using, respectively, constant returns to scale (CRS) and variable returns to scale (VRS) models and the software Limdep. The CRS efficiency results provide a measure of overall technical efficiency, while the VRS efficiencies measure pure technical efficiency (having factored out scale inefficiencies). A measure of scale efficiency can be obtained by calculating the ratio of CRS to VRS efficiency. In addition, the assumption is made that production conditions vary over time. Given the expanding populations and markets in many of the sample countries, this is likely to be a valid assumption. In practical terms, this means that the DEA is performed for each year separately7. Table 6 and Figure 3 display the DEA results based on the model identified in section 4.1.
Table 6 Results Figure 3
In terms of gross efficiency (table 6a and figure 3) there is little evidence to suggest significant differences in mean efficiency levels between conventional and Islamic banks – the non-parametric tests are significant only when all the efficiencies are pooled, and the parametric tests show no significant difference in efficiency at all. In the context of net efficiency (table 6b), however, Islamic
7
For comparison, the efficiencies were also generated on the assumption that production conditions do not vary over time. In practical terms, this means that the DEA is performed on the pooled data. Broad conclusions are identical to those reported here.
16
banks consistently have significantly higher average levels of efficiency than conventional banks – this is true when the efficiencies are pooled over time and for individual years, and using both parametric and non-parametric tests. Turning now to type efficiency (table 6c), we see that conventional banks have higher efficiency, on average, than the Islamic banks, and this difference is significant.
The implications of these results are that, when measured against a common frontier, each type of bank typically has the same level of efficiency; but, when measured against their own frontier, Islamic banks are more efficient, on average, than conventional banks. We can see how these results might be represented in a 2-dimensional situation by referring back to figure 2. The conventional banks are most closely represented by the crosses in figure 2, with a few highly efficient banks which determine the position of the overall efficiency frontier ABCDE, and plenty of other much less efficient banks. The Islamic banks, on the other hand, are most closely represented by the circles with many of the Islamic banks being located close to their own frontier (FGHIJ) and a few being highly inefficient. The average overall efficiency score is therefore similar for the two types of banks, but the net efficiency score is much higher, on average, amongst Islamic banks compared to conventional banks.
The results provide clear evidence that the Islamic banking regime is less efficient than the conventional one (in figure 2 frontier FGHIJ lies inside frontier ABCDE). This is in line with earlier conclusions derived using SFA and DEA (Abdul-Majid et al., 2008, 2011a; Johnes et al., 2009). The fact that the Islamic banking modus operandi is less efficient than its conventional counterpart comes as no surprise for a number of reasons. First an Islamic bank operates mainly with customised contracts which are either equity-type (profit and loss sharing) or services-type (leasing agreements, mark-up pricing sale). These contracts are tailor-made as many of the relevant parameters (such as maturity, repayments and collateral) are specific for every client. The bank, as the financer, needs to conduct a feasibility and profitability analysis for equity-type contracts; this is costly and time-consuming. Second an Islamic bank needs to gain approval for its financial products from the Shariah board of the bank. This is done for every Islamic bond issue (sukuk) and also for the majority of
17
equity-based contracts, although the fee-based contracts are more standardised and hence rarely require the approval of the Shariah board. Thus Islamic banks incur greater administration costs and higher operational risk than conventional banks.
An additional result found here, which is in contrast to Abdul-Majid et al. (2008; 2011a), is that the managers of Islamic banks appear to make up for the disadvantages of their banking regime by being more efficient than their counterparts in conventional banks. We will discuss this result further in the following section.
5.2 Panel data analysis of efficiencies
The analysis of differences between Islamic and conventional banks in terms of their gross, net and type efficiencies is somewhat simplistic as it looks only at bank type as a cause of inter-bank disparities. We use econometric techniques to investigate the causes of inter-bank variations in efficiency and to assess whether, having taken various environmental and bank-specific characteristics into account, bank type (Islamic or conventional) is still a significant factor underlying gross, net and type efficiency levels. The results of the panel data analysis are presented in table 7.
Table 7
The main finding from this second stage analysis is that, having taken into account a range of macroeconomic and bank-level variables the distinctions between Islamic and conventional banks found in section 5.1 still remain. Thus there is no significant difference between Islamic and conventional banks in terms of gross efficiency; the net efficiency of Islamic banks is significantly higher (by 0.07) than in conventional banks, while type efficiency is lower (by 0.06) for Islamic banks than conventional banks. Thus the Islamic method of banking (with its compliance with Shariah law) results in lower efficiency than conventional banking, but the managers of the Islamic banks make up for this disadvantage, and this is the case even after taking into account other environmental and bank-level characteristics. The efforts of the managers of Islamic banks in terms of recouping efficiency lost due to modus operandi is an interesting finding and is in contrast to reports from the late 1990s which suggested that the managers of Islamic banks were lacking in training (Iqbal et al., 1998). It seems therefore that the expansion of demand in Islamic financial products has coincided
18
with an improvement in managerial efficiency. Why has this happened? Clearly operating with tailor-made financial products (as in Islamic banks) requires considerable human input, and so Islamic banks have spent more on human resources than conventional banks in order to emphasise reputation, trust and interpersonal relationships (Pellegrina, 2008). In addition, education and knowhow in the context of Islamic finance has increased in recent years (and specifically over the period of the study) and as a consequence is promoted to the general public using, for example, marketing campaigns8. These may therefore have contributed to an increase in managerial efficiency within Islamic banks.
Some other results in table 7 are worthy of further discussion. The only variable significant in explaining all three types of efficiency is size: increasing size initially decreases efficiency (all types) but beyond an asset value of around $35 ($45) billion gross and net (type) efficiency increase with size. Given that mean size is around $7 billion, many banks (and nearly all Islamic banks) experience the negative relationship between efficiency and size.
A number of variables are significant in explaining gross and net but not type efficiency. A bank which is listed has lower gross and net efficiency (by 0.04) than one which is not, and this confirms an earlier result in the context of Islamic banks (Yudistira, 2004). It should be noted that being listed adversely affects type efficiency only in the case of Islamic banks.
The ratio of loans to assets and the ratio of net loans to assets are the two remaining bank-level variables which significantly affect gross and net efficiency, the former positively and the latter negatively. These results need to be considered together since total loans are the sum of net loans and reserves for impaired loans (relative to non-performing loans). Thus the coefficient on the ratio of loans to assets reflects the effect of holding reserves for impaired loans on efficiency: in this case the higher the reserves (and hence the higher the protection for the bank from bad loans) the higher is efficiency. Thus banks which behave prudently in terms of insuring against bad loans reap rewards in terms of higher efficiency. The sum of the two coefficients suggests that the size of net loans has little effect on efficiency.
8
To this end, Bank Syariah Mandiri in Indonesia sponsors documentaries on Islamic finance while Emirates Bank in the UAE waives loan payments during the Ramadan as part of marketing campaigns (Bloomberg).
19
Turning now to the macroeconomic (country-level) variables we can see that three of these are significant in the net and gross efficiency equations at the 5% significance level. First, the significantly negative coefficient on HHI provides support for the ‘quiet life’ hypothesis. Second, increasing GDP growth is associated with higher efficiency (gross and net) as expected. Third, a higher inflation rate leads to lower efficiency, presumably through the instability in the economy which this suggests. A fourth country-level variable is worthy of mention: a higher level of market capitalization (and hence stock market activity) leads to lower gross and net efficiency and this is significant at the 10% significance level. Finally, four of the country dummies are also significant in the gross and net efficiency equations. Bangladesh, Egypt, and Indonesia, have significantly higher gross and net efficiency, while Qatar has significantly lower gross and net efficiency than other countries. The relatively efficient performance of Bangladesh, Egypt and Indonesia could be a consequence of their large populations (they have three of the four largest populations in the sample – see table 3). This may result in increased standardisation of banking products (even within the Islamic banks) which leads in turn to increased efficiency. Qatar, on the other hand, has one of the two smallest populations in the sample. Qatar (along with the UAE) has also been adversely hit by a decline in the real estate market (Iqbal et al., 1998) and this may have had an unfavourable effect on the efficiency of its banks.
Finally, the year fixed effects indicate that, compared with the first year of the study (2004) all years have seen significantly lower gross efficiency, with 2008 seeing the worst performance. This pattern is the same for conventional and Islamic banks. The time pattern of net efficiency, on the other hand, differs between Islamic and conventional banks. Conventional banks have seen increasing falls in net efficiency (relative to 2004) with the nadir being in 2008; there is an improvement in 2009, but the position is still low relative to 2004. Islamic banks have seen fall in efficiency between 2005 and 2007, but these are much smaller than for conventional banks. Moreover, Islamic banks have actually seen a slight increase in efficiency (relative to 2004) in 2008 and 2009. Managers of Islamic banks seem therefore to have coped with the 2008 crisis better than managers of conventional banks. However, the crisis has had an adverse effect on type efficiency but only in Islamic banks:
20
thus the gap between the Islamic and conventional production possibility frontiers (see figure 2) has widened in the year before, the year of and the year following the 2008 crisis. The patterns over time observed in figure 3 therefore largely remain even after taking into account other variables. The result regarding the effect of the crisis on type efficiency in particular is interesting and is in contrast to the view of Islamic banks as reliable performers over the period of crisis.
6.
ConclusionThe purpose of this paper has been to provide an in-depth analysis using DEA of a consistent sample of Islamic and conventional banks located in 19 countries over the period 2004 to 2009. The DEA results provide evidence that there are no significant differences in gross efficiency (on average) between conventional and Islamic banks. This result is in line with a number of previous studies (Bader, 2008; El-Gamal and Inanoglu, 2005; Hassan et al., 2009; Mokhtar et al., 2006).
By using a meta-frontier analysis new to the banking literature we have been able to decompose gross efficiency into two components: net efficiency provides a measure of managerial competence, while type efficiency indicates the effect on efficiency of modus operandi, and by doing this we have discovered that this result of no significant difference in efficiency between banking types conceals some important distinctions. First, the type efficiency results provide strong evidence that Islamic banking is less efficient, on average, than conventional banking. Second, net efficiency is significantly higher, on average, in Islamic compared to conventional banks suggesting that the managers of Islamic banks are particularly efficient given the rules by which they are constrained. Thus the Islamic banking regime is inefficient, but the managers of Islamic banks make up for this disadvantage.
Finally, a second stage analysis investigates whether these distinctions (in terms of efficiency) between Islamic and conventional banks are a consequence of banking environment or bank-level characteristics. Thus we investigate the determinants of the components of efficiency as well as gross efficiency in order to provide more information to managers and policy-makers regarding ways of improving efficiency. The panel data analysis confirms the earlier results: the modus operandi of Islamic banks leads to lower efficiency in these banks compared to conventional banks, but the
21
significantly superior efficiency of the managers of the Islamic banks more than makes up for the disadvantages of banking regime, and this is the case even after taking into account other factors. Thus each type of banking could learn from the other: conventional banks could look to the skills and training of managers in Islamic banks in order to improve their own efficiency; Islamic banks need to consider how to make their banking regime more efficient – possibly by standardizing their portfolio of products as in conventional and the larger Islamic banks.
Are there other ways in which banks can improve their performance? Despite the importance of the country level variables over which bank managers have no control, the second stage results suggest some ways in which banks can operate more efficiently. Gross, net and type efficiency, for example, can be boosted by increasing the size of banks. The relationship between efficiency and bank size is quadratic, and most banks in the sample are operating on the downward sloping part of the function. Managers should also take note of the beneficial effects on efficiency of prudent behaviour in terms of holding reserves relative to non-performing loans.
Finally, in a period of financial turmoil, the banks in this sample have typically suffered falls in their gross efficiency relative to the start of the period. The year 2008 had a particularly bad impact on gross efficiency, but there has been a limited recovery in 2009. An examination of the components of gross efficient indicates, however, that the managers of Islamic banks have coped with the crisis better than those of conventional banks, but that the gap between the conventional and Islamic production possibility frontier has widened during this same period This suggests that the efficiency advantage of the conventional over the Islamic operating regime has increased during the period of financial turmoil. It is therefore crucial for Islamic banks to shift to a more standardized regime if they are to improve their efficiency in the face of future crises.
22 Figure 1
a) Theoretical measurement of efficiency
c) DEA estimated production possibility frontier
b) SFA estimated production possibility function
23 Figure 3: DEA efficiencies for the sample banks – mean values 2004 to 2009
Gross CRS efficiency Gross VRS efficiency Gross SE efficiency
Net CRS efficiency Net VRS efficiency Net SE efficiency
Type CRS efficiency Type CRS efficiency
0.75 0.80 0.85 0.90 0.95 1.00 2004 2005 2006 2007 2008 2009 Conventional Islamic 0.75 0.80 0.85 0.90 0.95 1.00 2004 2005 2006 2007 2008 2009 Conventional Islamic 0.75 0.80 0.85 0.90 0.95 1.00 2004 2005 2006 2007 2008 2009 Conventional Islamic 0.75 0.80 0.85 0.90 0.95 1.00 2004 2005 2006 2007 2008 2009 Conventional Islamic 0.75 0.80 0.85 0.90 0.95 1.00 2004 2005 2006 2007 2008 2009 Conventional Islamic 0.75 0.80 0.85 0.90 0.95 1.00 2004 2005 2006 2007 2008 2009 Conventional Islamic 0.80 0.85 0.90 0.95 1.00 2004 2005 2006 2007 2008 2009 Conventional Islamic 0.75 0.80 0.85 0.90 0.95 1.00 2004 2005 2006 2007 2008 2009 Conventional Islamic
24
Table 1: Summary of bank efficiency studies by country of study
Country Studies
North America
USA (Alam, 2001; Bauer et al., 1998; Berger and Humphrey, 1991; Berger and Mester, 2003; Devaney and Weber, 2000; Fung, 2006; Mester, 1996, 1997; Miller and Noulas, 1996; Peristiani, 1997; Seiford and Zhu, 1999; Thompson et al., 1997; Wheelock and Wilson, 1999)
Canada (Paradi et al., 2012; Schaffnit et al., 1997) Central and Latin America
Cross-country (Carvallo and Kasman, 2005)
Mexico (Taylor et al., 1997)
Nordic countries
Cross-country (Berg et al., 1992)
Norway (Berg et al., 1993)
Finland (Kolari and Zardkoohi, 1990)
Western Europe
Cross-country (Altunbas and Chakravarty, 1998; Altunbas et al., 2001; Altunbas et al., 1999; Beccalli, 2007; Bikker, 2001; Bos and Schmiedel, 2007; Brissimis et al., 2010; Carbó-Valverde et al., 2007; Carbo et al., 2002; Casu et al., 2011; Casu and Giradone, 2004, 2006; Casu et al., 2004; Casu and Molyneux, 2003; Dietsch and Lozano-Vivas, 2000; Lozano-Vivas et al., 2002; Maudos et al., 2002; Murillo-Melchor et al., 2009; Olgu and Weyman-Jones, 2008; Weill, 2004, 2008)
Cyprus (Soteriou and Zenios, 1999)
Germany (Bos et al., 2005; Fiorentino et al., 2006; Koetter, 2008)
Greece (Athanassopulos, 1997; Halkos and Salamouris, 2004; Lovell and Pastor, 1997; Pasiouras, 2008; Rezitis, 2008)
Italy (Casolaro and Gobbi, 2007; Favero and Papi, 1995; Resti, 1997) The Netherlands (Bos and Kool, 2002, 2006)
Portugal (Camanho and Dyson, 2003; Canhoto and Dermine, 2003; Mendes and Rebelo, 1999) Spain (Cuesta and Orea, 2002; Cuesta and Zofío, 2005; Dietsch and Lozano-Vivas, 2000; Färe
et al., 2006; Grifell-Tatjé and Lovell, 1996, 1997; Illueca and Pastor, 2005; Lozano-Vivas, 1997; Prior, 2003)
Switzerland (Rime and Stiroh, 2003)
UK (Drake, 1992, 2001; Drake and Simper, 2002; Drake and Weyman-Jones, 1992;
Matthews et al., 2007b; McKillop et al., 2002) Central & Eastern Europe (transition economies)
Cross-country (Anayiotos et al., 2010; Bonin et al., 2005; Brissimis et al., 2008; Fries and Taci, 2005; Grigorian and Manole, 2006; Kasman and Yildrim, 2006; Koutsomanoli-Filippaki et al., 2009; Staikouras et al., 2008; Weill, 2002, 2003; Yildirim and Philippatos, 2007)
Hungary (Hasan and Marton, 2003)
Russia (Karas, 2010; Styrin, 2005; Vernikov, 2010)
Kyrgyzstan (Brown et al., 2009)
Poland (Havrylchyk, 2006)
Croatia (Jemric and Vujcic, 2002)
Africa
Nigeria (Zhao and Murinde, 2011)
Tunisia (Chaffai, 1997)
Sudan (Hassan and Hussein, 2003; Saaid, 2005; Saaid et al., 2003) Middle East
Cross-country (Middle East and Africa)
(Al-Jarrah and Molyneux, 2005; Ben Naceur et al., 2009; Hassan et al., 2009) Cross-country (Middle East) (Al-Muharrami, 2008; Ariss et al., 2007; El Moussawi and Obeid, 2011; Hassan et al.,
2009; Mostafa, 2007, 2011; Perera et al., 2007; Ramanathan, 2007)
Bahrain (Hussein, 2004)
Turkey (El-Gamal and Inanoglu, 2005; Fukuyama and Matousek, 2011; Isik and Hassan, 2002a, b, 2003a, b; Jackson and Fethi, 2000; Jackson et al., 1998)
25 Table 1 (continued)
Austral-Asia Cross-country (Middle East,
Africa and Asia)
(Abdul-Majid et al., 2010; Bader, 2008; Brown, 2003; Hassan, 2006; Hassan and Bashir, 2005; Srairi, 2010; Sufian, 2009a; Viverita et al., 2007; Yudistira, 2004)
Cross-country (Middle East and Asia)
(Grigorian and Manole, 2005)
Cross-country (Asia) (Abd Karim et al., 2010; Abd Karim, 2001; Heffernan and Fu, 2010)
Australia (Avkiran, 1999; Esho, 2001; Garden and Ralston, 1999; Neal, 2004; Paul and Kourouche, 2008; Ralston et al., 2001; Sathye, 2001; Sturm and Williams, 2004, 2008, 2010; Worthington, 1999a, b, 2004)
China (Ariff and Can, 2008; Chen et al., 2005; Fu and Heffernan, 2007; Jiang et al., 2009; Lin and Zhang, 2009; Matthews et al., 2007a; Sufian, 2009b)
Hong Kong (Drake et al., 2006; Kwan, 2006)
India (Bhattacharyya et al., 1997; Das and Kumbhakar, 2010; Debnath and Shankar, 2008; Kumar and Gulati, 2008, 2009; Sathye, 2003; Sensarma, 2006; Zhao et al., 2008) Japan (Altunbas et al., 2000; Assaf et al., 2011; Barros et al., 2009; Drake and Hall, 2003; Drake
et al., 2009; Fukuyama and Weber, 2002; Uchida and Satake, 2009)
Korea (Banker et al., 2010; Park and Weber, 2006)
Malaysia (Abdul-Majid et al., 2005a, b; Abdul-Majid et al., 2008, 2011a, b; Kamaruddin et al., 2008; Matthews and Ismail, 2006; Mokhtar et al., 2006; Mokhtar et al., 2007, 2008; Sufian, 2006, 2006/2007, 2007)
Pakistan (Rizvi, 2001)
Singapore (Rezvanian and Mehdian, 2002)
Taiwan (Chen, 2001; Ho and Zhu, 2004; Hsiao et al., 2010; Huang and Wang, 2002; Kao and Liu, 2009; Yang and Liu, 2012)
International Cross-country (across all
regions)
26
Table 2: Islamic banking efficiency studies (frontier estimation approach)
Context Method Studies
No significant difference in efficiency between Islamic and conventional banks 21 countries: Algeria; Bahrain; Bangladesh; Brunei; Egypt; Gambia;
Indonesia; Jordan; Kuwait; Lebanon; Malaysia; Pakistan; Qatar; Saudi Arabia; Senegal; Tunisia; Turkey; Yemen; Sudan; Iran; United Arab Emirates
DEA (Bader, 2008)
11 countries: Egypt; Bahrain; Tunisia; Jordan; Kuwait; Lebanon; Qatar; Saudi Arabia; Turkey; United Arab Emirates; Yemen
DEA (Hassan et al., 2009)
5 countries: Bahrain; Kuwait; Qatar; UAE; Singapore DEA (Grigorian and Manole, 2005)
Malaysia SFA (Mokhtar et al., 2006)
Turkey SFA (El-Gamal and Inanoglu, 2005)
Islamic banks are significantly more efficient than conventional banks
GCC: Bahrain; Kuwait; Oman; Qatar; Saudi Arabia; UAE DEA (Al-Muharrami, 2008) Islamic banks are significantly less efficient than conventional banks
GCC: Bahrain; Kuwait; Oman; Qatar; Saudi Arabia; UAE SFA (Srairi, 2010)
Malaysia DEA (Mokhtar et al., 2007, 2008)
Islamic banks have (significantly) lower efficiency than conventional banks and it is predominantly a consequence of
modus operandi rather than managerial inadequacies 10 countries: Bahrain; Bangladesh; Indonesia; Iran; Jordan; Lebanon;
Malaysia; Sudan; Tunisia; Yemen;
SFA (Abdul-Majid et al., 2010) GCC: Bahrain; Kuwait; Oman; Qatar; Saudi Arabia; UAE DEA (Johnes et al., 2009)
Malaysia SFA (Abdul-Majid et al., 2008, 2011a, b)
The efficiency of Islamic and conventional banks is compared, but the significance of any difference is not tested Cross-country: Conventional banks in the USA and randomly drawn Islamic
banks
DEA (Said, 2012)
4 countries: Jordan; Egypt; Saudi Arabia; Bahrain SFA (Al-Jarrah and Molyneux, 2005)
Bahrain SFA (Hussein, 2004)
Studies of Islamic banks only 21 countries: Algeria; Bahamas; Bahrain; Bangladesh; Brunei; Egypt;
Gambia; Indonesia; Iran; Jordan; Kuwait; Lebanon; Malaysia; Mauritania; Qatar; Saudi Arabia; Sudan; Tunisia; UAE; UK; Yemen
SFA DEA
(Hassan, 2005, 2006)
16 countries: Bahrain; Bangladesh; Egypt; Gambia; Indonesia; Iran; Kuwait; Malaysia; Pakistan; Saudi Arabia; Turkey; UAE; Qatar; South Africa; Sudan; Yemen
DEA (Sufian, 2009a)
12 countries: Algeria; Bahrain; Egypt; Gambia; Indonesia; Jordan; Kuwait; Malaysia; Qatar; Sudan; UAE; Yemen
DEA (Yudistira, 2004) 13 countries: Algeria; Bahrain; Bangladesh; Brunei; Egypt; Indonesia;
Jordan; Kuwait; Malaysia; Qatar; Sudan; UAE; Yemen
DEA (Viverita et al., 2007) 14 countries: Algeria; Bahamas; Bangladesh; Bahrain; Brunei; Egypt;
Jordan; Kuwait; Malaysia; Qatar; Saudi Arabia; Sudan; UAE; Yemen
DEA (Brown, 2003)
GCC: Bahrain; Kuwait; Oman; Qatar; Saudi Arabia; UAE DEA (El Moussawi and Obeid, 2010, 2011; Mostafa, 2007, 2011)
Malaysia DEA (Kamaruddin et al., 2008; Sufian,
2006*; Sufian, 2006/2007*; Sufian, 2007*)
Sudan SFA (Hassan and Hussein, 2003; Saaid,
2005; Saaid et al., 2003)
27 Table 3: Banks in the sample and population by country and type
Sample Banks Population Banks (2009) Total Pop
2009
Proportion Muslim
Country Islamic Conventional Total Islamic Conventional Total
Albania 0 3 3 0 5 5 3,192,723 0.80 Bahrain 9 6 15 19 10 29 1,169,578 0.81 Bangladesh 1 27 28 3 30 33 147,030,145 0.90 Brunei 0 1 1 1 1 2 391,837 0.67 Egypt 2 20 22 2 22 24 79,716,203 0.95 Indonesia 1 35 36 1 49 50 237,414,495 0.88 Jordan 2 11 13 3 11 14 5,915,000 0.98 Kuwait 3 6 9 9 7 16 2,646,286 0.95 Malaysia 2 21 23 17 48 65 27,949,395 0.60 Mauritania 1 2 3 1 8 9 3,377,630 0.99 Pakistan 3 16 19 9 29 38 170,494,367 0.96 Palestine 1 1 2 1 2 3 4,043,218 0.98 Qatar 2 5 7 5 7 12 1,597,765 0.78 Saudi Arabia 1 9 10 3 11 14 26,809,105 0.97 Sudan 5 1 6 12 15 27 42,478,309 0.71 Tunisia 1 9 10 1 17 18 10,439,600 1.00 Turkey 2 20 22 9 27 36 71,846,212 0.98 UAE 6 13 19 9 16 25 6,938,815 0.76 Yemen 3 4 7 4 4 8 23,328,214 0.99
28 Table 4: Descriptive statistics for the DEA input and output variables
Conventional Islamic All
2004 Mean Median SD Mean Median SD Mean Median SD
Total loans 5109 3213 4123 3776 2811 3310 4874 3099 4018
Other earning assets 2329 435 4520 543 200 931 2014 377 4175
Deposits and short-term funding 4566 1167 7359 1697 478 3596 4060 1062 6928
General and administrative expenses 156 29 607 40 19 71 135 26 533
Equity 1012 554 1065 693 521 540 956 550 999
Fixed assets 106 21 374 33 13 65 93 16 342
2005 Mean Median SD Mean Median SD Mean Median SD
Total loans 5468 3292 4641 3975 2872,90 3544 5205 3197 4497
Other earning assets 2425 567 4716 619 265 1013 2107 462 4354
Deposits and short-term funding 4879 1362 7730 1878 652 3717 4349 1128 7271
General and administrative expenses 144 31 479 51 26 80 128 30 437
Equity 1070 578 1127 747 552 652 1013 568 1065
Fixed assets 90 24 287 38 14 77 81 18 263
2006 Mean Median SD Mean Median SD Mean Median SD
Total loans 5875 3491 5244 4034 2947 3126 5550 3345 4982
Other earning assets 2585 651 4836 885 274 1462 2285 523 4476
Deposits and short-term funding 5353 1486 8386 2084 643 3908 4776 1358 7879
General and administrative expenses 142 42 306 62 28 100 128 37 282
Equity 1116 605 1192 846 548 864 1068 598 1144
Fixed assets 88 25 276 64 14 184 84 22 262
2007 Mean Median SD Mean Median SD Mean Median SD
Total loans 6480 3595 6179 4389 3113 3756 6111 3443 5874
Other earning assets 2804 687 5305 996 342 1762 2485 614 4917
Deposits and short-term funding 6164 1780 9616 2524 912 4643 5522 1596 9042
General and administrative expenses 168 44 400 74 30 114 152 41 368
Equity 1232 655 1431 964 606 1042 1185 652 1373
Fixed assets 97 28 297 75 15 191 93 26 281
2008 Mean Median SD Mean Median SD Mean Median SD
Total loans 6527 3562 6257 4579 3112 3958 6184 3423 5957
Other earning assets 2342 541 4311 961 318 1622 2098 507 4003
Deposits and short-term funding 5824 1612 9094 2697 1151 4863 5272 1562 8578
General and administrative expenses 150 41 313 79 37 113 137 41 289
Equity 1147 631 1217 946 594 966 1111 621 1178
29
2009 Mean Median SD Mean Median SD Mean Median SD
Total loans 7259 3560 7655 5081 3227 5136 6875 3520 7313
Other earning assets 3037 655 6173 1245 533 2165 2721 606 5713
Deposits and short-term funding 7041 1738 11695 3337 1112 6272 6387 1634 11016
General and administrative expenses 178 48 377 104 41 168 165 47 351
Equity 1402 666 1709 1083 622 1280 1346 662 1644
Fixed assets 103 37 265 105 22 283 104 34 268
All Years Mean Median SD Mean Median SD Mean Median SD
Total loans 6120 3453 5835 4306 2954 3850 5799 3338 5579
Other earning assets 2587 584 5012 875 313 1556 2285 518 4641
Deposits and short-term funding 5638 1551 9113 2370 799 4584 5061 1362 8581
General and administrative expenses 156 42 426 68 29 113 141 38 391
Equity 1163 615 1312 880 561 925 1113 601 1257
Fixed assets 95 28 291 66 15 186 90 25 276
30 Table 5: Descriptive statistics for the second stage explanatory variables
Conventional Islamic All
2004 Mean Median SD n Mean Median SD n Mean Median SD n
ASSETS 5.045 1.333 8.066 210 1.783 0.578 3.642 45 4.470 1.148 7.575 255 LOANLOSS/LOANS 7.577 4.692 8.209 208 6.366 3.765 9.175 32 7.415 4.615 8.334 240 LOANS/ASSETS 0.503 0.520 0.176 210 0.491 0.550 0.243 45 0.501 0.520 0.189 255 NETLOANS/ASSETS 0.506 0.518 0.166 210 0.483 0.548 0.237 45 0.502 0.523 0.180 255 HHI 0.142 0.111 0.079 210 0.199 0.185 0.110 45 0.152 0.111 0.088 255 MCAP 74.426 69.370 74.093 199 60.091 38.520 63.588 36 72.230 69.370 72.641 235 GDPGR 6.936 6.270 2.879 210 7.492 6.040 3.610 45 7.034 6.270 3.020 255 INF 8.212 8.550 3.734 210 9.866 9.150 4.839 45 8.504 8.550 3.991 255 GDPPC 6.970 1.250 11.048 210 13.058 6.342 14.064 45 8.044 2.200 11.836 255
2005 Mean Median SD n Mean Median SD n Mean Median SD n
ASSETS 6.029 1.683 9.626 210 2.351 0.842 4.630 45 5.380 1.505 9.052 255 LOANLOSS/LOANS 6.550 3.559 7.730 209 3.683 3.146 2.872 34 6.148 3.517 7.313 243 LOANS/ASSETS 0.521 0.540 0.174 210 0.493 0.540 0.231 45 0.517 0.540 0.185 255 NETLOANS/ASSETS 0.525 0.545 0.164 210 0.493 0.542 0.231 45 0.520 0.545 0.177 255 HHI 0.134 0.101 0.073 210 0.188 0.168 0.106 45 0.144 0.104 0.082 255 MCAP 114.625 81.430 134.196 199 107.513 79.670 122.095 36 113.535 81.430 132.191 235 GDPGR 6.414 5.960 1.596 210 7.230 7.800 1.537 45 6.558 5.960 1.613 255 INF 9.736 7.030 6.086 210 12.473 11.130 6.278 45 10.219 7.080 6.196 255 GDPPC 7.248 1.304 11.326 210 13.641 6.786 14.456 45 8.376 2.326 12.154 255
2006 Mean Median SD n Mean Median SD n Mean Median SD n
ASSETS 7.231 2.039 11.298 210 3.063 1.072 5.707 45 6.495 1.888 10.639 255 LOANLOSS/LOANS 6.049 3.181 7.404 208 4.023 3.155 3.770 37 5.743 3.162 7.010 245 LOANS/ASSETS 0.531 0.550 0.173 210 0.464 0.510 0.216 45 0.519 0.550 0.183 255 NETLOANS/ASSETS 0.533 0.554 0.165 210 0.463 0.514 0.214 45 0.521 0.547 0.176 255 HHI 0.135 0.096 0.082 210 0.183 0.162 0.102 45 0.143 0.104 0.088 255 MCAP 110.893 128.940 86.146 199 88.507 61.560 77.419 36 107.464 128.940 85.095 235 GDPGR 6.541 6.405 2.453 210 7.383 6.700 3.770 45 6.690 6.630 2.742 255 INF 9.896 9.490 4.780 210 11.280 10.390 4.975 45 10.140 10.390 4.834 255 GDPPC 7.592 1.359 11.803 209 14.538 7.162 15.092 44 8.800 2.625 12.681 253