Data Visualization Tools for WSNs: A Glimpse
Bhawana Parbat
School of Studies in C.Sc. & I.T. Pt. Ravishankar Shukla University,Raipur (C.G.), India - 492010
A.K. Dwivedi
School of Studies in C.Sc. & I.T. Pt. Ravishankar Shukla University,Raipur (C.G.), India - 492010
O.P. Vyas
Indian Institute of Information Technology, Allahabad (IIIT-A) Deoghat, Jhalwa,U.P., India-211012
ABSTRACT
Wireless Sensor Network (WSN) is an emerging area of research. With the increase in applications for sensor networks, managing sensed data volume, monitoring wireless sensor node‟s health, data manipulation and representation presents a variety of challenges and has become a vital component of sensor networks. In this critical context visualization is a key issue to develop and operate these networks. The objective of this contribution is to present a detailed survey on various data visualization tools available for WSNs. In this contribution total 19 data visualization tools are presented that is especially designed and developed for Wireless sensor Networks.
Categories and Subject Descriptors
D.2.11 [Software Architectures]: Languages (e.g., description, interconnection, definition)
K.6.3 [Software Management]: Software selection
General Terms
Wireless Sensor Networks, Data Visualization et. al.
Keywords
Wireless Sensor Networks, Data Visualization Tools, Data Gathering, Stream Data, Motes.
1.
INTRODUCTION
WSNs employ a large number of miniature autonomous devices with sensors embedded in them known as sensor nodes to form the network without the aid of any established infrastructure. In a wireless sensor system, the individual nodes are capable of sensing their environments, processing the information locally, or sending it to one or more collection points through a wireless link. Each node has a short-range transmission due to low RF transmit power. Wireless Sensor Networks (WSNs) offer great promise for information capture and processing in both indoor and outdoor applications.
Data emitted by individual sensor nodes is collected by gateway and forwarded to a machine called base station/sink. It can then be passed via Internet connectivity to the visualization software (tool) on a potentially remote machine. Visualization plug-ins can register to different data types, and visualize the information using a flexible multi-layer mechanism that renders the information on a canvas. Developers can easily adapt existing or develop new custom tailored plug-ins for their specific visualization needs and applications.
In a research contribution [2] three principle ways are presented that it needed for well performing of a good WSN monitoring tool, these are:
Needs to be responsive and sift through the data quickly. Must provide a meaningful assessment of the health and
status of the network.
Must make data from the sensor network available to the user and present that information in the most effective and functional way possible.
2.
PROBLEM FORMATION
The data gathered from wireless sensor networks is usually saved in the form of numerical form in a central base station. There are many programs that facilitate the viewing of these large amounts of data. After studying and evaluating a number of research papers it has be found that most research paper for WSNs are based on simulation, routing protocols, architectures, data gathering, sensor data mining, security issues etc., but there is no any research paper or literature available that fully presents or focused on data visualization tools for WSNs. The main goal of this contribution is to present a detailed survey on data visualization tools that are used to visualize the data gathered via WSNs with highlighting each ones pros and cons in terms of their popularity, simplicity, data visualizing support, portability, extendibility, GUI support etc.
3.
DATA VISUALIZATION TOOLS FOR
WSNs
In this section total 19 data visualization tools are presented that is especially designed and developed for Wireless sensor Networks. Ample description of 7 most popularly used WSN‟s data visualization tools is first presented and finally remaining 12 data visualization tools are presented in summarized way.
3.1 SpyGlass
[1]
With the SpyGlass sensor network visualizer, aim is to ease the life for sensor network debugging, evaluation and deeper understanding of the software by visualizing the sensor network, its topology, the state and the sensed data. A few tools exist which cover some aspects of sensor network data display and visualization.
3.1.1 SpyGlass Features
SpyGlass has a very flexible drawing and plug-in architecture.
Most of its inner components can be exchanged or extended easily.
SpyGlass is a modular application that already has time shifting abilities.
The plug-ins is not directly drawing on the canvas, but instead they use a set of drawing primitives available in SpyGlass.
SpyGlass can not only be used for visualizing wireless sensor networks that are currently in operation. It is also able to record activities going on at a certain point of time, and playing it back later, for seeing it again or watching it at a different speed, similar to slow motion or fast forward.
Whenever a sensor network is visualized, the user can select to additionally record all the information arriving at the visualization component.
This even allows for developing special visualization plug-ins to show interesting details that were not recognizable during the actual visualization run.
3.1.2 SpyGlass Architecture
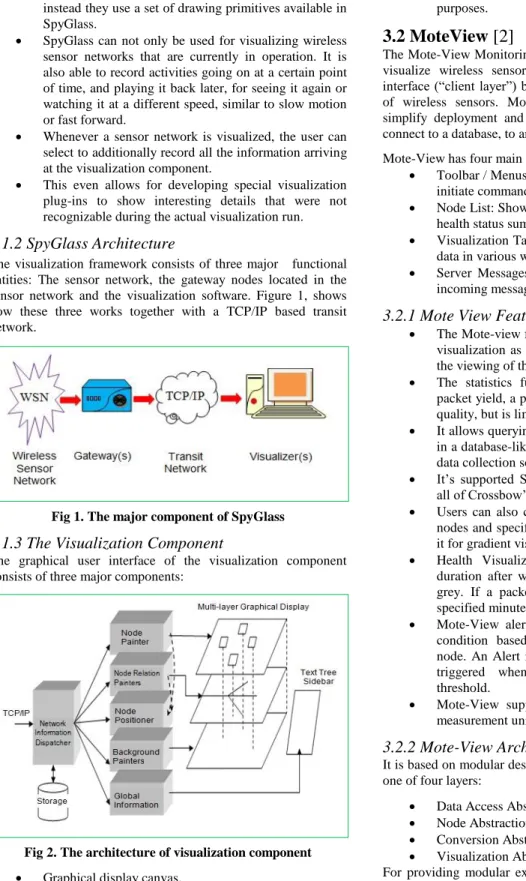
The visualization framework consists of three major functional entities: The sensor network, the gateway nodes located in the sensor network and the visualization software. Figure 1, shows how these three works together with a TCP/IP based transit network.
Fig 1. The major component of SpyGlass
3.1.3 The Visualization Component
The graphical user interface of the visualization component consists of three major components:
Fig 2. The architecture of visualization component Graphical display canvas.
Sidebar for tree-structured textual information on the network as a whole.
Display for line-based output, e.g., for debugging purposes.
3.2 MoteView
[2]
The Mote-View Monitoring Software is a Crossbow‟s product to visualize wireless sensor networks. It is designed to be an interface (“client layer”) between a user and a deployed network of wireless sensors. Mote-View provides users the tools to simplify deployment and monitoring. It also makes it easy to connect to a database, to analyze, and to graph sensor readings. Mote-View has four main user interface sections:
Toolbar / Menus: Allows the user to specify actions and initiate command dialogs.
Node List: Shows all known nodes in a deployment and health status summary.
Visualization Tabs: Enables the user to view the sensor data in various ways.
Server Messages: Displays a log of server events and incoming messages.
3.2.1 Mote View Features
The Mote-view features topology and network statistics visualization as well as logging of sensor readings and the viewing of the logged data.
The statistics function includes the end-to-end data packet yield, a prediction for the future and the RF link quality, but is limited to these features.
It allows querying the sensor network for collected data in a database-like manner, hiding the distribution of the data collection software on the sensor nodes.
It‟s supported Sensor Boards and Mote Platforms are all of Crossbow‟s sensor and data acquisition boards. Users can also check options for Draw Links between
nodes and specifying whether Gateway has a sensor on it for gradient visualization.
Health Visualization - Users can specify the time duration after which the link between the nodes goes grey. If a packet is not received from any after the specified minutes, the link would turn grey.
Mote-View alert manager allows user to define alert condition based on any sensor data of any sensor node. An Alert is a user programmable event that gets triggered when sensor data exceeds pre-defined threshold.
Mote-View supports conversion for various physical measurement units.
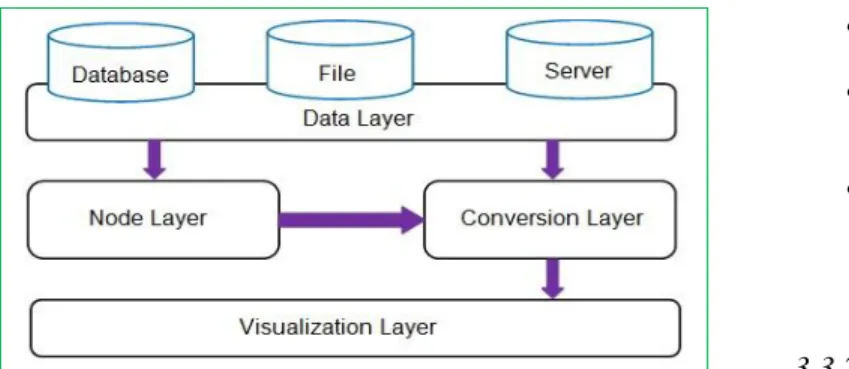
3.2.2 Mote-View Architecture
It is based on modular design and modules conceptually split into one of four layers:
Data Access Abstraction Layer (Data layer) Node Abstraction Layer (Node layer)
Conversion Abstraction Layer (Conversion layer) Visualization Abstraction Layer (Visualization layer) For providing modular extensions each layer includes a plug-in capability. Each layer can flexibly scale to support distinct needs within a common framework.
Fig 3. Mote-View Architecture
3.2.3 Visualization Tabs
The visualization tabs provide three ways to view sensor data: Instantaneous data points.
Plots over a span of time. Spatial maps at an instant in time.
These different representations are implemented as a spreadsheet, a 2-D chart with time as the abscissa, and a network topology map respectively. These three visualizations are just a small subset of the possible ways to view data provided by a sensor network. Each of the three visualizations has similarities in the way it interacts with the lower layers of MOTE-VIEW. This overlap is made explicit in a Visualization Abstraction Layer (visualization layer) and is used to form a general plug-in architecture for extending or creating new visualization tools that can be added to MOTE-VIEW.
These visualization plug-ins facilitate the extension of MOTE-VIEW‟s initial set of text and graphical user interfaces. The main display of the user interface consists of the four tabs: Data, Command, Charts, and Topology.
Data View
The Data tab displays the latest sensor readings received for each node in the network.
Chart View
The Chart view provides the ability to generate graphs of a sensor reading against time for some set of nodes.
Topology View
The Topology view shows a map of the network of Motes, including placement and parenting information. This allows the user to define and view a topology of their Mote deployment.
Command View
The Command tab provides the user with an ability to change different node parameters wirelessly.
3.3 TinyViz
[3][4]
TOSSIM were the first simulators purely targeted towards sensor networks comes with a visualization tool called TinyViz.
3.3.1 TinyViz Features
TinyViz is not just a visualization tool but a software framework to which application specific user plug-in can be added to suite specific simulation requirements.
The TinyViz visualization framework is the most generic among the related visualizers.
It visualizes Sensor readings, LED states, radio links and allows direct interaction with running TOSSIM simulations.
The architecture of TinyViz allows adding application specific visualization functionality. This functionality includes specialized drawing operations, subscription and reaction to events and providing feedback to the TOSSIM simulator.
3.3.2 TinyViz Architecture
TinyViz and TOSSIM share a common event bus, this helps TinyViz to listen to all the events that are generated during a TOSSIM simulation. This provides TinyViz the ability to perform real time visualization of the simulation. The event bus shared between TinyViz and TOSSIM is a bidirectional event bus. This gives TinyViz not only the ability to listen to TOSSIM events, but also the ability to control the execution of TOSSIM, by starting and stopping TOSSIM based on application level requirements.
Fig 4. TinyViz Architecture
3.4 Surge Network Viewer
[5]
The Surge Network Viewer is Crossbow‟s product to visualize wireless sensor networks. It is a Java application that comes standard in the TinyOS Tools distribution. The Surge Network Viewer is useful for monitoring a sensor network and analyzing mesh network performance.
3.4.1 Surge Network Viewer Features
Automatic Discovery and Network Configuration. Viewing of Sensor Network Topology.
Logging and Viewing of Network Statistics including Yield, Predicted Yield, and Link Quality for every Node.
Graphical Tool for Viewing Logged Data.
3.5 MonSense
[6]
The MonSense application is very modular and has various extension points. It reuses various software libraries in order to reach the intended behaviour. The MonSense application displays the existing connections (routes) as an undirected graph, whose nodes are the sensor devices and edges are the current connections.
3.5.1
MonSense Features
MonSense can be used for different goals like planning, deployment, monitoring and control of WSNs. This application is intended to serve two different types
of users: WSN Customers and WSN Researchers. The application must be able to connect to various
sensor networks simultaneously, also allowing the existence of more than one base station for the same WSN.
The gathered data must be easily understood by the final users and, optionally, this data can be published in the internet allowing the access to the information without the need to any previous software installation, through the use of html, plain text or images.
The maps and sensor locations should be (optionally) geo-referenced.
3.5.2 MonSense Architecture
The MonSense application is very modular and has various extension points. It reuses various software libraries in order to reach the intended behaviour. It is an extensible integrated
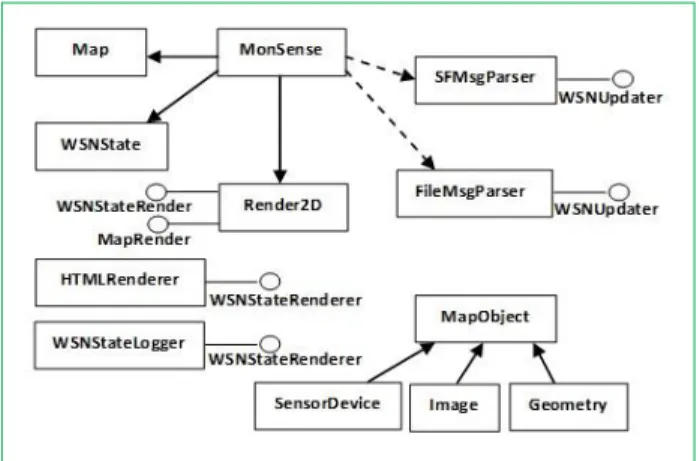
framework for the Simulation of virtual WSN, the visualization of real testbed, and the interaction between simulated WSN and testbed to assist investigation of algorithms in WSNs. Figure 5 shows some components that coexist in the current architecture.
Fig 5. The Major Component of MonSense
The system can be extended by creating new implementations of interfaces like a new WSNStateRenderer or WSNUpdater. For instance, one can envisage the addition of a new component that would allow publishing the information via Web Services simply by registering itself as a new WSNStateRenderer. Thus, a new WSNUpdater could import real-time data from the latter. To
improve the independence of the system, there is option to use code introspection to parse incoming messages from the network, which can be easily done by using the Java Reflection API.
3.6 NetTopo
[7]
It is an extensible integrated framework for the Simulation of virtual WSN, the visualization of real testbed, and the interaction between simulated WSN and testbed to assist investigation of algorithms in WSNs. Most of existing visualization tools support only a single type of sensor networks and are highly coupled to the TinyOS. However, NetTopo is targeting at the visualization
and control of WSN testbeds where heterogeneous devices are used, e.g., wireless camera, Bluetooth based body monitoring sensor devices, and these devices are generally not using TinyOS.
3.6.1 NetTopo Features
Platform independent. Extensibility. Flexibility. Practicability.
Using this tool, applications can run partially in a simulation environment and partially in a physical WSN testbed and interact with each other to create an environment where scalability issues, heterogeneous environments, etc. can be better studied.
3.6.2 NetTopo Architecture
From the high-level point of view, NetTopo consists of both simulation and visualization frameworks. These two frameworks are not just simply placed together and do their own jobs which means they need to interact with each other and access/manipulate some common components and resources. For the purpose of focusing on the integration issues of these two, NetTopo architecture is based on modular component, which is flexible enough for new components to be added and incorporated in the future.
Fig 6. NetTopo Architecture
Main Control and Utility are two components involved and accessed in all layers. Main Control is the core component working as a coordinator in charge of the interactions of other components, the corresponding data communication, etc. It can be regarded as an adaptor between input and output interfaces of other components and enables them to work smoothly. Utility provides some basic and useful services, e.g., defined application exceptions, format verification, number transforms, and dialogue wrappers. These functions are normally invoked by other components statically.
3.7 Octopus
[8]
Octopus is also a WSN Visualization and Control tool. Its main Objective is to provideflexible access and control of deployed sensor networks.
3.7.1
Octopus Features
Simple scheduling on the basis of node ID‟s.
Application layer back-offs on request servicing to avoid implicit synchronization.
Supports time, query, or event driven sensor networks. GUI for viewing the live sensor network topology.
Provides live data plots through the Network Chart feature.
Provides a variety of options for controls the appearance and tags in the GUI.
Logs all received data in a .csv file for further analysis. Provides straightforward user interface to cater to the
non-technical user.
Enables developers to customize GUI and network through modular APIs.
Users can control the behavior of nodes o sampling period
o radio duty cycle o sensing thresholds
o time/event/query –driven modes
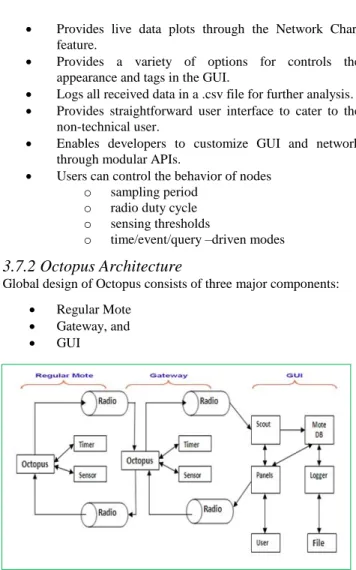
3.7.2 Octopus Architecture
Global design of Octopus consists of three major components: Regular Mote
Gateway, and
GUI
Fig 7. Octopus Architecture
3.8 TOSGUI
[6]
TOSGUI project is composed of modular components that can be used to create a customized application. Unfortunately, the component architecture is tightly connected with the TinyOS operating system and the MOTE hardware platform.
3.9 MSR Sense
[9]
The MSR Sense project is also able to collect data from a WSN and visualize it, but the visualization can‟t be done in real time and the software is not platform independent.
3.10 Trawler
[10]
The Trawler application from MoteIV is well suited for monitoring small sized WSNs but, as the size increases the current network state becomes less obvious. Trawler is practically a combination of Surge and oscilloscope. This tool has three main tabs; the first one displays the topology of the network and the link quality between the nodes. It also shows the sent, received and dropped packets form every individual node. The other tab shows the sensor reading in the form of graphs for all nodes existing in the network topology. Furthermore, it provides options to zoom in or out these graphs. The third tab shows the link quality of the nodes in the network in graphs form. Trawler provides options for logging the sensor readings into files.
Although Trawler includes a multiple features to assist with data collection, but it is also kind of just passive monitoring of the nodes in WSNs.
3.11 SNAMP
[11] [12]
It is a self-developed sensor network analysis and management platform (SNAMP), a novel multi-sniffer and multi-view visualization platform for WSNs. In SNAMP, data emitted by individual sensor nodes is collected by a multi-sniffer data collation network and passed to a flexible multi-view visualization mechanism. SNAMP indicates network topology, sensing data, network performance, hardware resource depletion, and other abnormalities in WSNs and allows developers adding application specific visualization functions, which will facilitate the research and development of various sensor networks and shorter the time from laboratory to applications.
3.12 MeshNetics WSN Monitor [13]
This tool shows the network topology, sensor data and the signal quality between the nodes. The WSN Monitor automatically generates network topology diagrams as network nodes are detected and added to the system. These nodes are then regularly monitored, with any sensor data received automatically displayed in charts and tables on a PC screen. MeshNetics WSN Monitor features an XML-based framework for rapid customization of user interfaces and measured sensor parameters.
3.13 Mica Graph Viewer
[14]
It is a 2D Visualization and monitoring tool.
3.14 MARWIS
[15]
A management architecture for heterogeneous WSNs, which supports common management tasks such as visualization, monitoring, (re)configuration, updating and reprogramming. It uses a wireless mesh network as a backbone and offers mechanisms for visualization, monitoring, reconfiguration and updating program code. Using a graphical user interface, the topology of the heterogeneous WSN with all the sensor sub-networks is visualized.
3.15 Oscilloscope
[16]
Oscilloscope tool is also used to show the sensing data graphically on host screen and visualizing tool for the nodes.
3.16 GSN
[17]
GSN is a software middleware for a variety of WSNs. It facilitates the viewing of large amount of data that is gathered form WSNs and saved in the form of numerical data in a central base station.
3.17 WiseObserver
[18]
This tool visualizes and analyzes data collected by a WSN in a generic scope of application. It also tries to establish a sensor network control interface. The tool will include several facilities to treat sensor network data. It allows the generation of evolution charts, interpolation maps, evolution data videos, and report generation. It also includes modules to add external data not collected by nodes, but related to the network conditions. Node Management will be possible thanks to the execution of commands in network nodes, to perform changes in network operation.
3.18 SenseView
[19]
A tool that enables hierarchical and visual browsing of physical location information and sensor values. Visual maps can be created by composing polygons, each with the ability to link to a different view. Access to real-time data is provided by directly subscribing to event nodes captured as links in the map. The event nodes also provide attribute information describing the sensors. Map information is fetched from a dedicated map server with its own access control lists based on SOX authentication. Much like a web browser with hyperlinks, SenseView allows a user to traverse through different views by clicking on different parts of the map. The user can select and subscribe to available event nodes given the correct permissions.
3.19 XbowNet
[20]
XbowNet (CrossBow sensor network visualization) is a WSN composed of Crossbow Company xbow sensor nodes. A corresponding software driver called xServe is installed on gateway for the purpose of converting sensed data into XML stream and providing a TCP/IP service on port 9005, which can be used for visualization.
4.
CONCLUSION
In this paper an effort has been made to provide an overview of various data visualization tools for WSNs and to present the significant features of each one. The objective of such study was two-fold. First knowing the strength and weaknesses of the number of data visualization tools for WSN that is valuable because it allows researchers to select the one most appropriate for their application. Second the developers of new data visualization tools are well served knowing what has worked in previous data visualization tool and what has not. To these ends, we believe we have succeeded.
5.
REFERENCES
[1] Buschmann, C., Pfisterer, D., Fischer, S., Fekete, S.P., and Kröller, A. 2005. SpyGlass: A Wireless Sensor Network Visualizer. ACM SIGBED Review, vol. 2, issue 1, 1- 6. [2] Tuton, M. 2005. MOTEVIEW: A sensor network
monitoring and management tool. In Proceedings of Second IEEE Workshop on Embedded Networked Sensors (EmNetS-II), 11-18.
[3] Levis, P., Lee, N., Welsh, M., and Culler, D. 2003. TOSSIM: Accurate and Scalable Simulation of Entire TinyOS Applications. In Proceedings of the First ACM Conference on Embedded Networked Sensor Systems (SenSys'03).
[4] UC Berkeley TOSSIM.
www.cs.berkeley.edu/~pal/research/tossim.html
[5] Surge Network Viewer. By Crossbow Technology Inc. http://www.hoskin.qc.ca/uploadpdf/Instrumentation/divers/ CrossBow/divers_Surge%20Network%20Viewer_4271286 a0135f.pdf
[6] Pinto, J., Sousa, A., Lebres, P., Gonçalves, G.M., and Sousa, J. 2006. MonSense - application for deployment, monitoring and control of wireless sensor networks. Poster. In Proceedings of ACM RealWSN'06.
[7] Shu, L., Wu, C., Zhang, Y., Chen, J., Wang, L., and Hauswirth, M. 2008. NetTopo: beyond simulator and visualizer for wireless sensor networks. ACM SIGBED, vol. 5.
[8] Jurdak, R., Ruzzelli, A.G., Barbirato, A., and Boivineau, S. 2009. Octopus: monitoring, visualization, and control of sensor networks. Wireless Communications and Mobile Computing, John Wiley & Sons. ISSN (Print) 1530-8669. http://www3.interscience.wiley.com/journal/
122525552/abstract?CRETRY=1&SRETRY=0
[9] MSR Sense - MSR Networked Embedded Sensing Toolkit. 2006. http://research.microsoft.com/nec/msrsense/
[10] MoteIV Corporation: http://www.sentilla.com/
[11] Yang, Y., Xia, P., Huang, L., Zhou, Q., Xu, Y., and Li, X. 2005. SNAMP: A Multi-sniffer and Multi-view Visualization Platform for Wireless Sensor Networks. IPN Progress Report, May 15.
[12] Yang, Y., Xia, P., Huang, L., Zhou, Q., Xu, Y., and Li, X. 2006. SNAMP: A Multi-sniffer and Multi-view Visualization Platform for Wireless Sensor Networks. In Proceedings of 1st IEEE Conference on Industrial Electronics and Applications, 1-4.
[13] Meshnetics Demonstrated Integration of Wireless Sensor
Data with SCADA System.
http://www.meshnetics.com/press_releases/MeshNetics_Se nsiLink_Press_Release_25Jun06.pdf
[14] Davcev, D., Kulakov, A., and Gancev, S. 2008. Experiments in Data Management for Wireless Sensor Networks. In Proceedings of Sensor Technologies and Applications, SENSORCOMM „08, 191-195.
[15] Wagenknecht, G., Anwander, M., Braun, T., Staub, T., Matheka, J., and Morgenthaler, S. 2008. MARWIS: A Management Architecture for Heterogeneous Wireless Sensor Networks. In Proceedings of the 6th International Conference on Wired/Wireless Internet Communications, Finland, 177-188.
[16] Oscilloscope. From TinyOS Community Forum. “TinyOS: An open-source OS for the networked sensor regime”. http://www.tinyos.net
[17] Aberer, K., Hauswirth, M., and Salehi, A. 2007. Infrastructure for Data Processing in Large-Scale Interconnected Sensor Networks. In Proceedings of the 8th International Conference on Mobile Data Management, Mannheim, Germany, May.
[18] Castillo, J.A., Ortiz, A.M., López, V., Olivares, T., and Orozco-Barbosa, L. 2008. WiseObserver: A Real Experience with Wireless Sensor Networks. In Proceedings of the 3nd ACM Workshop on Performance Monitoring and Measurement of Heterogeneous Wireless and Wired networks, New York, USA, 23-26, October.
[19] Andreou, P., Zeinalipour-Yazti, D., Pamboris, A., Chrysanthis, P.K., and Samaras, G. 2010. Optimized Query Routing Trees for Wireless Sensor Networks. Information Systems.
[21] Miyashita, M., Nesterenko, M., Shah, R.D., and Vora, A. 2005. Visualizing Wireless Sensor Networks: Experience Report. In Proceedings of International Conference on Wireless Networks.
[22] Fan, F., and Biagioni, E.S. 2004. An Approach to Data Visualization and Interpretation for Sensor Networks. In Proceedings of the 37th Hawaii International Conference on System Science.
[23] Start Guide of Tmote nodes.
http://www.moteiv.com/products/docs/tmotesky-quickstart.pdf
[24] Valle, R.D.T., Passos, D., and Albuquerque, C. 2008. Mesh Topology Viewer (MTV): an SVG-Based Interactive Mesh Network Topology Visualization Tool. In Proceedings of IEEE Symposium on Computers and Communications (ISCC), 292-297.
[25] Tirkawi, F., and Fischer, S. 2008. Remote interaction tool for wireless sensor networks. In Proceedings of 3rd International Symposium on Wireless Pervasive Computing (ISWPC), 360-364. ISBN: 978-1-4244-1652-3 (Print)
[26] Berekovic, M., Dimopoulos, N., and Wong, S. (Eds.). 2008. Application Server for Wireless Sensor Network. SAMOS 2008, LNCS 5114, 248-257.
[27] Luo, L., Kansal, A., Nath, S., and Zhao, F. 2008. SenseWeb: Sharing and Browsing Environmental Changes in Real Time. Microsoft, December 9.
[28] Santanche, A., Nath, S., Liu, J., Priyantha, B., and Zhao, F. 2006. SenseWeb: Browsing the physical world in real time. Demo Abstract. In Proceedings of the ACM/IEEE IPSN06, Nashville, TN.
[29] Chatzigiannakis, I., Mylonas, G., and Nikoletseas, S. 2005. jWebDust : A java-based generic application environment for wireless sensor networks. In Proceedings of the First International Conference on Distributed Computing in Sensor Systems (DCOSS '05), 376-386.
[30] Rowe, A., Berges, M., Bhatia, G., Goldman, E., Rajkumar, R., Soibelman, L., Garrett, J., and Moura, J.M.F. 2008. Sensor Andrew: Large-Scale Campus-Wide Sensing and Actuation. CMU-ECE-TR-08-11 (A Technical Report), Carnegie Mellon University.