Machine Learning based Trust Computational
Model for IoT Services
Upul Jayasinghe, Graduate Member, IEEE, Gyu Myoung Lee, Senior Member, IEEE, Tai-Won Um,
Qi Shi
Abstract— The Internet of Things has facilitated access to a large volume of sensitive information on each participating object in an ecosystem. This imposes many threats ranging from the risks of data management to the potential discrimination enabled by data analytics over delicate information such as locations, interests, and activities. To address these issues, the concept of trust is introduced as an important role in supporting both humans and services to overcome the perception of uncertainty and risks before making any decisions. However, establishing trust in a cyber world is a challenging task due to the volume of diversified influential factors from cyber-physical-systems. Hence, it is essential to have an intelligent trust computation model that is capable of generating accurate and intuitive trust values for prospective actors. Therefore, in this paper, a quantifiable trust assessment model is proposed. Built on this model, individual trust attributes are then calculated numerically. Moreover, a novel algorithm based on machine learning principles is devised to classify the extracted trust features and combine them to produce a final trust value to be used for decision making. Finally, our model’s effectiveness is verified through a simulation. The results show that our method has advantages over other aggregation methods.
Index Terms— Clustering, Computational Trust, Feature extraction, Knowledge acquisition, Model classification
—————————— ——————————
1 I
NTRODUCTIONHE concept of the Internet of Things (IoT), which has made many unthinkable inventions possible, has been a major breakthrough in the past decade and many more years to come. In an IoT infrastructure, billions of elec-tronic devices are connected to the Internet and these de-vices are equipped with sensors that observe or monitor various aspects of human life in the real world for support-ing more ubiquitous and intelligent services. A modern day IoT ecosystem involves the networking among physi-cal devices and cyber components as well as the social in-teractions of them. This is essentially a leap forward of Physical Systems (CPS) and the formation of Cyber-Physical-Social Systems (CPSS) to connect the Cyber-Phys-ical world with social world objects [1]. Based on the CPSS concept, the new IoT model, which incorporates social par-adigms into the IoT ecosystem, is introduced to explain the social behavior of objects along with human interactions [2].
However, this integration introduces new concerns for risks, privacy and security at both system and social levels as a result of heterogeneous interactions among humans and objects. Consequently, managing risks and securing IoT are broader in scope and pose greater challenges than the traditional privacy and security triad of integrity, con-fidentiality, and availability in the physical and cyber
world. The aim of future IoT services is to make decisions autonomously without human intervention. In this regard, trust has been recognized as a vital key for processing and handling data, and for complying with the services, busi-ness, and customer needs. Accordingly, ITU-T has been de-veloping related standards for trust provisioning after publishing the first recommendation [3] based on the ac-tivities of Correspondence Group on Trust. For supporting trust, it is crucial to minimize unexpected risks and max-imize risk predictability using a trust platform. This plat-form should help the IoT infrastructure to operate in a con-trolled manner and to avoid unpredicted conditions and service failures.
Many trust evaluating schemes have been proposed in the literature, beginning from early research work done by Marsh in his dissertation [4]. However, they lack the infor-mation about generic framework details, which defines all aspects of trust including information gathering, pro-cessing and producing measurable values as the outcome of the platform. Moreover, labeling a particular entity as trustworthy or not based on a given data set of several hun-dreds of interactions is a vital matter when it comes to fea-sible deployment. To this end, we have found no such re-search that has investigated labeling based on trustworthi-ness. To rectify such a weakness, this paper extends our previous related work in [5-7], which covers a preliminary trust framework, a computational model based on a nu-merical approach and a survey on existing computational models respectively.
There are several trust related frameworks can be ob-served the literature, like [8] and [9] based on privacy, [5]
T
————————————————
U. Jayasinghe is with the Liverpool John Moores University, Liverpool, L3 3AF,UK. E-mail: [email protected].
G.M. Lee is with the Liverpool John Moores University, Liverpool, L3 3AF,UK. E-mail: [email protected].
T. Um, is with Chosun University, Gwangju, 61452, Korea. E-mail: [email protected].
Q. Shi is with the Liverpool John Moores University, Liverpool, L3 3AF,UK. E-mail: [email protected].
and [21] based on reputation, and [10] and [11] based on social relationships. On the other hand there are some frameworks which are aiming particular application area like ad-hoc networks [12], P2P [13] and social networks [14]. However, these approaches lack generality in terms of application domain and target area. Therefore, it is es-sential that trust mechanisms are designed and developed to look ahead to the future where many individual objects are interconnected with new vulnerabilities possibly intro-duced in heterogeneous systems and application domains. To realize this in a rational manner, a two-step process is followed. As the first step, a novel framework is proposed that defines trust metrics (TMs) under three categories: “Knowledge”, “Experience”, and “Reputation” which rep-resent all aspects of trust in any system. Then as the second step, the trust attributes (TAs), which represent major TMs, can be identified, depending on the application area and methods, which can assess them. The obvious benefit is that experts and systems can work on each individual TM, depending on their expertise areas and compose them later for a more complete solution rather than proposing indi-vidual pieces of inventions, which are less practical in real world scenarios.
As our approach here is more concentrated on numeri-cal aspects, the focus of this paper is on generating numer-ically measurable values by combining mathematical methods with intelligent Machine Learning (ML) tech-niques. The choice of the method depends on a balance of several factors like accuracy, computational resources, ef-ficiency, availability of data, and urgency of the situation concerned.
This paper is an extension of our previous work [6] in terms of architectural design model, feature extraction methodologies, and intelligent algorithms to analyse fea-tures and autonomically assess a trust value without hu-man intervention. The major new contributions of this pa-per are to: (i) present a comprehensive trust framework model which specifies the formation of trust from raw data to a final trust value, (ii) offer an analytical approach to as-sess the data and evaluate each individual trust feature, (iii) present a clustering algorithm to label the extracted trust features, (iv) propose an intelligent model based on a mul-ticlass classification algorithm to combine measured TMs to formulate a trust assessment model, and (v) evaluate the effectiveness of the findings in a simulative environment. To the best of our knowledge, we are the first to propose a trust assessment scheme in the above order over multiple features of a real data set. It composes both numerical and machine learning concepts in addition to the novel frame-work proposed, which encourage existing systems to adapt these definitions and concepts to effectively collabo-rate and design systems that are more robust in future.
Further, we have compared and proved in later sections that the proposed algorithm shows 2% improvement in contrast to previous algorithms [15], [16]. In addition, the
algorithm is capable of adapting to the changes of the in-teractions over time and gaining a more powerful insight compared to the traditional methods like the liner aggre-gation in which behaviors of the objects are believed in such a way that they would act in the same manner as be-fore in future. This shows a prominent feature of our algo-rithm towards designing an autonomous system that is ca-pable of assessing trust dynamically without external in-terventions but intelligent enough to predict future misbe-haviors. Moreover, the algorithm is not limited to classify the trustworthiness based on the proposed features only but open to accept any number of features. Hence, the al-gorithm is essentially a generalized one and can apply in any use case from smart home to cross border application domains without any restrictions.
The remainder of the paper is organized as follows. In Section 2, we survey related contributions on trust model-ing, management, and computation methods. Following that, the design principles of a trust framework are defined in Section 3, which provides a foundation for the work, proposed. Section 4 discusses a basic feature extraction methodology for a genuine data set according to the IoT concepts. Based on this methodology, the development of a ML based algorithm is presented in Section 5. The nu-merical model and algorithms are tested in a simulation environment elaborated in Section 6. The simulation re-sults are discussed in Section 7. Finally, Section 8 concludes the paper and outlines our future work.
2 R
ELATEDA
PPROACHESTrust management technologies have been widely investi-gated in many fields including economics, sociology, and computer science [4], [17], [18]. Current research on trust management systems in computer science is often focused on solving security and privacy related issues. For example, trust management systems established on privacy policies are presented in [8], and [9]. A survey on trust and repu-tation systems based on ad-hoc networks is presented in [12]. They specifically discuss architectures, TAs, and scopes of a trust management system for such networks. Momani et al. [19] argue the difference between trust and security in wireless sensor networks (WSN). Furthermore, authors in [13] dispute a decentralized trust management platform for peer-to-peer (P2P) applications. They present an innovative approach to classifying trust based on cre-dential and policy, reputation, and social network infor-mation.
On the issue of trust computational methods, authors in [7], [20] explain several trust evaluation schemes based on the concepts of network architecture, policy, reputation, and hybrid methods. Methods based on network architec-ture use some structural information like in-degree, out-degree and page rank concepts as in [5], [21] to extract some trust related properties like reputation. Basically, policy based mechanisms are used to estimate whether an object is trustworthy, depending on a set of predefined rules or credentials as in [22], [23]. Reputation systems keep a track of the status of interactions and behaviors in order to make a trust decision, such as those used by eBay
[10] and KeyNote [11].
On the other hand, social interactions among objects disclose the valuable information of trust in analogy to the sociology concept of human interactions based on trust re-lationships. In this regard, authors in [14] and [24] have de-veloped a social model of cyber objects corresponding to their owner’s social behavior. In such models objects inter-act with each other based on their trust relationships and reveal many information in terms of trust as described in [25], [26]. Moreover, [27] and [28] discuss about trust as-sessment of a social network based on concepts like a com-munity of interest, friendship, followers as well as fre-quency, duration and behavior of the objects. In a similar manner, authors in [29] and [30] present a computational model for trust based on similarity, information reliability, and social opinions.
However, the influence of a particular TA on trust is de-termined by a weighting factor, but the assessment of a proper weightage is a complex task due to the fact that trust is a varying quantity which depends on many factors, e.g. expectations of a trustor, time, context, etc. Thus, schemes that are more intelligent are required to find these weighting factors and a threshold that defines a trustwor-thy boundary. Authors in [8], [31] and [32] investigate more innovative models and solutions for privacy, security and data integrity based on statistical and deep learning concepts. Moreover, authors in [33] and [34] propose a re-gression based model which compares the variation of trustworthiness with respect to trust features in mobile ad-hoc networks (MANET) and WSN. However, they have in-vestigated a limited number of trust features, which only represent the system level information like packet for-warding ratio, Quality of Service, energy-sensitivity, capa-bility-limitation, and profit-awareness. This motivates us to present a generic trust framework that represents fea-tures from both social level as well as system level data.
Recently, authors in [35], [36] and [37] present several trust management frameworks based on reinforcement learning and multiclass classification techniques which lay the foundation for the algorithms considered in this work. Even though these research achievements show some prominent results by applying ML techniques, they still lack the potential of being a generic algorithm that can be commonly applicable to any service domains without lim-iting to specific infrastructures like MANET, WSN, Under-water Acoustic Networks etc. In addition, they only con-sider quite limited as well as conventional factors like en-ergy saved in a particular transaction, delay, intrusion sen-sitivity, throughput, etc. for the trust assessment process. Moreover, they are missing the information about extract-ing social features, an intelligent labelextract-ing method and a trust prediction technique.
3 G
ENERICT
RUSTM
ANAGEMENTF
RAMEWORK Typically, trust can be seen as a metric used to evaluate so-cial actors in consideration of mutual benefits, coordina-tion, and cooperation. Actors continuously update their trust on others in response to perception fluctuations due to direct interactions and based on believes and opinionsof others who are around. Trust is a crucial fact that affects the appetite of an object to consume a particular service or product offered by another object. This example can be seen in our everyday life where trust decisions are made. When purchasing a specific product, we may favor certain brands due to our trust that these brands will provide ex-cellent quality compared to unknown brands. Trust in these brands may come from our previous experience in using these brands’ products, from their reputations per-ceived by other people who bought their items and left opinions about those products, or from suggestions of your surroundings such as families and friends.
In analogy to above viewpoint, trust also affects the de-cision of an object to transact with another object in an IoT ecosystem in which all participating objects must take de-cisions based on trust to provide/receive services to/from other objects. However, building trust in IoT is much more difficult due to the inability of machine objects to generate perceptions about other objects around them like humans. Furthermore, it is difficult to quantify the exact trustwor-thiness value of an object with a high accuracy. This is even harder when each object has a different interpretation and perception of the term “trustworthy”. Therefore, they may assign different trustworthiness values to a provider or a service. As an example, a service consumer object assigns “very trustworthy” to the provider for a specific transac-tion that it has performed. However, another consumer ob-ject might assign “untrustworthy” for a similar transaction from the same provider. These differences further increase the difficulty to determine the exact trustworthiness of a provider.
Therefore, it is essential to establish a generic frame-work which defines the blueprint of a trust management process while keeping in mind the diversity of trust fea-tures and hence the flexibility given to objects to choose best and practical measures. To clarify the ambiguities and definitions of trust, we use the following definitions in the context of a cyber world in this paper [3]:
Definition 1. Trust
It is a qualitative or quantitative property of a trustee, eval-uated by a trustor as a measurable belief, in a subjective or objective manner, for a given task, in a specific context, for a specific time period.
Definition 2: Trust Model
It comprises three TMs: Knowledge, Experience, and Repu-tation. Each TM is a collective representation of several TAs. Each TA represents the trustworthiness feature of a trustee. We use the term “trustor” to represent an object that is expected to initiate an interaction with another object and “trustee” as the second object that provides necessary in-formation towards the trustor upon its request. The first thing that we want to emphasize in the definition of trust is the nature of the measurement that can take either a quantitative or a qualitative form. Apart from the well-known numerical measurements like similarity, accuracy, etc., qualitative properties like motivation, awareness, and commitment can also be used to judge certain situations in
the process of trust based decision making. In addition, it is important to recognize trust as a belief even in the cyber world. That means, trust is a relative phenomenon and 100% belief is neither practical nor achievable in a diverse envi-ronment like IoT.
Moreover, the perception of trust can be either subjec-tive or objecsubjec-tive, depending on the requirement of the trus-tor and the availability of needed information. If the trustrus-tor wants TMs in a specific format that goes with the trustor’s profile of interest, then the measurements can be charac-terized as subjective. On the other hand, objective measures can be described as TAs collected without any profile based filtering. Lastly, it is utmost important to de-fine trust specifically for a particular task, context and time frame. For example, one might trust another for their cloud storage services but not for online streaming services, i.e. task dependent trust. Further, this trustworthiness rela-tionship to obtain cloud services might be for a temporary duration and not for persistent time, i.e. time dependent trust. Moreover, a client might use different cloud services in different countries, as he does not trust the same pro-vider globally, i.e. context dependent trust. Hence, trust is a variable in nature and hence cannot be assigned perma-nently to measure every task and every context of a specific actor or object. Further, we need to emphasize that trust is a relative quantity between two or more objects in opposite to a measurement of individual objects. Having stated the generic definition of trust, our next step is to define the course of trust acquisition, evaluation, and representation in an automatic or semi-automatic way in a computational setting, which we illustrate as the trust model in Fig. 1.
3.1 Knowledge Trust Metric
The knowledge TM covers all aspects of direct trust evaluations, which provide a perception about a trustee before an interaction. This is equivalent to analyzing the resume of a prospective candidate before hiring. To make this possible, it must provide relevant data to the trustor for its assessment. If a data feature can be represented us-ing a quantitative measurement, then the result is a numer-ical value in a certain range. As an example, social relation-ships like co-location and co-work, credibility factors like cooperativeness, time dependent features like the
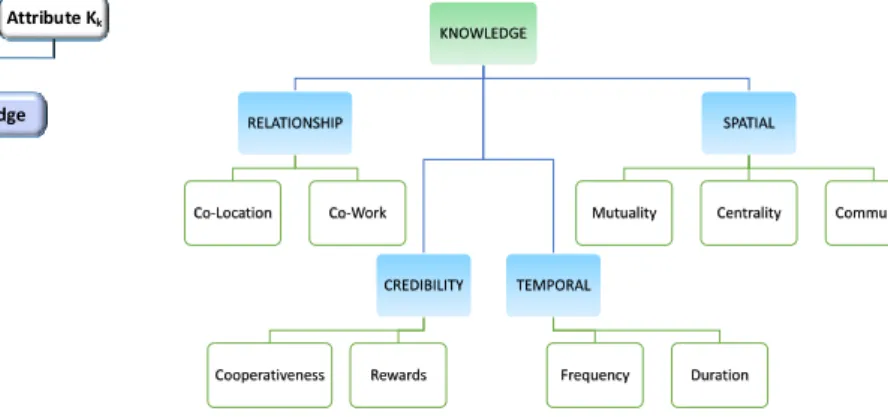
fre-quency and duration of interactions, and spatial distribu-tion of relevant trustees compared to the trustor can be used as direct trust measurements. The TAs, which we evaluate in this paper using ML techniques, are shown in Fig. 2.
The relationship TAs in Fig. 2 defines the mutual rela-tionship between the trustor and a trustee. It is reasonable to assume that if two objects have a noble relationship tween them, a higher trustworthiness can be expected be-tween them. As an example, if the trustor and the trustee are operated closely by location such as looking for a park-ing lot near a supermarket, then both benefit (e.g. gettpark-ing a vacant, closest, easily navigable parking lot) from their re-lationship based on location similarity that we have iden-tified as co-location TA. Likewise, if the two objects are in a working relationship like car sharing in which one needs to provide a service and other needs to get the service, both can support each other via their co-work association.
Furthermore, it is important to maintain knowledge about the consistency of trustworthy service provisioning. We discuss properties related to this issue under credibil-ity. The cooperativeness under credibility in Fig. 2 repre-sents the level of social cooperation from the trustee to the trustor. The higher cooperativeness means the higher trust level in an IoT ecosystem. A user can evaluate the cooper-ativeness of others based on social ties and select socially cooperative users. Additionally, we have introduced a re-warding system in order to track the history of misbehav-ior situations or unsuitable reactions originated by the trustee. Rewarding TA can be used to either encourage or discourage further interactions with a particular trustee based on its past character.
To capture the significance of time related information to trustworthiness evaluation, TAs like the frequency and duration of the interactions can be used. It is logical to as-sume that the higher frequency and duration of interac-tions, the more trust is built up among the associating ob-jects. On the contrary, the shorter time spent on each other, the less knowledge gathered on each other’s behaviors and capabilities. As an example, in whitewashing attacks, a dis-honest object can vanish for some time and rejoin the ser-vice in order to clear its reputation. However, if a trustor can keep a record of the consistency of the interested trus-tees then it can avoid such situations.
Moreover, in an IoT ecosystem, service provisioning Fig. 1. Generic Trust Model: A prototype that explains the trust
acquisi-tion and evaluaacquisi-tion process based on three TMs, knowledge, experience, and reputation as described in Section 3.1 and 3.2.
Fig. 2. Composition of Knowledge: Describes the TAs that influence the evaluation of knowledge TM as explained in Section 3.1.
Trust Model Reputation Experiance Knowledge Entity R1 Entity Rn Entity E1 Entity Em Attribute K1 Attribute Kk ... ... ... KNOWLEDGE RELATIONSHIP Co-Location Co-Work CREDIBILITY Cooperativeness Rewards TEMPORAL Frequency Duration SPATIAL
(discover, manage and terminate) is based on its social re-lationships without solely depending on the underlying system level information. Therefore, it is vital to identify TAs, which determine the social proximity of the objects in collaboration. In this aspect, we identify three properties under spatial TAs in Fig. 2 as mutuality, centrality, and community of interest as governing features that define the social positioning of a trustee. Mutuality measures the de-gree of profile similarity between the trustee and trustor in resemblance to what is used in social networking. The community-interest represents whether the trustor and the trustee have a close relationship in terms of social commu-nities, groups, and capabilities. Two objects with a degree of high community-interest have more opportunities in in-teracting with each other, and thus can result in a higher trust level. Centrality measures the importance of a trustee among other objects with respect to a particular task and context.
3.2 Experience and Reputation Trust Metrics
After acquiring enough evidences about trustees through the knowledge TM, the trustor can initiate collab-orations with selected trustees based on the perception that the trustor has already obtained. However, the result of these interactions might differ from the perception and hence it is critical to keep a record of each individual rience to be used in future interactions. For instance, expe-rience might be a feedback from consumers after each transaction (as used in many e-Commerce systems), just a Boolean value (0/1) indicating whether a service transac-tion successfully operates (as in some reputatransac-tion-based trust systems), etc. Then, by accumulating these experi-ences over time in relation to the corresponding contexts, tasks and times, the trustor can build up additional intelli-gence compared to the knowledge TM.
To further enhance the perception of the trustor, other objects can share their experience in using the trustee, upon a request by the trustor, which we identify as repu-tation or the global opinion of the trustee. As an example, we have come up with a non-bias PageRank based model to calculate reputation values of trustees in a distributed network as in [5].
In summary, the experience TM is a personal observa-tion considering only interacobserva-tions from a trustor to a trus-tee, whereas the reputation TM reflects the global opinion of the trustee. However, the knowledge TM is the building block of both experience and reputation and hence the fo-cus of this research is to generate quantitative results for the knowledge TM based on ML techniques.
4 C
OMPUTATIONALM
ODELEven though an IoT environment produces a large amount of data, it is questionable how much of them can be directly used for the trustworthy evaluation process. Therefore, it is vital to extract trust features by scanning social and sys-tem level interaction logs and store them in a data reposi-tory (DR) for further analysis. Hence, a numerical model that can extract basic features discussed in Section 3 is ad-dressed here.
For that, we define the assessment of knowledge (K) to-wards an object j by an object i at time t as Kxij(t), where x represents one of the features: Co-location relationship (CLR), Co-work relationship (CWR), Mutuality and Cen-trality (MC), Cooperativeness-Frequency-Duration (CFD), and Reward. Note that trust assessment is always between two or more objects.
4.1 Co-Location Relationship (CLR)
An IoT ecosystem enables users to share their resources, ideas, situations, and interested services with nearby de-vices. In such a situation, if both the trustor and the trustee are in close proximity and have subscribed to a DR in the platform, the trustor can conveniently get the required in-formation from the selected trustee who is trustworthy in terms of the physical location compared to other objects far away from the scenario. However, in an IoT model, objects are always in relationship with their owner (Owner Object Relationship-OOR) and hence the static or dynamic nature of the OOR always affects the CLR [2]. In order to avoid objects leaving the physical location, a decision boundary based on the distance from the trustor (e.g. based on GPS data) and the time spent within this decision boundary are taken into consideration. Then the objects, which are within this distance boundary and exceed the minimum time threshold inside the region, are selected as prospec-tive candidates for a trustee. Once the candidates are fil-tered, their CL relationship with the trustor can be calcu-lated as follows: 𝐾𝑖𝑗CLR (𝑡) = 1 𝐝𝐢𝐬𝐭(𝑖, 𝑗) GiGj ‖Gi‖‖Gj‖ (1) Here, g𝑖 and g𝑗 are the GPS coordinates of the trustor i
and trustee j, respectively. The symbol “‖.‖” defines the norm of an element. The second term in (1) is the cosine similarity between the two objects and it is normalized by the geo distance factor 𝐝𝐢𝐬𝐭(𝑖, 𝑗) which can be calculated as in [38]. The application of the geo distance factor is im-portant here as it provides a value with respect to an actual surface distance of the earth in contrast to a linear distance.
4.2 Co-work Relationship (CWR)
The objects that are collaborating in common IoT applica-tions can be characterized as CWR. In such a situation, more focus would be on working relationship in a particu-lar service domain rather than their physical proximity. To measure CWR as a numerical value, we compare the mul-ticast interactions between a trustor and a trustee, as calcu-lated below:
𝐾𝑖𝑗CWR (𝑡) =|𝐜𝑖𝑗MI|
|𝐜𝑗MI| (2)
where cijMI is the vector of multicast interactions (MI) be-tween trustor i and trustee j, andcjMI is the vector of MI originated at j. The symbol “|. |” represents the determi-nant of a vector. KCWRij(t) represents a relative measure-ment of shared multicast messages to total messages orig-inated at the trustee.
4.3 Cooperativeness, Frequency and Duration (CFD)
In a collaborative environment, it is important that every object execute its commitment to improve the level of the outcome of the whole service provision process. As an ex-ample, consider a malicious agent that provides fake rat-ings for a specific service. In this case, it is obvious that this agent deliberately tries to manipulate the genuineness of the information on the service and does not have any in-tention to use it. Therefore, the cooperativeness TA is vital to maintain the above-mentioned content stability and thereby to provide a trustworthy service to the trustor upon its request. Furthermore, it can be anticipated that the more frequent and longer the interactions among objects, the more collaboration from each party can be expected. Based on this, a numerical model for cooperativeness, fre-quency, and duration is derived.
Let us consider a set of interactions, c1, c2... cn over some period in which the trustor is interested. A trust level be-tween trustor i and trustee j is calculated below:
𝐾𝑖𝑗CFD (𝑡) = ∑c𝑚 t𝑚 𝐸(𝑐𝑚) 𝑛 𝑚=1 (3) Here, n is the number of interactions, indicating how frequent they interact with each other. For the mth success-ful interaction, c𝑚 is the length of an interaction between
the trustor and the trustee, tm is the total interaction length by the trustee. The factor cm/tm assesses the duration prop-erty, in which the trustee interacts with the trustor, relative to the total activity time of the trustee. 𝐸(c𝑚) is the binary
entropy function which measures the balance in the inter-action or the cooperativeness which can be calculated as follows [26]:
𝐸(c𝑚) = −𝑝 log 𝑝 − (1 − 𝑝)log (1 − 𝑝) (4)
where p is the fraction of the interactions between the trustor and the trustee. E(cm) follows a binary distribution as stated in [39]. It is evident that the maximum entropy (i.e. 𝐸(c𝑚)=1) is reachable only when p=0.5 that is 50% con-tribution from each party.
4.4 Reward System (RS)
An essential component of any service provisioning sys-tem needs to have a reward and punishing mechanism or a feedback model in order to assess the historical service experiences between a trustor and a trustee. It is always critical to maintain the social relationships at the maximum trustworthy level and hence we use the exponential down-grading formula shown in equation (5) for this purpose.
𝐾𝑖𝑗RS(𝑡) =‖𝐶‖ − ‖𝐶p‖ ‖𝐶‖ 𝑒
(−‖𝐶‖𝐶‖p‖) (5)
Here, C is the total number of interactions that have taken place during a period t, and Cp is the total number of unsuccessful or suspicious interactions. To punish mis-behavior situations more severely, the slope of the distri-bution is increased, compared to the standard exponential
distribution. Hence, a higher number of malicious interac-tions will result a lower reward value.
4.5 Mutuality and Centrality (MC)
In an IoT ecosystem, service discovery and provisioning largely depend on the social relationship among the par-ticipating objects. In this regard, the mutuality and the cen-trality TAs define the location of a trustee with respect to a trustor in a social world. On the other hand, it is very intu-itive to assume that a higher number of mutual objects im-ply higher similarity between their social profiles. How-ever, mutuality alone cannot be used as a TA due to the number of mutual friends being proportional to the num-ber of friends of each individual object. That is, an object with a higher number of friends gets an additional ad-vantage compared to an object that has recently joined the network but has higher trustworthiness. In order to avoid such circumstances, a relative measurement of mutuality compared to the total number of friends is considered. This is essentially the centrality property of the trustee and is calculated below:
𝐾𝑖𝑗MC(𝑡) =|𝑀𝑖𝑗| |𝑁𝑖|
(6) where Mij be the set of common friends between i and j, and Ni is the set of trustee’s friends.
4.6 Community of Interest (CoI)
Objects in an IoT environment usually collaborate with at least one community. As an example, a person is registered as a frequent customer of a car sharing community while being a member of several other communities like online markets, social networking groups, etc. If another person is also a member of the car sharing community, this shows the resemblance of interest of both persons’ interests. Sim-ilarly, if the trustor and the trustee share common interest groups, that is an indication of the degree of the common interest or similar capabilities of the trustee compared to the trustor. Mathematically, let us define Mijcoi as the set of communities where both the trustor and the trustee are in-volved in, and Nijcoi as the set of communities with each in-cluding the trustee as a member. Please note that both the trustor and the trustee can be a member of several commu-nities and hence the trust level of the trustee based on CoI is calculated in (7).
𝐾𝑖𝑗CoI(𝑡) =|𝑀𝑖𝑗 CoI|
|𝑁𝑖CoI| (7)
After the extraction of all the TAs using equations (1), (2), (3), (5), (6) and (7), the next step is to calculate the final trust value of the trustee. A well-known approach is to combine each TA through a linear equation with weighting factors as shown in (8).
𝐾𝑖𝑗(𝑡) = 𝐾𝑖𝑗CLR(𝑡) + β𝐾𝑖𝑗CWR(𝑡) +𝐾𝑖𝑗CFD(𝑡) + ε𝐾𝑖𝑗RS(𝑡) +𝐾
𝑖𝑗MC(𝑡) +𝐾𝑖𝑗CoI(𝑡)
(8) However, there are many drawbacks in this approach,
including (i) lack of information and an infinite number of possibilities when it comes to estimate a weighting factor, (ii) unsuitability of a threshold based system to detect the trustworthiness of a particular trustee, and (iii) inability to identify which TA makes the most influence on the trust in a particular context. Thus, we will propose a new approach to the trust evaluation process in the next section.
5 M
ACHINEL
EARNINGB
ASEDM
ODELTo overcome the weakness about the TA combination dis-cussed in the previous section, we propose a ML based model to analyze the TAs extracted before and predict the trustworthiness of prospective transactions based on the trained model. In order to achieve this, we first use an un-supervised learning algorithm to identify two different clusters or labels, namely trustworthy and untrustworthy. The main reason to use the unsupervised learning over a supervised method is due to the fact of unavailability of a labeled training set based on trustworthiness relationships.
Then a multi-class classification technique like support vector machine (SVM) is used to train the ML model in or-der to identify the best threshold level that separates trust-worthy interactions from others. In this research, our main objective is to differentiate malicious interactions from trustworthy interactions with maximum boundary separa-tion and minimum outliers rather than classificasepara-tion itself. Therefore, it is not necessary to go for other algorithms like Random Forest, especially with a low dimensional dataset compared to its sample size used in this work. However, depending on the data set, dimensionality, number of clas-sifications required and noise levels of the samples, a model comparison can be performed to find out the best possible algorithm for each individual case. A well-trained model like this can differentiate an incoming interaction between two or more objects much more efficiently than linear weightage methods [15], [16] and is much more ben-eficial in the decision making process.
Let us define the number of features considered in the model as n and the length of the training set as m. We use the five features defined in Section 4, i.e. CWR, CFD, RS, MC and CoI to train our model. They are expressed as a feature matrix X(i)(j) where i denotes the ith training sample and j signifies the jth feature among the n features. Moreo-ver, the label of each training sample i is denoted by y(i). However, training labels are not readily available and a method for the labeling will be discussed in the sub-section below. These allow us to identify each training set as (X(i)(j),
y(i)) for i=1,2,…,m and j=1,2,…,n. In the following sub sec-tions, we break down our main algorithm in to two parts and explain it separately in Section 5.1, and 5.2 respectively.
5.1 Algorithm I:
Clustering and LabelingIn this section, we develop an algorithm based on the K-means clustering technique, which is specified in detail in Algorithm I, in order to group interactions based on the aforementioned features and thereby label each interaction as trustworthy or untrustworthy [40]. The K-means algo-rithm needs to define two initial conditions: number of
clusters (k) and initial centroid positions () that each inter-action is assigned to. As there is no way to find out these values at the beginning of the algorithm, we randomly as-sign initial centroid locations for a range of cluster sizes, e.g. from k=1 to k=5. After that, steps 6-9 in Algorithm I are executed until the cluster points “” are not changing any further (i.e. until the convergence). Then, the Elbow method is used to find out the optimum cluster size which gives the lowest value for the K-mean cost function J(c,) where c is the index of a cluster centroid and is the coor-dinates of cluster centroids with the dimension of k [40].
Note that initial inputs to the algorithm were normal-ized between [0, 1] in which “0” represents untrustworthi-ness and “1” the most trustworthiuntrustworthi-ness. Hence, it is logical to label points close “0” as untrustworthy and vice versa after the clusterization step. Therefore, after the step 13 of the algorithm, the clusters close to the origin (i.e. all zero point) of the N dimensional space is marked as “0” or un-trustworthy and the cluster away from the origin is identi-fied as a trustworthy region. To check the influence of all n features at once, the Principal Component Analysis (PCA) algorithm based on Singular Value Decomposition (SVD) is applied to reduce the N dimensions to two dimensions for visualization purposes as below before applying the al-gorithm I [41]. Even though it is possible to extend Algo-rithm I for n features with regularization, we observe that the PCA method is more efficient with respect to compu-tational complexity of unsupervised learning with regular-ization.
Algorithm I : Data Clustering and Labelling
1: 2: 3: 4: 5: 6: 7: 8: 9: 10: 11: 12: 13: 14: 15: 16: 17: 18: 19: Input: X Output: y
Initialize cluster centroids 1, 2,… k n
for k=1 to 5 do
Repeat until convergence: { for i=1 to m do
c(i):=arg minj||X(i)- k||2
k := Average of points assigned to cluster k
end for }
J(k) (c,):=arg mink J(c,) end for
Optimum k Elbow method plot J(k) vs k
for i=1 to m do if c(i) close to (0,0) y(i) = 0 elseif y(i) = 1 end if end for
The first step of the PCA algorithm is to calculate the covariance matrix that has the dimension of n x n. In the step two principal components U and V are calculated us-ing the SVD function, each havus-ing the same dimension as [41]. As our intention, here to reduce the dimensions from five to two, dimensions (d) of the principal matrix U is set to two. Finally, step four calculates the two-dimen-sional feature vector Z in corresponding to five-dimension vector X.
Algorithm : Principal Component Analysis
1: 2: 3: 4:
Compute dot product matrix: =XTX
Compute eigenvectors: [U,S,V]=SVD(XTX)
Specify the required dimension ,d: Ud=[u1,…ud]
Compute d(=2) features: Z= UdTX
5.2 Algorithm II: Classification Model
Having obtained the completed data set (X(i)(j), y(i)) via Al-gorithm I, the next step is to train an alAl-gorithm based on a SVM technique which can identify the nonlinear bounda-ries of trustworthy and untrustworthy interactions. In or-der to obtain the maximum accuracy of the learning algo-rithm, the train set is divided into two parts in such a way that the training set occupies 80% of the data and 20% for the cross validation data set which is denoted as (X(i)val, y(i) val) for i=1,2,…, ⌊0.2*m⌋ and j=1,2,…,n. This is important to avoid overfitting data through the regularization parame-ter and variance.
In our Algorithm II, we use a Radial Basis Function Ker-nel (RBFK) due to the smaller number of features (n) com-pared to the training set samples (m) as the authors in [42] have claimed. Further, in order to optimize the computa-tional resources, the LIBSVM library is used to run the RBFK kernel [43]. First, we run the RBFK kernel over mul-tiple instances of regularization parameters and variances in order to find optimum parameters for the learning algo-rithm as shown in step 4-7 in Algoalgo-rithm II. As an example both c and are varied as a geometric series (e.g. 0.01, 0.03, 0.09… 30) to save the time and computation resources. Then the parameters which give the minimum error in the prediction step are chosen as the optimum factors for the SVM model. Further, it is essential to improve the accuracy of the final ML model and suppress any noise generated by the previous clustering algorithm. Hence, we use regu-larization techniques to avoid such issues during the train-ing process in Algorithm II.
Algorithm II : Classification Model
1: 2: 3: 4: 5: 6: 7: 8: 9: 10: 11:
Input: X , y , Xval , yval
Output: Weights and Decision boundary
//Find best parameters c and
for c, =0.01 (multiple of 3) 30 do
model=svmtrain(y,X,RBFK,c, )
prediction=svmpredict(yval, Xval ,model)
error [c, ]= predictions ≠ yval end for
Choose c, minimum [error]
[weights, accuracy, decision values] = svmtrain(y,X,RBFK,c, ) Afterwards, the algorithm is trained for all the training data samples using the algorithm II and model parameters are recorded to estimate future trust values based on the incoming feature statistics. The function svmtrain is de-fined in the LIBSVM library and calculates the decision boundaries based on the RBFK kernel as per SVM tech-nique. Similar to algorithm one, first we consider two trust features at a time and investigate the trust boundaries. Af-ter that, features, which are derived through PCA
algo-rithm, are considered to investigate the effect of all five fea-tures on the trust boundaries.
6 S
IMULATIONS
ETUPTo extract the aforementioned trust features to be used in the ML algorithms, we would need traces of many objects, which are not available now for IoT. Hence, we have used traces taken at the SIGCOMM-2009 conference which is available in CRAWDAD [44], [45]. These traces contain the information on device proximity, activity logs, friendship information, interested groups, application level message logs, and data layer transmission logs. We map the infor-mation to match with the IoT concepts described in [9]. In other words, we define a set of features, CWR, CFD, RS, MC and CoI, related to IoT based on raw data found in the data set. Therefore, our experiment can be re-applied with any real world IoT data set for further experiments without any ambiguity. This leads to the parameter settings and scenario of our simulation, as detailed in Table 1. Among 76 nodes, each pair of them (Trustor and Trustee) with at least a single interaction between them are considered as objects to match with the IoT concepts.
After obtaining the trust feature vector Xj for each node pair, they are organized as in (9) to generate the m training samples. We have deliberately omitted the results from CLR as the data set itself was obtained from a very close proximity and it is not meaningful to test location-based trust in this scenario. The dimension of the training sample matrix is in order of m×n where m=5776 (node pairs) and n=5. The notation [.]T is used to denote the transpose of a vector and has the dimension of m×1. Note that feature normalization is not required here as each feature value is in the range of 0 and 1.
[𝑿]𝑚×𝑛= [ ⋮ [𝐶𝑊𝑅]T ⋮ ⋮ [𝐶𝐹𝐷]T ⋮ ⋮ [𝑅𝑆]T ⋮ ⋮ [𝑀𝐶]T ⋮ ⋮ [𝐶𝑜𝐼]T ⋮ ] (9) For the multiclass calcification problem, 4620 samples (i.e. 80% of the total samples) are chosen as the training set, and 1156 samples (i.e. around 20% of the total data set) are used as cross validation samples to avoid the data-overfit-ting problem.
For both ML experiments here, two features out of five are selected at a time for the sake of demonstration pur-poses, as it is not feasible to show a five-dimension vector. However, it is critical to analyze five features at the same time and evaluate their influence on the final trust value. Therefore, we then consider all the five features together and generate numerical results. However, to demonstrate the results, the PCA method is used to reduce the dimen-sions from five to two and generate the graphical results [46]. Note that PCA not only simplifies the visualization but also the algorithm complexity that make our model
TABLE1
PARAMETERS OF THE DATA SET
Parameter Value Parameter Value
Nodes 76 Interactions 18226
Objects 5776 Communities 711
more practical in the case of a large number of features even though we use around five dimensions in this re-search to prove the effectiveness of our model in trust eval-uation. Here, feature normalization is used to bring the new data samples, obtained through PCA, in the range of zero and one. The experiment is carried out on a PC which consists of 8 CPUs (Intel Core i7-2600, 3.4GHz) and 8GB RAM.
7 P
ERFORMANCEE
VALUATION ANDD
ISCUSSIONS In this section, we present the simulation performance of our models in Sections 4 and 5. The simulation complexity is based on the number of interactions among objects and the number of nodes. For our feature extraction model, around 18000 interactions are used to generate each feature, and for the ML models, 5776 training samples are used.7.1 Feature Extraction
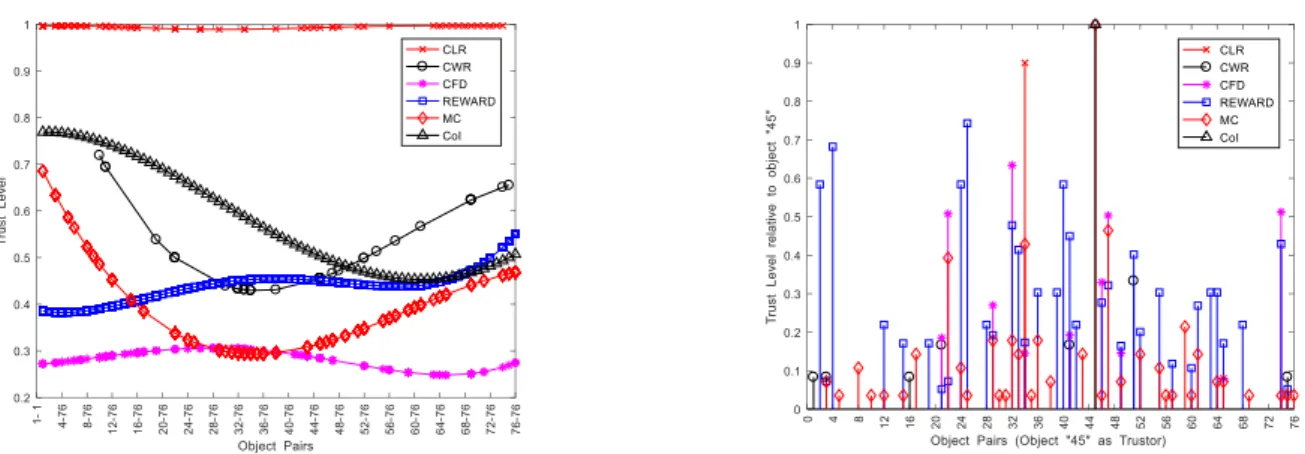
Simulation results based on the numerical models defined in Section 4 are shown in Fig. 3 and Fig. 4. It is noticeable that the distribution of trustworthiness values in the CLR feature is close to “1” as shown in Fig. 3 due to the fact that the data is collected from the devices which are closely speeded. Note that only a fraction of object pairs have CLR association among 5776 objects as the data points represent those which have at least one transaction. Moreover, the trust values are normalized to fall between “0” and “1”. One represents 100% trustworthy interactions and zero de-notes untrustworthy interactions.
On the other hand, the distribution of CWR associations shown in Fig. 3 shows weaker associations compared to the CLR case even though they closely work together. Dis-similar intentions of each node can be one of the reasons that resulted in this kind of behavior. Further, the variation of trustworthiness values with respect to their cooperative-ness, frequency and duration of the interactions is distrib-uted towards the lower end of the graph as often radio fre-quency (RF) communications are limited to asymmetric type interactions as well as message exchanges of short du-rations. However, trust values based on the CoI and Cen-trality are distributed in the range of 0.3 to 0.8 in the figure showing some amount of profile similarity among the nodes. Furthermore, rewarding values given to each inter-action are biased toward the lower end of the scale. This is
mainly due to the unsuccessful or ill behaviors caused in the past interactions.
Similarly, Fig. 4 shows the distribution of trustworthi-ness of each object (Trustees) with respect to one specific object (Trustor). We have chosen object “45” randomly in order to generate these results. This figure clearly shows the interpretation of trustors view on other adjacent objects with respect to the features we have discussed in Section 4. As an example, trustee object “34” shows high co-location relationship with the trustor compared to other features while MC, CFD and Reward is around 0.4, 0.15 and 0.16 respectively. Therefore, it is possible that the trustor will engage in location-based services with the trustee in future interactions but limit its interactions related to collabora-tive services, as the MC and CFD values are low.
7.2 Algorithm I: Clustering and Labeling
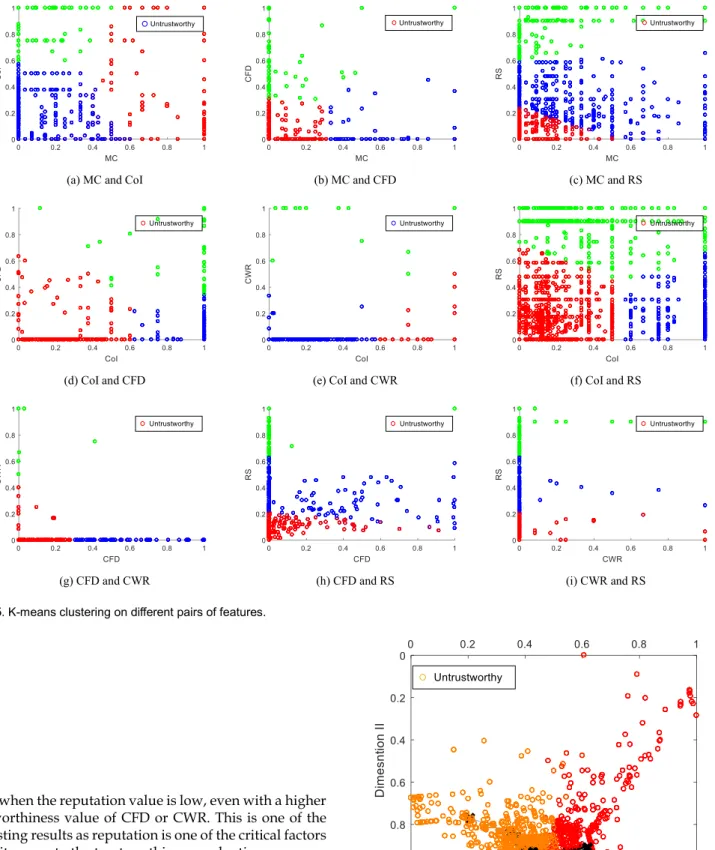
With the successful abstraction of the trust features, the next step is to investigate how to combine each of them to generate a final trust value. To filter out most trustworthi-ness interactions from untrustworthy interactions, the al-gorithm explained in Section 5 is applied and the results obtained are shown in Fig. 5. In order to decide the opti-mum number of clusters, the Elbow method is used as shown in Fig. 6. In certain feature combinations, the algo-rithm is capable to categorize interactions into three groups as trustworthy, neutral, and untrustworthy. In-stances where the Elbow method gives K=3 represent such situations. The results clearly shows the boundaries of sep-aration from the untrustworthy interactions as marked in Fig. 5.
As an example, let us consider Fig. 5(a) that shows the distribution of trust values compared to centrality and community interest. It can be observed that the region above MC=0.6 and CoI=0.6 is the trustworthy region with respect to these two features. Similarly, Fig. 5(b) to Fig. 5(g) show a clear boundary between the trustworthy and un-trustworthy regions. However, Fig. 5(h) and Fig. 5(i) show slightly different results compared to others. In both fig-ures, the trustworthiness boundaries are learned with one common feature: the reputation. From Fig. 5(h) and Fig. 5(i), it is noticeable that the algorithm finds a lower trust Fig. 4. Distribution of Trustworthiness Relative to Object “45”. Fig. 3. Distribution of Trustworthiness with respect to each Feature. A 5th
order polynomial is used to fit the data, distributed between 0 and 1.
(a) k=2 (b) k=3
value when the reputation value is low, even with a higher trustworthiness value of CFD or CWR. This is one of the interesting results as reputation is one of the critical factors when it comes to the trustworthiness evaluation process.
Note that we first run the algorithm pairwise to gener-ate visual results and then combine all five features to find out the trustworthy region as shown in Fig. 7 where PCA is used to reduce the feature dimensions from 5D to 2D for the sake of visualizing the results. To bring the new dimen-sions into the range of 0 and 1, feature normalization is im-plemented. It can be clearly observed that values over around 0.5 on the 1st dimension and values over around 0.7 on the 2nd dimension show the boundary between
trustworthy and untrustworthy interactions.
7.3 Algorithm II: Classification Model
Having investigated which interactions belongs to the Fig. 7.Application of Algorithm I on features obtained via PCA.
(a) MC and CoI (b) MC and CFD (c) MC and RS
(d) CoI and CFD (e) CoI and CWR (f) CoI and RS
(g) CFD and CWR (h) CFD and RS (i) CWR and RS
trustworthy region, we have used this information to label the data set. As an example, let’s consider the same case in Fig. 5 (a). The points around the cluster centroid of the un-trustworthy region are labeled as unun-trustworthy or “0” in the label vector “y”, whereas the points outside the un-trustworthy centroid are labeled as un-trustworthy or “1”.
Then, with the labeled data, we train a model that can clearly identify whether incoming interactions are trust-worthy. To estimate the optimum boundary, it is im-portant to calculate the best regularization parameters “C” and ”gamma” for each scenario mentioned above to avoid the data overfitting. For that, we have used part of the training samples as a cross validation set and the results obtained via the trained model are shown in Fig. 8 that clearly illustrates the decision boundary between the trust-worthy and untrusttrust-worthy regions.
Furthermore, Fig. 9 shows the result after applying the dimensionality reduction for all five features. For instance, let us consider Fig. 8(a) in which the CoI and MC are in consideration. Now it is a matter of applying this model to the new data stream to distinguish which interactions fall into the trustworthy region and vice versa without any
weight or threshold calculation. This not only reduces the calculation complexity and redundant work but also saves the processing time.
With these proven results, it is evident now that the sys-Fig. 9.Application of Algorithm II on all features obtain via PCA.
(a) MC and CoI (b) MC and CFD (c) MC and RS
(d) CoI and CFD (e) CoI and CWR (f) CoI and RS
(g) CFD and CWR (h) CFD and RS (i) CWR and RS
tem does not need to rely on conventional weighting fac-tors and thresholds to decide the region of trustworthiness. However, the main assumption of this research is the cen-tralized nature of the trust computation platform. Particu-larly, we assume that every object in consideration is sub-scribed to a centralized DR for publishing its data so that the trust computational platform can access the data, train a model, and publish the trust values back into the DR, which can be used by trustors.
To demonstrate the effectiveness of our proposed method over the most common methods like the liner ag-gregation of TAs, a confusion matrix method is considered. Classification accuracy often gives misleading results and hides the details needed to diagnose the performance of the model especially when the number of observations in each class varies as in our data set. On the other hand, the confusion matrix shows at which point the algorithm makes errors or gets confused and importantly the types of errors made, which is critical for the investigation of algo-rithm applicability over expected results. For the compari-son, we consider liner algorithms described in [15], [16 ] and a nonlinear algorithm described in [47]. The obtained results are shown in Table 2. Based on the results from Ta-ble 2, parameters that define the performance of each algo-rithm is shown in the Table 3.
In classification, Recall gives an important insight about classification performance relative to the number of wrong predictions. According to our simulation results, the pro-posed algorithm shows 100% Recall or true positive rate (TPR) compared to 98.13% by the linear methods. As the data set is relatively small, 2% performance improvement in the proposed algorithm will be very critical in real world application deployment where billions of transactions happen in each second. This is again confirmed by the false negative rate (FNR) where the proposed algorithm shows 0% false negative predictions in comparison with 1.8% false predictions by liner methods. Note that TPR is similar in both proposed and nonlinear methods, as the nonlinear method only replaces the second part of the proposed al-gorithm. But, the proposed method outperforms the non-linear approach as it gives a lower false positive rate (FPR) and a higher true negative rate (TNR) in contrast to the lo-gistic regression, indicating that the proposed method shows compelling performance against untrustworthy ob-jects.
Further, there are infinite possibilities when aggregat-ing multiple TAs usaggregat-ing a linear weighted summation method. However, in this comparison, the same weighting factors given by the clusterization algorithm are used in the liner algorithm to calculate the final score. Due to this reason, both proposed and logistic regression methods
give a comparatively low score in contrast to the linear method. However, in realistic case, it is difficult to estimate these weighting factors without a proper clusterization al-gorithm as discuss in this work and hence precision will severely degrade compared to our proposed method. On the other hand, the regularization factor used to manage the over fitted data and the optimization algorithm used to find the optimum parameters for the features could have a significant effect on this cause. Thus, the precision of both models can be increased by observing the learning curve while tweaking this regularization factor depending on the data set and using advance methods of optimization as de-scribed in [48], [49].
Moreover, the algorithms described in this paper can be clustered so that the end devices can perform a fraction of the analysis and obtain the same results as before. This is quite beneficial in an environment like IoT where scalabil-ity and collaboration are prominent factors. To establish a distributed platform and address scalability issues, meth-ods like map-reduction and data parallelism will be con-sidered as strong candidate technologies in our future work [50].
8
C
ONCLUSION ANDF
UTUREW
ORKIn this paper, a novel algorithm is proposed as opposed to traditional weighted summations to determine whether an incoming interaction is trustworthy, based on several trust features corresponding to an IoT envi-ronment. First, we have presented a generic trust com-putational model and a feature extraction method that can be applied to any service scenarios in IoT. Then a method for labeling the data depending on their trust-worthiness is realized based on unsupervised learning techniques, which is the vital first step for any system to identify which interactions are trustworthy. Following this labeling process, a trust prediction model, which can correctly identify the trust boundaries of any inter-actions and learn the best parameters to combine each TA to obtain a final trust value, is proposed based on the well-known SVM model. Our simulation results have shown promising outcomes including the ability and accuracy of the algorithm with respect to identify-ing trustworthiness interactions.
ACKNOWLEDGMENT
This research was supported by Basic Science Research TABLE2
ALGORITHM COMPARISON WITH CONFUSION MATRIX
Trustworthy Untrustworthy Trustworthiness Prediction Proposed 105 12 Linear 105 2 Nonlinear 105 19 Untrustworthi-ness Prediction Proposed 0 2862 Linear 2 2874 Nonlinear 0 2855 TABLE3
PARAMETERS DERIVED FROM CONFUSION MATRIX
TPR/Recall FPR Precision Proposed 1 0.004175 0.897436 Linear 0.981308 0.000695 0.981308 Nonlinear 1 0.006611 0.846774 Proposed 0 0.995825 Linear 0.018692 0.999305 Nonlinear 0 0.993389 FNR TNR
Program through the National Research Foundation of Ko-rea (NRF) funded by the Ministry of Science and ICT (2018R1A2B2003774).
REFERENCES
[1] F. Y. Wang, “The Emergence of Intelligent Enterprises: From CPS to CPSS,” IEEE Intelligent Systems, vol. 25, no. 4, pp. 85-88, 2010. [2] L. Atzori, A. Iera, G. Morabito, and M. Nitti, “The Social Internet
of Things (SIoT) – When social networks meet the Internet of Things: Concept, architecture and network characterization,”
Computer Networks, vol. 56, no. 16, pp. 3594-3608, 2012.
[3] ITU-T, “Overview of trust provisioning for information and communication technology infrastructures and services, ”
Recommendation Y.3052, 2017.
[4] S. P. Marsh, “Formalising trust as a computational concept,” Ph.D. dissertation, Dept. Computing Science and Mathematics, University of Stirling, Stirling, Scotland, UK., 1994.
[5] U. Jayasinghe, N. B. Truong, G. M. Lee, and T.-W. Um, “RpR: A Trust Computation Model for Social Internet of Things,” in Smart
World Congress , Intl IEEE Conferences on Ubiquitous Intelligence & Computing, 2016, pp. 930-937.
[6] U. Jayasinghe, H. W. Lee, and G. M. Lee, “A Computational Model to Evaluate Honesty in Social Internet of Things,” in 32nd
ACM SIGAPP Symposium On Applied Computing, Marrakesh,
Morocco., 2017.
[7] N. B. Truong, U. Jayasinghe, T.-W. Um, and G. M. Lee, “A Survey on Trust Computation in the Internet of Things,” The Journal of
Korean Institute of Communications and Information Sciences (J-KICS), vol. 33, no. 2, pp. 10-27, 2016.
[8] F. Fei, S. Li, H. Dai, C. Hu, and W. Dou, “A K-Anonymity Based Schema for Location Privacy Preservation,” IEEE Transactions on
Sustainable Computing, vol. PP, no. 99, pp. 1-1, 2017.
[9] T. Jim, “SD3: a trust management system with certified evaluation,” in Proceedings 2001 IEEE Symposium on Security and
Privacy S&P, 2001, pp. 106-115.
[10] L. Xiong, and L. Liu, “A reputation-based trust model for peer-to-peer e-commerce communities,” in IEEE Intl. Conference on
E-Commerce,CEC., Newport Beach, 2003, pp. 275-284.
[11] M. Blaze, J. Feigenbaum, J. Ioannidis, and A. Keromytis, “The KeyNote Trust-Management System Version 2, ” 1999.
[12] M. A. Azer, S. M. Kassas, A. W. F. Hassan, and M. S. El-Soudani, “A survey on trust and reputation schemes in ad hoc networks,” in Third International Conference on Availability,
Reliability and Security ARES 08, 2008, pp. 881-886.
[13] G. Suryanarayana, and R. N. Taylor, A survey of trust management
and resource discovery technologies in peer-to-peer applications, ISR
Technical Report UCI-ISR-04-6, University of California, 2004. [14] L. E. Holmquist, F. Mattern, B. Schiele, P. Alahuhta, M. Beigl, and
H.-W. Gellersen, “Smart-Its Friends: A Technique for Users to Easily Establish Connections between Smart Artefacts,” in
Proceedings of the 3rd international conference on Ubiquitous Computing, Atlanta, Georgia, USA, 2001, pp. 116-122.
[15] M. Nitti, R. Girau, and L. Atzori, “Trustworthiness management in the social internet of things,” IEEE Transactions on knowledge
and data engineering, vol. 26, no. 5, pp. 1253-1266, 2014.
[16] F. Bao, and I.-R. Chen, “Dynamic trust management for internet of things applications,” in Proceedings of the 2012 international
workshop on Self-aware internet of things, 2012, pp. 1-6.
[17]F. Huang, “Building social trust: A human-capital approach,”
Journal of Institutional and Theoretical Economics JITE, vol. 163, no.
4, pp. 552-573, 2007.
[18]G. Möllering, “The nature of trust: From Georg Simmel to a theory of expectation, interpretation and suspension,” Sociology, vol. 35, no. 2, pp. 403-420, 2001.
[19]M. Momani, and S. Challa, “Survey of trust models in different network domains,” Int. J. Ad Hoc Sensor Ubiq. Comput, vol. 1, no. 3, pp. 1-19, 2010.
[20]W. Sherchan, S. Nepal, and C. Paris, “A survey of trust in social networks,” ACM Comput. Surv., vol. 45, no. 4, pp. 1-33, 2013. [21]Y. Zhang, H. Chen, and Z. Wu, “A Social Network-Based Trust
Model for the Semantic Web,” in Intl Conference on Autonomic and
Trusted Computing, Berlin, Heidelberg, 2006, pp. 183-192.
[22]R. Gavriloaie, W. Nejdl, D. Olmedilla, K. E. Seamons, and M. Winslett, “No registration needed: How to use declarative policies and negotiation to access sensitive resources on the semantic web,” in European Semantic Web Symposium, Berlin, Heidelberg, 2004, pp. 342-356.
[23]W. Nejdl, D. Olmedilla, and M. Winslett, “Peertrust: Automated trust negotiation for peers on the semantic web,” in Workshop on
Secure Data Management, Berlin ,eidelberg, 2004, pp. 118-132.
[24]L. Atzori, A. Iera, and G. Morabito, “From "smart objects" to "social objects": The next evolutionary step of the IoT,” IEEE
Communications Magazine, vol. 52, no. 1, pp. 97-105, 2014.
[25]S. Nepal, W. Sherchan, and C. Paris, “Strust: A trust model for social networks,” in IEEE 10th International Conference on Trust,
Security and Privacy in Computing and Communications (TrustCom),
2011, pp. 841-846.
[26]S. Adali, R. Escriva, M. K. Goldberg, M. Hayvanovych, M. Magdon-Ismail, B. K. Szymanski, W. A. Wallace, and G. Williams, “Measuring behavioral trust in social networks,” in IEEE
International Conference on Intelligence and Security Informatics (ISI),
2010, pp. 150-152.
[27]Y. Hu, D. Wang, H. Zhong, and F. Wu, “SocialTrust: Enabling long-term social cooperation in p2p services,” Springer P2P
Networking and Applications, vol. 7, no. 4, pp. 525-538, 2014.
[28]M. Nitti, R. Girau, L. Atzori, A. Lera, and G. Morabito, “A Subjective Model for Trustworthiness Evaluation in the Social IoT,” in IEEE Intl. Symposium on Personal Indoor and Mobile Radio
Communications, PIMRC, Australia, 2013, pp. 18-23.
[29]J. Zhan, and X. Fang, “A novel trust computing system for social networks,” in IEEE Third International Conference onPrivacy,
Security, Risk and Trust (PASSAT) and IEEE Third Inernational Conference on Social Computing (SocialCom), 2011, pp. 1284-1289.
[30]G. Yin, F. Jiang, S. Cheng, X. Li, and X. He, “Autrust: A practical trust measurement for adjacent users in social networks,” in
Second International Conference on Cloud and Green Computing (CGC), 2012, pp. 360-367.
[31]F. Jiang, Y. Fu, B. B. Gupta, F. Lou, S. Rho, F. Meng, and Z. Tian, “Deep Learning based Multi-channel intelligent attack detection for Data Security,” IEEE Transactions on Sustainable Computing, vol. PP, no. 99, pp. 1-1, 2018.
[32]J. Shen, D. Liu, D. He, X. Huang, and Y. Xiang, “Algebraic Signatures-based Data Integrity Auditing for Efficient Data Dynamics in Cloud Computing,” IEEE Transactions on Sustainable