Tools and reference standards supporting the engineering and evolution of
synthetic biological systems
By Jason R. Kelly
Bachelor of Science, Biology and Chemical Engineering Massachusetts Institute of Technology, 2003
Submitted to the Department of Biological Engineering in Partial fulfillment of the requirements for the degree of
Doctor of Philosophy in Biological Engineering at the
Massachusetts Institute of Technology May 2008
© 2008 Jason R. Kelly. All rights reserved The author hereby grants MIT permission to reproduce
and to distribute publicly paper and electronic copies of this thesis document in whole or in part
in any medium known or hereafter created.
Signature of Author: ______________________________________________________ Department of Biological Engineering
May 23, 2008
Certified by: _____________________________________________________________ Drew Endy
Assistant Professor of Biological Engineering Thesis Supervisor
Accepted by: ____________________________________________________________ Alan J. Grodzinsky
Professor of Electrical, Mechanical, Biological Engineering Chairman, Course XX Graduate Program Committee
2
This doctoral thesis has been examined by a committee of the Biological Engineering Department as follows:
Thesis Committee Chairman: ... Edward F. DeLong Professor of Biological Engineering Professor of Civil and Environmental Engineering
Thesis Supervisor, Committee Member: ... Drew Endy Cabot Assistant Professor of Biological Engineering
Thesis Committee Member:... Thomas F. Knight, Jr. Senior Research Scientist, Computer Science & Artificial Intelligence Laboratory
3
Abstract
Biological engineers have constructed a number of multi-part synthetic biological systems that conduct logical operations on input signals, produce oscillatory output signals, store memory, or produce desired products. However, very few of these genetically-encoded systems worked as originally designed. The typical process of constructing a functional system involves a period of tuning the system properties to find a functional variant. This tuning process has been optimized and applied with great success to the engineering of individual biological parts by directed evolution. For instance, researchers developing improved enzymes, transcriptional promoters, and fluorescent proteins have generated large libraries of variants and screened these libraries to find individual mutants that met desired performance specifications. In this thesis, I address some of the bottlenecks preventing the application of directed evolution to more complex devices and systems. First, I describe an input / output screening plasmid that was designed to enable screening of higher-order genetic devices based on the equilibrium response of the device. This plasmid includes two fluorescent reporters and an inducible promoter to enable screening of device libraries across a range of inputs. Second, I describe measurement kits and reference standards designed to improve the characterization of promoter and RBS parts that are used as input substrates for device evolution. By using the kits, researchers are able to report promoter and RBS
activities in standard units (Standard Promoter Units, SPUs, and Standard RBS Units, SRUs) enabling the growth of a collection of well-characterized parts to draw on for assembling device variants. Finally, I describe a new microfluidic device, the Sortostat, that integrates a cell sorting chamber with a previously published microscope-mounted microfluidic
chemostat. Researchers can use the Sortostat to apply morphological, time-varying, or other complex selective pressures to cells in continuous culture.
4
Acknowledgements
To my wife-to-be Hillary, thanks for being a perfect balance to me. I would be completely off the rails if you weren’t around. To my parents and my sister Amanda, thanks for always supporting me 100% and helping me remember what really matters.
I’d like to thank Tom Knight for showing me what a real hacker looks like. It’s such an unbelievably rare phenotype that it’s startling to actually meet one. Thanks to Ed Delong for providing helpful comments throughout my thesis, and to Frederick Balagadde for teaching me to design and debug microfluidic chips.
Thanks to the OpenWetWare posse (Sri, Ilya, Reshma, Barry, Austin) for basically starting up a small business on the side of their graduate projects. Working as a team to boot up OWW was one of the best parts of my graduate experience (making E.coli smell like bananas was pretty sweet too) and it’s in large part due to working with such a thoughtful, talented group.
I have to use “I” throughout this thesis because it’s apparently some convention, but it is ridiculous to suggest that the work here is mine alone. I’ve been privileged to work with no less than seven MIT undergraduate students: Josh Michener, Kelly Chang, Bryan
Hernandez, Andrzej Wojcieszynski, Karen Wong, Nishant Baht, and Adam Rubin. Without their help I literally wouldn’t have a thesis.
5
I’ve been blessed with so many amazing friends that I really can’t list them. Special thanks though to Barry, Amy, and Victor for tolerating me as a housemate for 4 years - the Buddha Lounge will live forever.
I have wanted to hack biological systems for a really long time. As a freshman at MIT I rushed to the lab and spent the following four summers realizing that even at the best engineering school in the world they didn’t know how to do it. Drew, thanks for changing my mind.
6
Table of Contents
Chapter 1. Introduction ... 12
Chapter 2. pSB1A10, A PoPS Input/Output Characterization and
Screening Plasmid. ... 18
2.1 Summary ... 18
2.2 Introduction ... 19
2.3 Results and Discussion ... 24
2.3.1 pSB1A10 design & construction ... 24
2.3.2 Characterization of six BioBrick Transcription Terminators ... 29
2.3.3 Characterization of nine BioBrick Inverters ... 32
2.3.4 Repair and Reuse of a Tet repressor-based inverter ... 37
2.3.5 Testing inverters in series, BBa_Q04401 and BBa_Q04740 ... 43
2.3.6 pSB3K10, a low copy, simplified PoPS input / output characterization and screening plasmid ... 46
2.4 Conclusions ... 47
Chapter 3. Measurement kits and reference standards for BioBrick
promoters and ribosome binding sites. ... 49
3.1 Summary ... 49 3.1.1 Background ... 49 3.1.2 Results ... 50 3.1.3 Conclusions ... 50 3.2 Introduction ... 51 3.3 Results ... 60
3.3.1 Measurement kit design & construction ... 60
3.3.2 Definitions and models for promoter and RBS activity ... 63
3.3.3 Demonstration of Measurement kit utility... 69
3.3.4 Variability due to measurement procedures ... 71
3.3.5 Inter-laboratory variation ... 73
3.4 Discussion ... 75
3.4.1 Suggested improvements ... 76
3.4.2 Standard promoter and RBS definition ... 79
3.4.3 Measurement procedures ... 80
3.4.4 Absolute and relative units ... 81
7
3.5 Conclusions ... 83
Chapter 4. Sortostat: An integrated microchemostat and optical cell
sorting system ... 84
4.1 Summary ... 84
4.2 Introduction ... 85
4.3 Results and Discussion ... 88
4.3.1 Design and operation of the microchemostat ... 88
4.3.2 Design and Fabrication of the Sortostat microfluidic chip ... 92
4.3.3 Sortostat automated platform. ... 95
4.3.4 Operating the Sortostat ... 96
4.3.5 Models of Sortostat function ... 99
4.3.6 Proof of principle experiments ... 100
4.3.7 Demonstration of chemostat operation and verification of expected statistical distributions ... 101
4.3.8 Demonstration of time-varying selective pressure in the Sortostat ... 106
4.3.9 Rescue of a slower growing subpopulation in the Sortostat ... 109
4.3.10 Improvements for future versions of the Sortostat ... 112
4.4 Conclusions ... 114
Chapter 5. Future Work ... 116
5.1 Introduction ... 116
5.2 Scaffold for tuning inverters by inserting libraries of parts. ... 118
5.3 Part specification for BioBrick promoters ... 120
5.3.1 “Fauxmoters” ... 122
5.4 Models for describing the operation of the Sortostat ... 123
Appendix A. Materials and Methods for Chapter 1 ... 127
A.1 Bacterial Strains, Media, and Chemicals ... 127
A.2 Characterization of BioBrick Inverters and Terminators ... 127
A.3 Construction of inverter libraries ... 128
A.4 Inverters in series ... 129
Appendix B. Materials and Methods for Chapter 2 ... 131
8
B.2 Kit contents ... 131
B.3 Construction of test constructs... 132
B.4 Assay of promoter-RBS collection ... 133
B.5 Assay of different measurement conditions ... 134
B.6 Assay of inter-laboratory variability ... 136
Appendix C. Materials and Methods for Chapter 3 ... 138
C.1 Details of PDMS chip design and fabrication ... 138
C.2 Previous designs of the Sortostat ... 139
C.3 Details of Sortostat automated platform ... 141
C.4 Comparison of the growth rate of CFP expressing and YFP expressing cells. ... 143
C.5 Image processing ... 144
C.6 Thin channels for improved image processing ... 144
C.7 Common failure modes ... 145
Appendix D. Supplementary materials for Chapter 2 ... 147
D.1 Modeling ... 147
D.1.1 Derivation of the relationships between absolute promoter or RBS activity and GFP synthesis rate or GFP concentration ... 147
D.1.2 Derivation of promoter activity in SPUs as a function of GFP synthesis rate .... 148
D.1.3 Derivation of promoter activity in SPUs as a function of GFP concentration .... 149
D.1.4 Derivation of RBS activity in SRUs as a function of GFP synthesis rate ... 150
D.1.5 Derivation of RBS activity in SRUs as a function of GFP concentration ... 152
D.2 Alternate designs for the RBS and promoter measurement kits ... 153
D.3 Transcription start site prediction ... 154
D.4 Calculating the relationship between PoPS and SPUs ... 154
D.5 Calculating the relationship between protein production rate and SRUs ... 156
9
List of Figures
Figure 1-1 Directed evolution mapped onto an abstraction hierarchy for engineering
biological systems. ... 15
Figure 2-1 Schematic of the PoPS Input/ Output characterization and screening plasmid (pSB1A10) ... 21
Figure 2-2 Examples of PoPS Input / Output devices ... 23
Figure 2-3 RNAseE sites were designed to insulate the reporter mRNA from the test part or device mRNA. ... 27
Figure 2-4 RNAseE sites help to insulate reporter mRNA stability ... 28
Figure 2-5 Characterization of the termination efficiency of six BioBrick terminators ... 31
Figure 2-6 Characterization of BBa_Q04740 ... 35
Figure 2-7 Summary of triplicate experiments characterizing the inverter BBa_Q04740. ... 36
Figure 2-8 Two rounds of screening on a FACS machine of an inverter library generated via mutatgenic PCR of the non-functional inverter, BBa_Q04400. ... 39
Figure 2-9 Characterization of BBa_Q04401, a successfully repaired inverter. ... 40
Figure 2-10 Successful reuse of inverter BBa_Q04401 by the MIT iGEM team in an engineered system for controlling bacterial odor. ... 42
Figure 2-11 Schematic of pSB3K10. ... 47
Figure 3-1 The British Standard Ohm resistor is an early example of a reference standard. 54 Figure 3-2 Overview of using the measurement kit ... 56
Figure 3-3 Instructions for inserting a promoter into the promoter measurement kit and measuring the promoter activity in Standard Promoter Units (SPUs). ... 58
Figure 3-4 Measurement of the activity of a test set of (A) promoters and (B) RBSs using the measurement kits. ... 70
Figure 3-5 Measurement of the activity of a set of four promoters using four different measurement procedures... 72
Figure 3-6 Comparison of promoter activities measured by researchers in seven independent laboratories using the measurement kit. ... 75
Figure 4-1 A schematic of chemostat and a picture of the microchemostat. ... 86
Figure 4-2 Cutaway view of a “push down” PDMS microfluidic valve ... 89
10
Figure 4-4 Two modes of operation of the microchemostat. ... 91
Figure 4-5 Final design for the Sortostat microfluidic chip. ... 94
Figure 4-6 Addition of the sorting chamber to the microchemostat design ... 95
Figure 4-7 Schematic of the Sortostat automated platform. ... 96
Figure 4-8 Demonstration of operating the Sortostat as a normal chemostat ... 101
Figure 4-9 Demonstration of operating the Sortostat as a normal chemostat ... 102
Figure 4-10 Comparison of model distribution to experimental results for the number of cells captured in the sorting chamber. ... 104
Figure 4-11 Theoretical joint probability distribution of the total number of cells in the sorting chamber and the number of CFP expressing cells in the sorting chamber agrees with experimental data... 105
Figure 4-12 Demonstration of time-varying selection using the Sortostat ... 108
Figure 4-13 Demonstration of the rescue of a slower growing subpopulation of cells using the Sortostat. ... 111
Figure 4-14 Demonstration of the rescue of a slower growing subpopulation of cells using the Sortostat. ... 112
Figure 5-1 Schematic of the scaffold for tuning tetR-based inverters. ... 119
Figure 5-2 Comparison of Sortostat model with experimental results. ... 125
Figure A-1 Relationship between GFP and RFP fluorescence measured by the same procedure used to characterize the inverters (Chapter A.2)... 130
Figure C-1 An example of a common fabrication error: valves that don’t completely seal. ... 139
Figure C-2 Schematic of the six reactor design of the Sortostat. ... 141
Figure C-3 Comparison of the growth curves of the CFP expressing cells (blue) and YFP expressing cells (red) used in all experiments with the Sortostat. ... 143
Figure C-4 Example of image processing... 144
Figure C-5 Micrograph of 3 µm high channels (arrows) that are used to bring the cells in a microchannel into a narrowed plane of focus. Image courtesy of Frederick Balagadde [83]. ... 144
Figure D-1 Example of typical growth curves... 157
Figure D-2 Example of GFP synthesis rate time series ... 158
Figure D-3 Instructions for inserting an RBS into the RBS measurement kit and measuring the promoter activity in Standard RBS Units (SRUs). ... 159
11
List of Tables
Table 2-1 Mean termination efficiency of six BioBrick terminators characterized with
pSB1A10. ... 30
Table 2-2 Results of characterization of nine BioBrick inverters. ... 34
Table 2-3 Listing of inverters previously coupled in synthetic biological systems... 45
Table 3-1 Components of promoter measurement kit ... 57
Table D-1 Components of RBS measurement kit ... 161
Table D-2 Listing of the flow cytometer equipment used at the seven laboratories that participated in the inter-laboratory variability study. ... 162
Table D-3 Growth rates of cells containing the 4 promoter test constructs that were used in the inter-laboratory study measured relative to the reference standard. ... 162
12
Chapter 1. Introduction
“There are only two ways we know of to make extremely complicated things. One is by engineering, and the other is evolution.” -Danny Hillis [1]
There is a third approach for construction of complicated things that combines forward engineering and evolution. This hybrid approach requires that the substrate be both designable and evolvable. The design and construction of engineered biological systems may be amenable to such an approach. Here, I outline a framework for constructing engineered biological systems that combines elements of forward engineering with evolution in order to increase the likelihood of producing functional systems.
Directed evolution
Directed evolution has been used extensively by biological engineers in developing improved enzymes [2], transcriptional promoters [3], and fluorescent proteins [4].
Additionally, directed evolution has been applied in other fields such as electrical
engineering [5] and computer science [6] where algorithms and circuit designs are made to replicate, mutate, and compete under human defined selective pressures. The process of directed evolution can be divided into three general components: (1) inputs, (2) assembly, and (3) screening.
13
Inputs are the substrate materials that are used to generate libraries of variants of a target system. When evolving biological parts the most common inputs are nucleotides that are assembled to form libraries of DNA sequences. In computer science or electrical engineering the inputs might be logical functions assembled to form executable code [7]. The features of a good input substrate include: physical composability such that the input can be physically combined with other inputs, functional composability such that a collection of inputs assembled together will be expected to produce systems with some function, and well characterized inputs so that libraries can be constructed from the sets of inputs that are most likely to produce the desired system function. Nucleotides provide an excellent input
substrate for the directed evolution of engineered biological parts since they can be readily assembled into larger DNA molecules that reliably function within cells. Additionally, the physical properties of nucleotides are well characterized and libraries can be generated that are biased for particular functionality such as forming hairpins [8], having a low melting temperature, or encoding a particular subset of amino acids [9].
High-throughput assembly of the input substrate to construct large libraries of variants of a target system is essential to generate the diversity necessary to drive directed evolution. When evolving biological systems, common approaches for generating diversity include mutagenic PCR or de novo DNA synthesis. De novo synthesis in particular is very well suited to assembling large, targeted libraries based on user specifications.
Finally, high-throughput screens or selections are needed in order to isolate functional mutants from large libraries of variants. FACS machines, automated 96 well plate-based
14
assays, and colony-picking robots can be used to rapidly screen libraries of biological systems. However, it is essential that the desired system functionality has a phenotype that can be detected by one of these automated platforms. This requirement for a detectable phenotype becomes more challenging as the complexity of our biological systems increases.
Abstraction
As biological engineers, we can make use of abstraction in order to simplify the design and construction of engineered biological systems. A previously described ‘abstraction hierarchy’ for standard biological parts was designed to support the rational engineering of biological systems by managing complexity [10]. This hierarchy consists of four layers: DNA, parts, devices, and systems. ‘DNA’ is genetic material, ‘parts’ are basic biological functions composed of DNA, ‘devices’ are any combination of parts that perform a human-defined function, and ‘systems’ are any combination of devices. I have mapped the three components of the directed evolution process (inputs, assembly, and screening) onto the abstraction hierarchy (Figure 1-1) to consider how we might best make use of standard parts and abstraction to apply directed evolution to more complicated engineered biological systems.
15
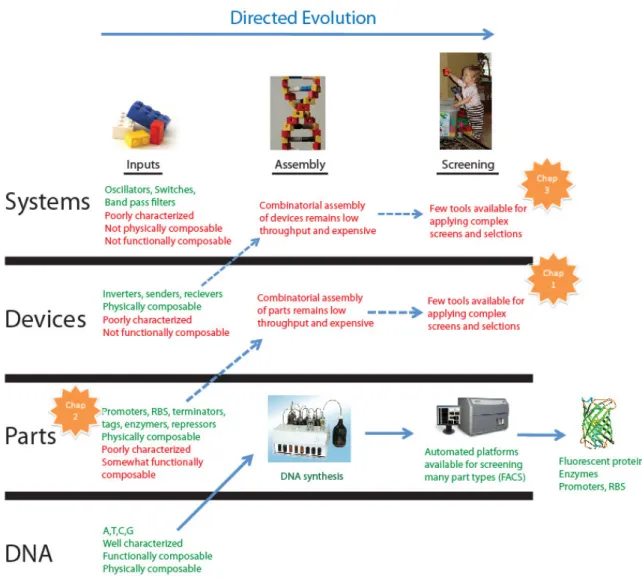
Figure 1-1 Directed evolution mapped onto an abstraction hierarchy for engineering biological systems.
The solid blue arrow represents the successful application of directed evolution of parts. The inputs to the process are DNA nucleotides, these nucleotides can be assembled into
enormous libraries in a cheap, automated process (de novo DNA synthesis), and high-throughput screens are available for many part functions. A canonical example of the success of this pathway is the directed evolution of new, improved fluorescent protein variants that appear on a nearly monthly basis. Applying directed evolution for the production of devices or systems (dotted blue arrows) remains challenging as there are bottlenecks in all three steps of the directed evolution process: the inputs, the assembly of the inputs into libraries, and the screening of libraries for functional mutants. I have highlighted the area of focus of each of my thesis chapters with orange stars.
16
Biological engineers might like to apply directed evolution to the construction of parts, devices, or systems that accomplish desired functions. Unfortunately, to date there has only been significant success in the directed evolution of biological parts, though this success has had tremendous impact in both the academia and industry [11, 12]. I have traced a path through the abstraction hierarchy describing the inputs, available technology for assembly, and mechanisms for screening that allow a smooth transition from input nucleotides to evolved parts with desired function such as fluorescent proteins [4] or enzymes [2].
When we try to move up the hierarchy in order to evolve devices such as an inverter [13] we quickly run into bottlenecks in all three steps of the directed evolution process. The input substrate is standard parts such as promoters, ribosome binding sites (RBSs),
terminators, and protein coding regions. These parts are often not well defined, nor are they always functionally composable. As an example, an RBS characterized in one context might have a different activity or no activity at all when assembled into a different context [14]. The assembly stage in the directed evolution of devices presents a significant bottleneck as researchers are unable to create large libraries of devices composed of parts. There is not yet the equivalent of the DNA synthesizer for high-throughput assembly of parts, although several techniques begin to address this challenge [15-17]. Finally there exist only a few screening or selection platforms capable of selecting for the more complicated functions associated with devices [18, 19]. For instance, many devices have complicated input / output functions or have an output that varies over time. Moving further up the abstraction
17
even less well characterized than parts and harder to functionally combine due to challenges like signal matching between devices [13].
In this thesis I address some of the bottlenecks preventing the application of directed evolution to devices and systems. In Chapter 1, I describe a plasmid, pSB1A10, that was designed to enable screening of devices based on the input / output curve of the device. Additionally, I describe future work constructing a plasmid scaffold that enables easier assembly of parts into inverter libraries. In Chapter 2, I describe measurement kits and reference standards designed to improve the characterization of the parts used as input substrate for device evolution. By using the kit, researchers will be able to report promoter and RBS activity in standard units (Standard Promoter Units, SPUs and Standard RBS Units, SRUs) enabling the growth of a library of characterized parts to draw on for assembling device variants. Additionally, I describe future work to specify a promoter standard
(“fauxmoters”) that will improve the functional composability of promoter parts. In Chapter 3, I describe a new microfluidic device, the Sortostat, that integrates a cell sorting chamber with a previously published microscope-mounted microfluidic chemostat. Researchers can use the Sortostat to apply morphological, time-varying, or other complex screens that might be associated with screening a system library. The bottleneck targeted by each chapter is marked in Figure 1-1.
18
Chapter 2. pSB1A10, A PoPS Input/Output Characterization and
Screening Plasmid.
[The work presented in this chapter was carried out in collaboration with Josh Michener, Kelly Chang, Andrzej Wojcieszynski, and Felix Moser]
2.1
Summary
Directed evolution has proven to be a powerful tool in the biological engineer’s arsenal, supporting the engineering of enzymes, fluorescent proteins, and many other parts. Applying directed evolution to more complicated devices and systems will require new tools for screening and selection. I designed and constructed a characterization and screening plasmid (pSB1A10) that could be used to characterize the input / output function of BioBrick parts and devices that use a transcription signal (RNA polymerase per second, PoPS) as input or output. I explored the functionality of pSB1A10 by characterizing a set of six BioBrick transcription terminators as well as a set of nine BioBrick inverters. I demonstrated use of pSB1A10 to screen an inverter library to isolate a functional inverter mutant. I attempted to combine two inverters in series and characterize them in pSB1A10 to explore the challenge of device composition. Finally, I implemented a new version of pSB1A10 to try to account for some of the shortcomings in the original design. Although these first-generation
19
new tools and approaches to tuning biological parts and devices via library generation and screening.
2.2
Introduction
Biological engineers have constructed a number of multi-part synthetic biological systems that conduct logical operations on input signals [20, 21], produce oscillatory output signals [22], store memory [23], or produce desired products [24, 25]. However, very few of these synthetic biological systems worked as originally designed. The typical process of constructing a functional system involves a period of tuning the system to find a functional variant [26]. This tuning process has long been applied with success to the engineering of individual biological parts by directed evolution. For instance, researchers developing improved enzymes [2], transcriptional promoters [3], and fluorescent proteins [4] have made use of directed evolution to find variants that met their desired performance specifications. The directed evolution process involves generating large libraries (1E5-1E9 members) of part variants by using methods such as mutagenic PCR or de novo DNA synthesis followed by high-throughput screening or selection to isolate desirable mutants. A similar process may be applied to the construction of multi-part, synthetic biological systems, however it will require advances in our ability to assemble libraries of systems made from standard components and our ability to screen for the more complicated functions associated with these systems (Chapter 1).
20
Researchers have begun to explore the application of directed evolution techniques to multi-part devices. For instance, Yokobayashi et al successfully applied screening [19] and selection [18] to a library of inverters and isolated variants with desired properties.
However, these proof-of-principle examples were not designed to support re-usability across many different parts or devices. A researcher applying these previous tools to screen a new system would need to repeat much of the construction and design work on the screening platform itself. Furthermore, screening using these previous tools was accomplished by a plate-based assay that relied on a qualitative measure a single reporter of the output of device function. More quantitative screens could be conducted using a FACS based screening assay with reporters for both input and output transcription rates.
Here I describe pSB1A10, a PoPS input / output characterization and screening plasmid. PoPS, or RNA polymerases per second, is a common signal carrier for
transcription-based parts and devices [27]. My overall goals in designing pSB1A10 were to enable users to insert a BioBrick part or device into the plasmid and characterize the input / output function of the part or device as well as to enable the screening of libraries of devices based on their input / output functions. My design for pSB1A10 (Figure 2-1) consists of four components (1) an inducible PoPS generator device, (2) an input PoPS measurement device, (3) an insertion site for the test part or device to be characterized, and (4) an output PoPS measurement device. I used the paraBAD inducible expression system [28] as the inducible PoPS generator device, green fluorescent protein (GFP) and red fluorescent protein (RFP) as
21
indicators of input and output PoPS rates, respectively, and a BioBrick cloning site [29] flanked by RNAseE cleavage sites as the site for part or device insertion.
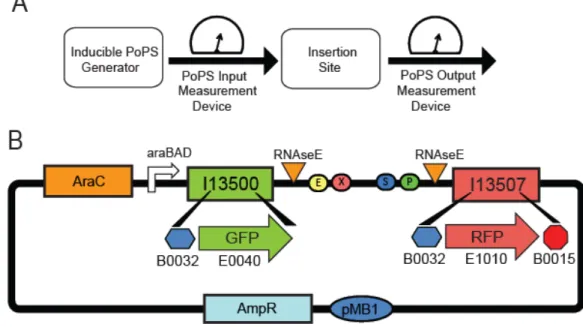
Figure 2-1 Schematic of the PoPS Input/ Output characterization and screening plasmid (pSB1A10)
(A) The design is made up of four components: (1) an inducible PoPS generator for providing a variable PoPS input into the test part or device, (2) a PoPS input measurement device for reporting the amount of PoPS input provided by the PoPS generator, (3) an insertion site for enabling cloning of a test part or device into pSB1A10, and (4) a PoPS output measurement device for reporting the amount of PoPS exiting the device. (B) The pSB1A10 construct contains: (1) an AraC expression cassette and paraBAD promoter that is inducible by arabinose as an inducible PoPS generator, (2) BBa_I13500 as the PoPS input measurement device, (3) The standard BioBrick cloning site flanked by RNAseE sites; the sites are used to insulate the test part or device mRNA from the reporter proteins mRNAs, and, (4) BBa_I13507 as the PoPS output measurement device.
In order to characterize a part or device using pSB1A10, users first insert the test part or device into the BioBricks cloning site on pSB1A10 via standard BioBricks assembly [30]. The assembled plasmid containing the test part or device is then transformed into the testing
22
strain (CW2553, Methods). The test part or device is characterized across a wide range of input PoPS levels by growing replicate cultures of the cells in media with different arabinose concentrations to induce the PoPS generator. The cells are grown to steady-state and the fluorescence intensity of GFP and RFP are measured using a flow cytometer to provide a measure of the input / output function for the test part or device.
I explored the functionality of pSB1A10 by attempting to characterize a set of six BioBrick transcription terminators as well as a set of nine BioBrick inverters (Figure 2). I “repaired” the functionality of a broken inverter by generating a library of inverters via mutagenic PCR and screening with pSB1A10 for a mutant with the appropriate function. I attempted to characterize the performance of two inverters in series using pSB1A10. Finally, based on my experiences using pSB1A10, I designed and tested a new version of a
23
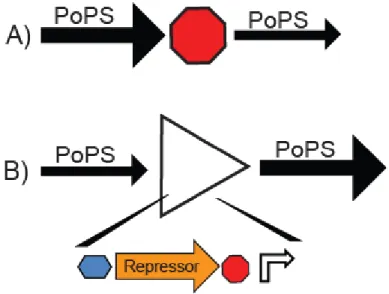
Figure 2-2 Examples of PoPS Input / Output devices
Inverters and transcription terminators are examples of devices and parts that send and receive PoPS as a signal. (A) A terminator receives an input PoPS signal and produces an output signal that is a fraction of the input. The fractional output depends on the efficiency of the terminator. A terminator that was 100% efficient would always output 0 PoPS, a terminator with 99% efficiency would output 1% of the PoPS input signal. (B) An inverter receives an input, performs a logical NOT operation, and produces a corresponding output. For example, the inverter here is shown converting a low PoPS signal into a high PoPS signal. An inverter is composed of four parts, a ribosome binding site (blue), the coding region for a repressor protein (orange), a transcription terminator (red), and the promoter regulated by the repressor (white).
24
2.3
Results and Discussion
2.3.1pSB1A10 design & construction
I had five goals in designing pSB1A10. First, I wanted to make use of a common signal carrier for gene expression (such as polymerase per second, PoPS) [27] to enable any part or device that uses PoPS as an input or output signal to be characterized or screened without requiring the user of pSB1A10 to redesign the plasmid. Second, I wanted to include a reporter of the per cell input transcription rate (PoPS) into the test device to account for cell to cell variation of the activity of the arabinose-inducible paraBAD promoter in response to the inducer concentration. Third, I wanted to enable characterization and screening of parts and devices across a wide range of PoPS inputs and outputs. Fourth, I wanted reporters of input and output transcription rate that were insulated from the part or device being
measured. In other words, the relationship between the measurable reporter output and the transcription rate (PoPS) should remain constant regardless of the device being tested, thus characterization should be comparable across different devices. Fifth, I wanted to conform to the BioBrick physical assembly standard for inserting parts or devices into pSB1A10 to allow compatibility with the large collection of existing parts and devices in the MIT Registry of Standard Biological Parts[31].
To meet my first design goal, I designed the PoPS output reporter device to convert a common signal carrier, PoPS, into a measurable fluorescence signal via expression of red fluorescent protein (RFP). I designed the PoPS input reporter device to measure PoPS
25
entering the test device by converting a PoPS signal into a measurable fluorescence signal via expression of green fluorescent protein (GFP). Because the input and output reporter devices were designed to detect PoPS, any device that accepts an input signal in PoPS and outputs a signal in PoPS can be characterized using pSB1A10 without needing to alter the plasmid. Examples of such parts and devices include transcription terminators and inverters (Figure 2-2).
To meet my second design goal, accounting for cell to cell variability in the activity of the input PoPS generator, I included an input reporter device (BBa_I13500) upstream of the insertion site that allows for a per cell measurement of the PoPS entering the test part or device based on measurement of the per cell concentration of GFP using a flow cytometer.
To meet my third design goal, I needed an inducible PoPS generator that provides a wide range of input PoPS. I chose the paraBAD promoter from the E.coli arabinose operon. This promoter has been shown previously to provide linear induction across nearly three orders of magnitude in a previously reported expression system [28]. To ensure linear induction of the paraBAD promoter Khlebnikov et al. removed the natively controlled arabinose transport gene (araE) and instead constitutively expressed araE from a plasmid. I chose the araE knockout strain (CW2553) containing a plasmid that constitutively expressed araE (pJat8) as the characterization strain [32].
To meet my fourth design goal, to insulate the reporter device performance from the specific part or device being tested, I included RNAseE cleavage sites flanking the insertion site [33]. The RNAseE cleavage sites were designed to insulate the stability of the GFP and
26
RFP mRNA from the part or device that is inserted between them. Insulation is necessary since inserted parts or devices may be transcribed as a polycistronic mRNA containing both the sequence of the part or device and the sequence of the reporter, thus potentially
influencing the stability of the reporter mRNA. As an example, in response to a constant induction level the GFP (input) measurement could differ depending on the device inserted downstream of GFP, preventing reliable comparison of input measurements (Figure 2-3A). By including RNAseE sites I expect that the reporter mRNA will be cleaved from the test device mRNA forming separate secondary transcripts (Figure 2-3B) and increasing the insulation between reporter performance and the device being measured. If the lifetimes of the secondary transcripts are long compared to the lifetime of the original transcript then the system will behave as if the two mRNAs were produced independently. I conducted
27
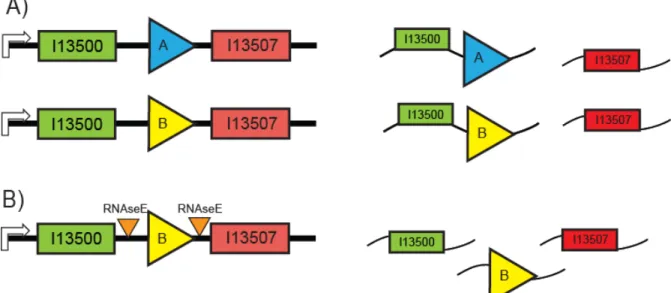
Figure 2-3 RNAseE sites were designed to insulate the reporter mRNA from the test part or device mRNA.
In order to make comparable measurements of the PoPS input and output function of a collection of test parts or devices, it is necessary that the PoPS input and output reporter devices function equivalently independent of the test part or device being measured. (A) In many cases (for instance with an inverter as shown here) one of the reporter genes is
transcribed on the same mRNA as a portion of the test part or device. As a result of this polycistronic message, the PoPS input measurement device will produce mRNAs with different stabilities for different test devices (for instance, inverter A might stabilize the GFP mRNA, while inverter B might de-stabilize the mRNA). (B) In order to insulate the stability of the PoPS input reporter mRNA from the test part or device I included RNAseE sites so that the polycistronic mRNA would be cleaved by RNAseE. The cleavage event will produce secondary transcripts that are independent of the test part or device.
28
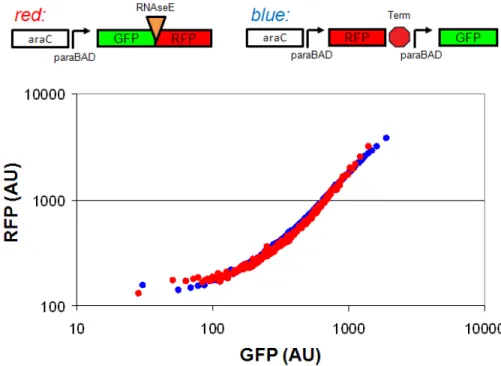
Figure 2-4 RNAseE sites help to insulate reporter mRNA stability
To test the efficacy of the RNAseE sites, I measured the GFP and RFP fluorescence (in arbitrary units, AU) from two constructs across six arabinose induction levels (Methods),
red: GFP and RFP separated by an RNAseE site and expressed by the paraBAD promoter on a polycistronic mRNA and blue: GFP and RFP on separate mRNA transcripts each
expressed from a separate paraBAD promoter. The fluorescence was measured on a flow cytometer and data from measuring six separate cultures at different arabinose induction levels was combined into a single data set. The plot shows the average GFP and RFP fluorescence for each of 100 logarithmically-spaced bins based on GFP fluorescence. The GFP and RFP fluorescence measurements are equivalent for the two constructs within the error of the measurements, suggesting that the RNAseE sites may help to insulate the reporter mRNA transcripts. The conclusion is further supported by previous results (not shown) comparing RFP on its own transcript to RFP on a polycistonic mRNA downstream of GFP with no RNAseE site between the coding regions. There I found that the
polycistonic mRNA increased the expression of RFP, however the expression was not from the paraBAD promoter and therefore is not directly comparable to the results shown here. Further experiments to quantify the amount of cleaved and uncleaved transcript directly are needed to confirm the efficacy of the RNAseE sites.
29
To meet my fifth design goal, to enable compatibility with BioBrick parts, I chose to use the standard BioBrick cloning site for the insertion site in pSB1A10. Any part or device from the Registry of Standard Biological Parts can be easily inserted into pSB1A10 in a single cloning step [29].
2.3.2Characterization of six BioBrick Transcription Terminators
I used pSB1A10 to measure the termination efficiency of a set of three BioBrick transcription terminators in the forward (BB_B0011, BBa_B0014, BBa_B0015) and reverse direction (BBa_B0021, BBa_B0024, and BBa_B0025). These terminators were chosen since they are used across many engineered biological systems built using BioBrick parts, in particular BBa_B0015 is one of the most widely used parts in the Registry (Randy Rettberg, personal communication). The termination efficiency was determined by measuring the per cell GFP and RFP fluorescence with a flow cytometer (Methods) after growing cells under a single induction level (0.003% arabinose). Terminator efficiencies were calculated by the following formula described previously [34]:
1 ! " ! "# $! Eq. 2.1
Where the subscript term refers to the measured GFP and RFP fluorescence when pSB1A10 contains a terminator and the subscript control refers to the measured fluorescence from pSB1A10 when no part is inserted in the insertion site (equivalent to 0% termination efficiency). The ratio of RFP to GFP fluorescence after background subtraction was
30
averaged across all cells in the population for the control (denoted by the mean superscript). The ratio of RFP to GFP fluorescence after background subtraction was calculated for each cell in the population of cells containing pSB1A10 with a terminator inserted. The mean measured termination efficiency across all cells in the population for each terminator is provided in table 2-1. Since I measured the termination efficiency for each individual cell I also determined the distribution of termination efficiencies across cells in the population (Figure 2-5). Terminator BioBrick# Terminator Efficiency BBa_B0011 0.95 BBa_B0014 0.96 BBa_B0015 0.97 BBa_B0021 0.86 BBa_B0024 0.86 BBa_B0025 0.62
Table 2-1 Mean termination efficiency of six BioBrick terminators characterized with pSB1A10.
31
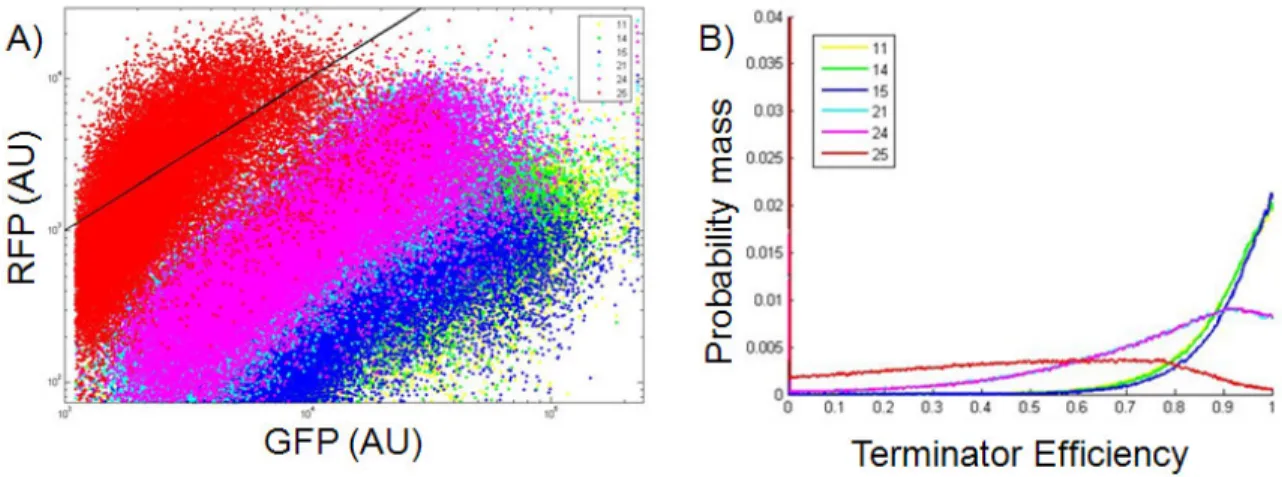
Figure 2-5 Characterization of the termination efficiency of six BioBrick terminators
(A) Dot plot of the flow cytometer measurements of GFP and RFP fluorescence from each cell in the population. The black line represents the best fit of the control pSB1A10 without a terminator inserted (in other words, termination efficiency = 0%). Terminators are
expected to fall below the black line since for any given PoPS input (GFP) they are expected to produce a lower PoPS output (RFP) then the control with 0% termination efficiency. (B) The probability mass function (pmf) was calculated for the efficiency of each terminator.
In order to characterize the input / output relationship of a part or device using pSB1A10 I assume that the measured GFP and RFP fluorescence are directly related to the PoPS input and output of the part or device. However, in the case of transcription
terminators this assumption is not fully justified. When a read-through event occurs (necessary for RFP to be expressed), a new hairpin is introduced to the 5’ end of the RFP mRNA transcript due to the terminator hairpin itself being part of the transcribed mRNA. It is known that 5’ hairpins are capable protecting transcripts from RNAseE cleavage [35], and as a result it is possible that the RFP mRNA transcript is not being cleaved at the engineered RNAseE site within pSB1A10. Without this cleaving event the insulation between the
32
particular part being measured and the downstream reporter (RFP) may be lost. This can have an unpredictable impact on the stability of the RFP mRNA transcript and will increase the error in terminator efficiency measurements. Future work is needed to better predict mRNA degradation rates from primary sequence or to design flanking sequences that might fix the degradation rates of mRNA at one predictable value [33].
2.3.3Characterization of nine BioBrick Inverters
I measured the input / output transfer curves of a set of nine BioBrick inverters (Table 2). The nine inverters contained four different repressor proteins taken from natural
biological systems: Tet repressor (BBa_C0040) from transposonTn10, c2 repressor (BBa_C0053) and Mnt (BBa_C0072) repressor from bacteriophage P22, and PenI (BBa_C0074) repressor from Bacillus lichenformis. Additionally each of the repressor proteins have a C-terminus degradation tag (LVA) to target the protein for degradation by ClpXP or ClpAP [36]. The tags were included to reduce the half-life of the repressor
proteins so that protein levels in the cell will respond more rapidly to changes in transcription input to the inverter. Faster response times are often needed for the proper function of
dynamic systems such as an oscillator [22].
I did not design or construct any of the inverters characterized here; all devices were received from the Registry of Standard Biological Parts [31]. For each type of inverter (Tet, c2, Mnt, or PenI-based) multiple variants were present in the Registry containing RBSs with different activities upstream of the repressor coding region (Table 2-2). I inserted each of the
33
nine inverters into pSB1A10 and measured the steady-state input and output PoPS level for each inverter in response to six induction levels (0%, 1E-6%, 3E-6%, 1E-5%, 3E-5%, 1E-4% arabinose) (Methods). Of the nine inverters tested I found that only one (BBa_Q04740) changed its output PoPS level across the range of induction levels tested (Figure 2-6 & 2-7). The remaining eight inverters were found to be unresponsive to different induction levels, remaining locked in either the low output (repressed) state or the high output (un-repressed) state (Table 2-2).
34
RBSs upstream of the repressor coding region (relative RBS activity) BBa_B0031 (0.01) BBa_B0033 (0.07) BBa_B0032 (0.38) BBa_B0034 (1.0)
TetR High Output BBa_Q01400
High Output BBa_Q03400
Low Output BBa_Q04400
P22 cII Low Output BBa_Q01530
Low Output BBa_Q04530
PenI High Output
BBa_Q03740 High Output BBa_Q02740 Functional BBa_Q04740 Mnt High Output BBa_Q04720
Table 2-2 Results of characterization of nine BioBrick inverters.
‘High Output’ indicates that independent of the input PoPS rate into the inverter the output of the inverter was always in the un-repressed state. ‘Low output’ indicates that independent of the input PoPS rate into the inverter the output of the inverter was always in the repressed state. ‘Functional’ indicates that across the PoPS input range provided by pSB1A10 the inverter transitioned from being un-repressed to repressed. Only one of the nine inverters was functional across the input range tested (BBa_Q04740).
35
Figure 2-6 Characterization of BBa_Q04740
Dot plots of the GFP (x-axis, input) and RFP (y-axis, output) fluorescence measurements of the inverter BBa_Q04740 characterized in pSB1A10 across six different arabinose induction levels (arabinose percent w/w is shown in figure).
36
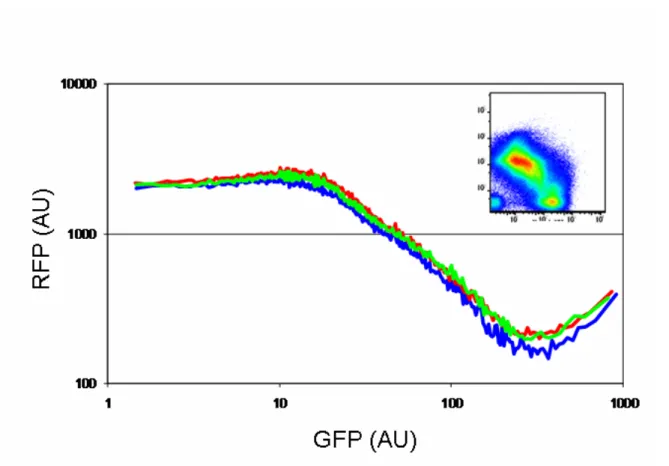
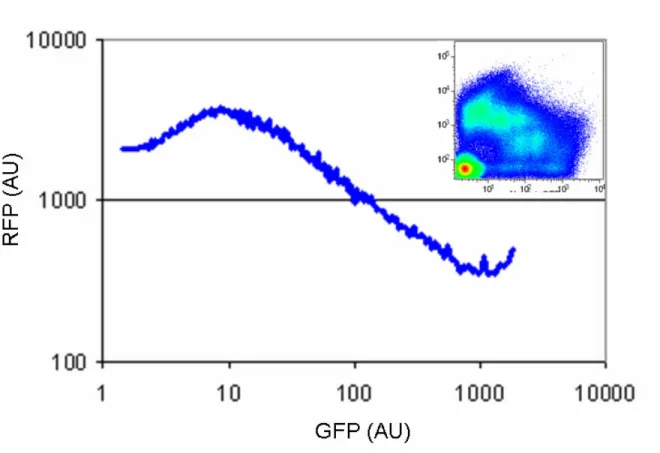
Figure 2-7 Summary of triplicate experiments characterizing the inverter BBa_Q04740.
The dot plot in the upper right is the concatenation of the six dot plots shown in figure 2-6. This concatenated data was then grouped into 100 logarithmically-spaced bins based on GFP fluorescence and the mean GFP and RFP fluorescence was calculated for each bin to produce the simplified transfer curves shown in the main graph. Each line on the transfer curve represents a replicate characterization of BBa_Q04740.
It is not surprising that eight of nine inverters did not properly function in the context of pSB1A10. In their native systems, the repressor proteins used in the inverters are present at different copy numbers and in different genetic backgrounds and culture conditions. We should expect that many parts and devices harvested from natural systems will need to be
37
“tuned” in order to perform appropriately in our engineered systems [26]. In order to demonstrate the use of pSB1A10 to tune inverters via library screening I repaired one of the eight non-functional BioBrick inverters: BBa_Q04400, the Tet repressor-based inverter.
2.3.4Repair and Reuse of a Tet repressor-based inverter
The details of the characterization of the failed inverter variants (Table 2-2) are informative in deciding the appropriate strategy for tuning inverters to function in pSB1A10. In particular the characterization results of the three variants of the Tet repressor-based inverter (BBa_Q01400, BBa_Q03400, and BBa_Q04400) show that by changing the activity of the RBS in the inverter the function of the device changes from a state where it is un-repressed across all induction levels (BBa_Q01400, BBa_Q03400) to a state where it repressed across all induction levels (BBa_Q04400). Furthermore, these results make
intuitive sense in light of the measured activities of the RBSs in the three Tet repressor-based inverters. An RBS with a higher activity will produce more repressor protein across all induction levels. Thus, I expect a more active RBS such as the one in BBa_Q04400 to lead to inverters locked in the repressed state due to over-expression of repressor protein, while weaker RBSs such as those in BBa_Q01400 and BBa_Q03400 to be more likely to lead to inverters locked in the un-repressed state because of insufficient expression of repressor proteins. The results of the characterization of the three Tet repressor-based inverters
suggested that both the Tet repressor (BBa_C0040) and the Tet repressor-regulated promoter (BBa_R0040) were functioning properly as the promoter could be both repressed
38
(BBa_Q04400) and un-repressed (BBa_Q01400 and BBa_Q03400). Thus, I expected that repair of the inverter could be accomplished by tuning the activity of the RBS.
The other broken inverters (Mnt and p22 cII repressor-based) showed either a low output with a weak RBS (BBa_Q01530) or high output with a strong RBS (BBa_Q04720). Thus it is possible that these inverters have different flaws than an incorrect expression level of the repressor protein, such as a dysfunctional repressor protein (BBa_Q04720) or a dysfunctional promoter (BBa_Q01530). Depending on the cause of the device failure these problems might be harder to solve via library generation and screening than tuning expression level. I attempted to repair all three inverters (not shown), however I was only successful in tuning the performance of the Tet repressor-based inverter, BBa_Q04400.
In order to repair BBa_Q04400 I generated a library of inverters by amplifying the BBa_Q04400 DNA with a mutagenic PCR reaction using primers that maintained the standard BioBrick restriction sites at the ends of the DNA sequence of each library member (Methods). I digested the inverter library with EcoRI and PstI and inserted the library into pSB1A10 in a single cloning reaction. The transformants were maintained in liquid culture rather than plated in order to maintain a large library size (~1E5 mutants). I then conducted two rounds of screening on the inverter library (Figure 2-8). In the first round I grew the cells with low induction (no arabinose) and screened for cells that had a low input PoPS (low GFP signal) and a high output PoPS (high RFP signal) using a FACS machine to sort the cells that met my criteria into a sub-library. I conducted a second round of screening on the sub-library of cells generated in the first round; I grew the cells in the presence of high
39
induction (1E-4% arabinose) and screened for cells that had a high input PoPS (high GFP signal) and a low output PoPS (low RFP signal) again using a FACS machine to sort promising candidates into a separate sub-library.
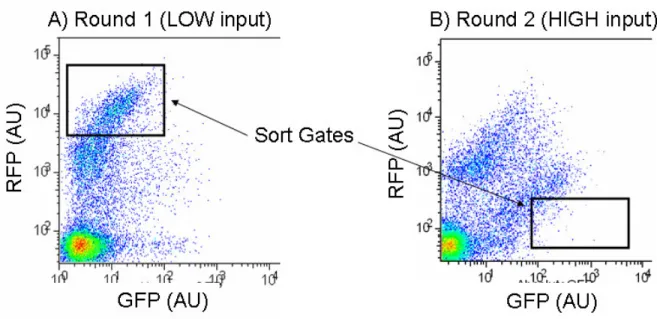
Figure 2-8 Two rounds of screening on a FACS machine of an inverter library generated via mutatgenic PCR of the non-functional inverter, BBa_Q04400.
In the first round of screening (A) the cells are gown in media with 0% arabinose (low input) and cells are sorted using a FACS machine based on the sort gate shown. The sort gate defines a region of cells with a low input (1X-10X background GFP) and a high output (100X – 1000X background RFP). In the second round of screening (B) the
subpopulation of cells screened in round 1 are grown in media with 10E-4% arabinose (high input) and are selected based on a sort gate for high input (100X-1000X background GFP) and low output (1X-10X background RFP).
The final sub-library after two rounds of screening was plated to isolate individual mutants as single colonies, and five of these mutants were tested across six different arabinose induction levels (0%, 1E-6%, 3E-6%, 1E-5%, 3E-5%, 1E-4% arabinose). One
40
mutant was found that had a characteristic input / output transfer curve for an inverter (Figure 2-9), this inverter was given a new BioBrick part number, BBa_Q04401.
Figure 2-9 Characterization of BBa_Q04401, a successfully repaired inverter.
The dot plot in the upper right is the summary data of the GFP (input) and RFP (output) fluorescence measurements of the inverter BBa_Q04401 characterized in pSB1A10 across six different arabinose induction levels (0%, 1E-6%, 3E-6%, 1E-5%, 3E-5%, 1E-4%
arabinose). This summary data was then grouped into 100 logarithmically-spaced bins based on GFP fluorescence and the mean GFP and RFP fluorescence was calculated for each bin to produce the simplified transfer curve shown in the main graph.
I sequenced BBa_Q04401 and found a single base pair mutation in the RBS upstream of the repressor coding region (the mutant RBS was given a new BioBrick part number,
41
BBa_B0064). I tested the activity of this RBS and found it to be 36% as active as the original RBS in BBa_Q04400 and about 5X as active as the weaker RBS in BBa_Q04340 (not shown). These results confirmed my intuition that tuning of the expression level could repair this inverter. The process also suggested that I may be able to produce libraries containing more functional mutants by combining collections of functional elements (for instance, inserting a collection of RBSs of varying strength into the inverter) rather than by generating libraries via random mutagenesis of DNA. However, previous work by
Yokobayashi et al to tune a cI-based inverter by generating a library at the sequence level yielded several functional variants with mutations that inserted stop codons within the cI gene resulting in truncated repressor proteins [19]. These types of mutants would be less likely to be made in a parts-based approach to generating part libraries, thus it remains an open question whether generating libraries via mutagenesis at the sequence level or via combining collections of functional elements would yield libraries with more functional variants.
BBa_Q04401 was successfully re-used by the MIT 2006 iGEM team [37] to invert the signal of a stationary phase promoter (Figure 10). This promoter was present on pSB1A2 which has the same origin of replication and thus a similar copy number to pSB1A10. In general, re-using devices in a similar context to the context in which they were tuned will increase the likelihood of successful device function.
42
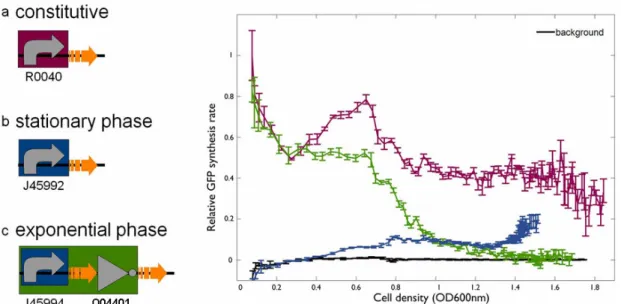
Figure 2-10 Successful reuse of inverter BBa_Q04401 by the MIT iGEM team in an engineered system for controlling bacterial odor.
The blue line represents the promoter activity measured by GFP synthesis rate per cell in a growing culture from a promoter (BBa_J45992) that increases in activity in stationary phase (notice the increase in activity from OD 0.4 to 0.8). The green line represents the same promoter upstream of inverter BBa_Q04401. The “inverted” stationary phase promoter now shows a high activity in exponential phase (OD < 0.6) and upon entry into stationary phase the activity drops significantly (down to background levels by OD = 1.4). Figure courtesy of Reshma Shetty [13].
43
2.3.5Testing inverters in series, BBa_Q04401 and BBa_Q04740
After successfully screening for a functional Tet repressor-based inverter, I now had two functioning inverters (BBa_Q04401 and BBa_Q04740). A central challenge in system construction is the composition of individual devices into a larger system that works as predicted. For instance, would the two functioning inverters work properly when placed in series? Though other researchers have previously combined inverters in series (Table 3), predicting the function of the multi-inverter system a priori remains challenging. For instance, based on the transfer curves for each inverter (Figure 2-7 and 2-9) I could make a rough estimate of whether the inverters would function properly in series (Methods). I found that the inverters should work in one order (BBa_Q04401 preceding BBa_Q04740), but not in the reverse order.
I assembled the inverters in both orders and attempted to insert the pair into
pSB1A10. I found that when Q04401 preceded Q04740 the output of the combined device was always a low signal independent of the input PoPS, thus my prediction based on the individual transfer curves was inaccurate. Additionally, the cells grew significantly slower (growth rate reduced by ~25%) than cells containing only a single inverter. I expect this difference in growth rate affects the steady-state concentrations of repressor proteins, leading to system functioning that is harder to predict. In the reverse order (Q04740 preceding
44
Q04401) I was unable to successfully clone the construct after many attempts. I concluded that pSB1A10 containing the inducible PoPS-generator device, two fluorescent protein PoPS reporter devices, as well as two inverters in series placed too much of a load on cellular resources, particularly on a high copy plasmid. To address this problem, I designed a new version of pSB1A10.
Promoter / Repressor 1 Promoter / Repressor 2 Ptrc-2 / lacI P Ls1con / temp-sensitive repressor (cIts) Ptrc-2 / lacI PLtetO-1 / Tet repressor (tetR) PLtetO-1 / Tet repressor (tetR) Plac / lacI
Plac / lacI λP(R-O12) / cI
P LlacO1 / lacI-lite PLtetO1 / tetR-lite PLtetO1 / tetR-lite λPR / cI-lite λPR / cI-lite P LlacO1 / lacI-lite Plac(on colE1) / lac (on chromosome) Ptet / tetR-eCFP fusion (on colE1) Plac / lacI (on
p15A)
λP(R-O12) (on
ColE1) /cI
(on P15A)
Table 2-3 Listing of inverters previously coupled in synthetic biological systems.
45 Direction of coupling Replication Origin Antibiotic resistance Both ColE1 (pBR322 vector) AmpR JM2.300 Both ColE1 (pBR322 vector) AmpR JM2.300 1 2 p15A KanR Transfor 1 2 p15A KanR Transfor 1 2 pSC101 AmpR MC4100 1 2 pSC101 AmpR MC4100 1 2 pSC101 AmpR MC4100 1 2 Chromosome / colE1 AmpR 1 2 p15A / ColE1 KanR(p15A) / AmpR (ColE1)
Listing of inverters previously coupled in synthetic biological systems.
Strain Ref JM2.300 [23] JM2.300 [23] Transfor Max EPI300 [38] Transfor Max EPI300 [38] MC4100 [22] MC4100 [22] MC4100 [22] JM101 [39] DH5 [19]
46
2.3.6pSB3K10, a low copy, simplified PoPS input / output characterization and screening plasmid
I re-designed the characterization and screening plasmid by (1) moving to a low copy plasmid in order to reduce the load on the cellular resources, (2) removing the input
measurement device to simplify the measurement of device performance and to further reduce the load on cellular resources, and (3) changing to an inducible PoPS generator with less strain and plasmid requirements. The new design uses BBa_F2621 as an inducible PoPS generator, GFP as the reporter of PoPS output, and a p15A origin of replication that results in approximately a 10X lower copy number than pSB1A10. I tested pSB3K10 (Figure 10) by inserting the BBa_Q04401 inverter that I had previously tuned to function in pSB1A10, however I found that the inverter did not function properly in pSB3K10 and was locked in the low output state across a range of induction levels (data not shown). It is likely that I would need to re-tune the inverter to function in this new context (new PoPS input range, new copy number of the plasmid). To support explore whether inverter libraries with more functional variants might be made by inserting libraries of parts, I have designed a new construct for tuning inverters by inserting part libraries, rather than making mutations at the sequence level (Chapter 5).
47
Figure 2-11 Schematic of pSB3K10.
A simplified version of the original measurement and screening plasmid was designed. This design does not require any particular strain background, and also will place a lower demand on cellular resources than pSB1A10 due to the lower copy number of the plasmid and having only one PoPS reporter device (BBa_E0240).
2.4
Conclusions
I explored the functionality of the characterization and screening plasmid, pSB1A10, by characterizing a set of six BioBrick transcription terminators as well as a set of nine BioBrick inverters. I found all but one of the inverters did not function over the range of PoPS inputs provided by the inducible PoPS generator device in pSB1A10. The dysfunction of eight of the inverters is not surprising; in their native systems the repressor proteins are present in different copy numbers, genetic backgrounds, and culture conditions. We should expect that many parts and devices harvested from natural systems will need to be “tuned” in order to perform appropriately in our engineered systems [26].
In order to demonstrate the use of pSB1A10 to tune inverters via library screening I successfully repaired one of the eight non-functional BioBrick inverters: BBa_Q04400, the Tet repressor-based inverter. I repaired the functionality of BBa_Q04400 by generating a
48
library of inverters via mutagenic PCR and screening with pSB1A10 for a mutant with the appropriate function. A mutant was isolated, characterized, and reused by others in a newly engineered system. The approach of tuning parts in a format (such as the BioBrick standard) that allows for easy reuse by others will improve our ability to reliably construct multi-part synthetic biological systems.
I attempted to combine two inverters in series as well as to characterize BBa_Q04401 (the repaired inverter) in a new lower-copy characterization plasmid. Both these experiments failed and point to future work that is needed to improve the reliability of device tuning and composition. First, part and device definitions are needed that specify the characteristics of parts and devices needed to enable reliable composition of these components into multi-part synthetic systems [13]. Second, future work is needed to build tools for tuning parts or devices to meet these defined standards for interoperability, reliability, or other desired part characteristics. In Chapter 6 I outline further research in support of this second goal.
49
Chapter 3. Measurement kits and reference standards for
BioBrick promoters and ribosome binding sites.
[This chapter is based on a manuscript that I co-wrote with Drew Endy (Kelly et al.,
submitted). The experimental work was done in conjunction with Adam Rubin. Experiments were run at independent laboratories by Caroline M Ajo-Franklin, John Cumbers, Michael J. Czar, Kim de Mora, Aaron L Glieberman, and Dileep D Monie]
3.1
Summary
3.1.1Background
The engineering of many-component, synthetic biological systems would be made easier by the development of collections of well-characterized, standard biological parts. The first examples of standard biological parts are BioBrick parts. These parts adhere to a technical standard that facilitates reliable physical assembly of parts into multi-component engineered biological systems, however the behavior of these systems remains difficult to predict a priori. Researchers could better predict the behavior of systems composed of standard biological parts if the individual parts were well characterized. Standard tools, techniques, and units of measure will be needed to support the characterization of parts by independent researchers across many laboratories.
50
3.1.2Results
We designed, built, and tested measurement kits for characterizing the in vivo activity of BioBrick promoters and ribosome binding sites (RBS). The kits contain measurement tools for determining promoter and RBS activity based on expression of green fluorescent protein. The kits also include a specific promoter and RBS selected as reference standards. By reporting the activity of a user-specified promoter or RBS relative to the activity of the reference promoter or RBS, independent researchers can calibrate their measurements and report them in newly defined, comparable units: standard promoter units (SPUs) and standard RBS units (SRUs). We demonstrated the utility of the kits by measuring the
activities of a collection of promoters and RBSs across a range of conditions and procedures. Finally, we distributed four promoters to six independent laboratories for characterization using the promoter measurement kit. The low level of variability in measured promoter activity (coefficient of variation ~ 0.113) across laboratories demonstrates that the kits provide a first mechanism for independent laboratories to report comparable measurements of the functioning of standard biological parts.
3.1.3Conclusions
The measurement kits will be distributed within the annual BioBrick parts
distribution and we encourage researchers to use the kits for characterization of BioBrick promoters and RBSs. Users of the kits can share data describing the activity of promoters and RBSs via the Registry of Standard Biological Parts
51
(http://partsregistry.org/measurement). Researchers working to improve measurement kits or reference standards can participate in open technical discussion via the BioBricks Foundation (http://biobricks.org/standards).
3.2
Introduction
The engineering of many-component, synthetic biological systems would be made easier by developing collections of well-defined, standard biological parts [10, 21, 40-43]. For example, standard components have been instrumental in managing complexity in most mature engineering fields by allowing engineers to reliably predict the function of large numbers of interacting components [44]. However, it is an open question whether the
overwhelming complexity of living systems will prevent biological engineers from achieving similar design capabilities. To help explore this question the MIT Registry of Standard Biological Parts maintains and distributes thousands of BioBrick standard biological parts [45]. BioBrick parts are the first example of standard biological parts that have been designed to enable reliable physical assembly of individual BioBrick parts into larger multi-component systems [40].
The ability of engineers to predict the behavior of engineered biological systems assembled from standard biological parts would be made easier if the functioning of these parts was well characterized [46-48]. Unfortunately, BioBrick parts are the only existing standard biological parts; most BioBrick parts remain to be quantitatively characterized. Part characteristics worth measuring vary by part type but typically include: static performance,
52
dynamic performance, genetic stability, or other characteristics [38, 49]. Characterization of parts might be carried out by dedicated, centralized facilities or by a distributed community of researchers. In either case, standard tools, techniques, and units of measure will be needed to reduce variability in the characterization of parts across independent researchers at many facilities. Reporting the activities of parts in standard units will allow future users of the parts to more confidently combine parts that have been characterized by an external group with parts that they themselves design and characterize.
Previous efforts to make standardized measurements of cellular functions highlight the challenges of taking consistent measurements across independent laboratories. For example, an analysis of 80 published papers in which researchers used beta-galactosidase (β -gal) activity as a measure of gene expression found at least six different protocols were used to measure enzymatic activity [50]. In addition, nearly all activities were reported in “Miller units” even though in several cases there were differences in the substrates used to quantify enzymatic activity (CPRG or ONPG), the experimental conditions (pH and temperature for the assay), and even the units of the Miller unit (nmol/min or µmol/min) [51]. Differences in conditions such as using either CPRG or ONPG as a substrate for enzymatic assays lead to incompatible results [52], thus Miller Units should generally not be considered comparable unless they have been calibrated against a common reference standard [50]. As a second example, comparing microarray data between independent studies is often impossible due to differences in array platforms, algorithms for image and data analysis, gene probe size, and many other parameters [53]. To address this challenge, the microarray community is
53
currently developing a set of external RNA reference standards to calibrate results across different array platforms [54, 55] and previously developed a community-wide specification, the Minimum Information About a Microarray Experiment (MIAME) definition, that can be used to standardize data input and reporting [56]. The biological engineering community should take a similar approach by developing and sharing standard methods, tools, and reference materials in support of the characterization of biological parts.
Reference standards have been used to account for variability in measurement procedures between independent workers in other engineering fields. For example, the British Association standard ohm resistor is a widely accepted reference standard [57] (Figure 3-1). Official copies of this reference standard for resistivity equivalent to one ohm were distributed to telegraph engineers, experimental physicists, and other researchers so that they could report their resistivity measurements relative to the resistivity of the reference standard (in other words, in standard units of ohms). The design of the standard ohm resistor was the end product of a long process of community discussion and debate that started with
ad hoc reference standards shared among smaller groups of telegraph engineers [58]. For example, one of the earliest reference standards was used by telegraph engineers to
demonstrate significant variability in the resistivity of ‘pure’ copper wire manufactured by different wire factories [58]. Prior to this ad hoc standard, differences in the resistivity of wires had been blamed on poor measurement tools or procedures rather than on the wire itself. The discovery of differences in the resistivity of supposedly pure copper wires