ISSN: 2502-4752, DOI: 10.11591/ijeecs.v10.i3.pp1007-1012 1007
Interference Temperature Measurements and Spectrum
Occupancy Evaluation in the Context of Cognitive Radio
Paulson N. Eberechukwu, Dauda S. Umar, Alias Mohd, Kamaludin M. Y, M. Adib bin Sarijari,Rozeha A. Rashid
Faculty of Electrical Engineering, Universiti Teknologi Malaysia, 81310 Skudai, Johor Bahru, Malaysia
Article Info ABSTRACT
Article history: Received Jan 15, 2018 Revised Mar 12, 2018 Accepted Mar 28, 2018
This paper presents a refined radio spectrum measurement platform specifically designed for spectrum occupancy surveys in the context of Cognitive radio. Cognitive radio permits the opportunistic usage of licensed bands by unlicensed users without causing harmful interference to the licensed user. In this work, a study based on the measurement of the 800 MHz to 2.4 GHz frequency band at two different locations inside Universiti Teknologi Malaysia (UTM), Johor Bahru campus, Malaysia is presented. Two Tektronix RSA306B spectrum analyzer are set up to conduct simultaneous measurements at different locations for a 24 hours period. The analysis conducted in this work is based on the real spectrum data acquired from environment in the experimental set up. Busy and idle channels were identified. The channels subject to adjacent-channel interference were also identified, and the impact of the detection threshold used to detect channel activities was also discussed. The consistency of the observed channel occupation over a range of thresholds and a sudden drop has good characteristics in determining an appropriate threshold needed in order to avoid interference. Keywords: Cognitive radio Interference temperature Measurement campaign Spectrum occupancy Tektronix RSA306B Wireless communications
Copyright © 2018 Institute of Advanced Engineering and Science. All rights reserved.
Corresponding Author: Rozeha A. Rashid,
Faculty of Electrical Engineering, Universiti Teknologi Malaysia, 81310 Johor Bahru, Johor, Malaysia. Email: [email protected]
1. INTRODUCTION
As wireless devices and wireless communication technology is being advanced, there is an increased scarcity of the radio spectrum resources. In the meantime, studies show that the present spectrum allocated isn’t optimally utilised. During the last few years, cognitive radio (CR) has appeared as a technology that promises to put an end to the problem of spectrum scarcity. This concept relies on the basic premise that spectrum is currently underutilized. In CR, the secondary user (SU) is permitted to simultaneously access the licensed frequency band of the primary user (PU) as long as the interference caused by the SU to the PU is kept below a predefined threshold. This ensures the spectrum is dynamically utilized, hence, there is a significant improvement in the spectrum utilization rate. In order to enable dynamic spectrum utilization (DSU), there is a need to critically comprehend the amount of spectrum used by the PU, identify the presence or the absence of PU, therefore having a formidable SU access policy. The measurement of spectrum occupancy level and analysing the interference temperature which is the core aim of this paper, has been motivated by the needs stated above. This problem is addressed using spectrum data collected at an indoor environment of two spatially different locations concurrently.
Recently, the DSU context has attracted a lot of interest. Previously, different groups have carried out measurement studies at different locations and time [1-6]. Results from these studies a lot of white space in the spectrum bands indicating that the spectrum is underutilized. Moreover, limited analysis has been conducted using such measurement data. A large percentage of these works are founded on theoretical analysis and channel models. While a large amount of theoretical analysis and protocols have been proposed for sensing-based approach, little is known on the applicability of the schemes in reality. The results of the measurements done in this work, can be utilized to validate different theoretical analysis and schemes within this research area. Therefore, the measurement of real network activities, provides a vital step toward an accurate understanding of DSU. This work also provides a real sample data of spatially diverse spectrum activity, which can be used to enumerate the spectrum utilization factor and access pattern of the PUs. In addition, the results can be used to evaluate the feasibility of different proposed schemes on channel probing and user detection and, to study spatial and temporal correlation between synchronized sensing units and across time.
In this work, a study of based on the measurement of the 800 MHz to 2.4G Hz frequency band at two different locations inside Universiti Teknologi Malaysia (UTM), Johor Bahru campus, Malaysia is presented. A setup consisting of two Tektronix RSA306B [7] spectrum analyzer (SA) was used to carry out measurements simultaneously at the two different locations for a 24 hours period. The analysis conducted is based on the real spectrum data acquired from environment in the experimental setup. Busy and idle channels were identified. The channels subject to adjacent-channel interference were also identified during the analysis and discussions. The effect of the detection threshold used to monitor channel activities was also analysed. The rest of the paper is organized as follows. A brief discussion on interference problems related to cognitive radio is presented in Section 2. Section 3 presents the sensing system and data collection methodology. Data processing and results analysis is discussed in Section 4. This work is concluded in Section 5.
2. INTERFERENCE PROBLEMS RELATED TO COGNITIVE RADIO
A categorization of potential interference from CR entities to the PU is discussed in this section. With the introduction of CR networks, there are two possible types of interference from CR networks. They are the interference from CR to primary networks and primary networks to CR interference.
2.1.CR-Primary Interference
The term interference temperature (IT) limit refers to the “worst case” interfering situation in a specific frequency band and at a precise geographic location for primary receivers [8, 9]. That is, it represents the maximum amount of interference that the primary receiver can tolerate. The IT model (ITM) tool is useful in describing the CR primary interference. An ideal ITM should account for the cumulative RF energy from numerous CR transmissions and sets a maximum cap on their aggregate level. CR users are then allowed to use a frequency band provided their activities in such band will not disrupt the IT limits of such band. Implementing such an ideal ITM usually necessitates real time interactions between CR transmitters and primary receivers and is therefore extensively regarded as practically impossible. Hence, several adapted ITM [10-11] have been recommended as more practical models for the CR-primary interference received at primary receivers. [10], defined interference as the estimated fraction of PUs whose services have been interrupted by nearby CR transmitters. Factors such as CR signal modulation, antenna gains, and power control were considered in this model. Though, this model only accounted for the case where the PU services were interrupted by just one CR user and it did not consider the cumulative effect of several CR transmissions. In [11], the cumulative effect of the amassed interference power was considered and a multifaceted stochastic models was built to describe the exact PDF.
2.2.Primary-CR Interference
The interference from primary to CR networks can be directly measured by CR receivers with passive sensing techniques. Based on the power spectral density (PSD) of the interfering PU signals, the spectra can be generally categorized into three: (i) Black spaces-spectra band being used by high-power PU signals which has a high probability to be detected by the CR receivers; (ii) Grey spaces refer to spectra band which has a low to medium power PU signals. They are very weak and as such may not be decoded satisfactorily by the CR receivers. Thus, can cause a significant amount of interference to the CR network; (iii) White spaces are spectra bands where PU signals have insignificant power and can be referred to as background noise. Describing the distributions of white/grey/black spaces across frequency, time, and space domains are of great importance for assessing the interference faced by CR receivers. To date, such a description has mainly been shown empirically by an amount of measurement campaigns [1-6], which show that the radio spectrum consists of a high percentage of white space. A theoretical model was recently
proposed in [12] to describe the spatial distributions of white/grey/black spaces in the presence of a random primary network with homogeneous nodes. There, it was assumed that every active primary transmitter uniquely defines a black space area and a grey space area. There is a widespread perception that black spaces are not exploitable by CR networks due to the presence of strong interfering primary signals.
3. MEASUREMENT METHODOLOGY
Method use for spectrum occupancy measurement and analysis is crucial in the analysis of the measured data. Various methods have been discussed in [12] for conducting occupancy measurements in spectrum sensing. A 24 hour period was used each for the two locations considered in Universiti Teknologi Malaysia Johor campus. These sites have heavy wireless traffics. The locations are the University PSZ library with peak traffic periods during the morning and afternoon hours and the KDOJ hostel with afternoon and night peak periods.
3.1.Measurement setup
The Tektronix RSA306B [7] SA was used for the spectrum occupancy measurement. The features and configuration of the RSA306B SA are shown in Table 1. The SA offers outstanding features with ±3 ppm frequency accuracy and a dynamic range of 180 dBm. The spectrum and spectrogram display were used to view the received signal power on the scanned frequency and spectral display at each sweep time, respectively. A shared data for the spectrogram and spectral display is saved on the Panasonic Fz-G1 Toughpad for offline processing. The complete setup of Figure 1 is used in the two locations over the entire spectrum of 9 kHz to 6.2 GHz using 64001 trace points.
Table 1.Features and Configuration of RSA306B Spectrum Analyzer [2]
Parameter Value
RF frequency range 9 kHz to 6.2 GHz
Measurement range +20 dBm to -160 dBm
Frequency accuracy ±3 ppm
Bandwidth (RBW/VBW) Automatically selected by SA
Sweep time Automatically selected by SA
Sweep type Continuous
Reference power -50 dBm
Number of points 64001
Figure 1.RSA306B spectrum analyzer with other accessories
4. DATA PROCESSING AND RESULTS ANALYSIS
The 64001 trace points selected from the SA allow for power measurement at approximately every 97 kHz interval of the 9 kHz to 6.2 GHz spectra span. The higher the trace point, the better the resolution when determining the duty cycle in a bandwidth range. Since it is expected that noise floor will differ across the spectrum span, average noise levels were taken for the ranges in question. These noise levels are then used with the energy detection (ED) method [13] to calculate the probability of the presence or absence of signal in a particular band of interest. The ED method compares the signal received in a given frequency band to predefined threshold values [5, 15]. A 10 dB power above the average noise level is recommended in [16] as the decision threshold. Received signal which is below the detection threshold in the frequency band
is said to be idle and can be used in cognitive radio scenario. The ratio of the frequency bins where energy is detected to the total number of bins in the entire bandwidth of interest is the duty cycle which signifies utilized channel. In calculating the duty cycle (in %) in each of the channels, the total number of the occurrence at or above the decision threshold is divided by the total number of the number time slots. This is shown in Equation (1). *100% Tslot Tslot DD Duty Cycle N (1)
where DDTslot is the number of time slots where received signal power is equal to or greater than the decision threshold and, NTslot is the entire time slot.
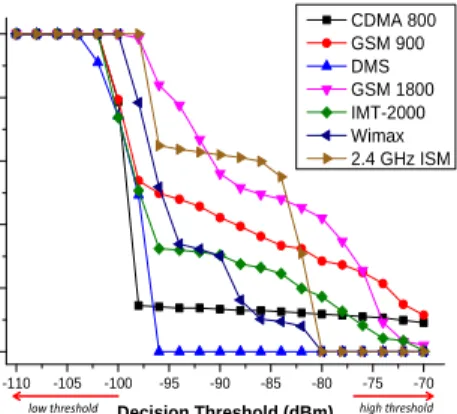
Decision threshold is the main focal point in determining the true spectrum occupancy in the frequency band of interest. This is because high and low thresholds result in underestimation and overestimation respectively, of the channel availability. While too high thresholds miss occupied bands with a low energy level, extremely low thresholds are affected by noise resulting to false unavailability of the frequency channel. These are shown in Figures 2 and 3 for the two locations on UTM Johor campus. In Figure 2, average duty cycle (ADC) of 100% and 0% is recorded for low decision thresholds (-104 dBm to -110 dBm) and high decision thresholds (-86 dBm to -70 dBm), respectively in all the channels. Except the Wimax and digital multimedia service (DMS) which has a sharp transition in the ADC, the rest of the bands have a gradual increase in ADC from high to low decision thresholds. GSM 900 and GSM 1800 have the slowest transition in ADC from high to low threshold values in Figure 3 when compared to other channels. This variation in the two Figures could be attributed to different peak period in the two locations.
Figure 2. Average duty cycle as a function of the decision threshold for different systems in UTM PSZ Library: CDMA 800 (830-880 MHz), GSM 900 (880-960 MHz), DMS (1452-1492 MHz), GSM 1800
(1710-1880 MHz), IMT-2000 (1915-2200 MHz), Wimax (2300-2390 MHz) and ISM band (2450-2483.5 MHz)
Figure 3. Average duty cycle as a function of the decision threshold for different systems in UTM KDOJ Hostel: CDMA 800 (830-880 MHz), GSM 900 (880-960 MHz), DMS (1452-1492 MHz), GSM
1800 (1710-1880 MHz), IMT-2000 (1915-2200 MHz), Wimax (2300-2390 MHz) and ISM band
(2450-2483.5 MHz)
Manual selection of decision threshold by visualizing and selecting a mid-point between the signal and noise level was used in [16]. These methods have a setback of real-time deployment [14]. Since the energy detection method depends on the number of samples (that is, trace points) and decision threshold, 64001 trace points were used for the whole spectra span. The fourth column in Table 2 shows the trace point for each of the channel bandwidth.
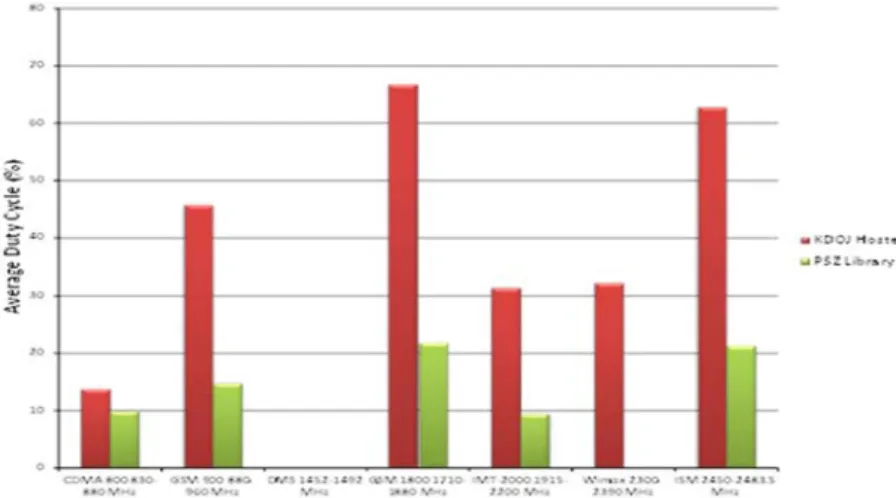
The ADC for the two locations using the ED method is also illustrated in Figure 4 using different threshold values. The ADC chart form of the two sites in Table 2 is shown in Figure 4. In all the frequency bands considered, the PSZ library has less spectrum occupancy when compared to the KDOJ Hostel location. This could be attributed to most handheld devices being turned off. Except for the DMS band and Wimax in the PSZ library which has zero utilized spectrums, other bands in the locations have utilized spectrums. The
-110 -105 -100 -95 -90 -85 -80 -75 -70 0 20 40 60 80 100 A verag e D u ty C ycl e (% ) Decision Threshold (dBm) CDMA 800 GSM 900 DMS GSM 1800 IMT-2000 Wimax 2.4 GHz ISM
low threshold high threshold
-110 -105 -100 -95 -90 -85 -80 -75 -70 0 20 40 60 80 100 A ver age D u ty C ycl e ( % ) Decision Threshold (dBm) CDMA 800 GSM 900 DMS GSM 1800 IMT-2000 Wimax 2.4 GHz ISM
three highest spectrum occupancy observed are in the GSM 1800, ISM 2.4 GHz and GSM 900 in that order for the KDOJ Hostel. A similar trend is observed in the PSZ library location. It can be said that a non-uniform spectrum utilization is obtained from the measurement results.
Table 2.Average duty cycle for different bands
Services Frequency range (MHz) Bandwidth (MHz)
No. of trace points in bandwidth
Average duty cycle (%) Location
PSZ Library KDOJ Hostel
CDMA 800 830 – 880 50 517 9.86 13.73 GSM 900 880 – 960 80 827 14.75 45.71 L-Band Digital Multimedia Service (DMS) 1452 – 1492 40 414 0 0 GSM 1800 1710 - 1880 170 1756 21.81 66.74 IMT-2000 1915 – 2200 285 2943 9.41 31.36 Wimax 2300 – 2390 90 930 0 32.26 ISM band 2.4 2450 – 2483.5 33.5 399 21.30 62.82
Figure 4. Average Spectrum Occupancy by Frequency Bands
The PSD which is averaged for the 24 hours measurement period is shown in Figure 5. The frequency occupancy in these figures can easily be correlated with the ADC in Figure 4 for the selected bands of interest.
Figure 5. 24 hours averaged power spectral density (PSD) for frequency range 830 MHz to 2.4835 MHz: (a) PSZ library (b) KDOJ Hostel
5. CONCLUSION
Even though several spectrum measurement campaigns have been completed in the context of cognitive radio, there is a deficiency of mutual and appropriate evaluation methodology. These measurements are useful in investigating issues of spectrum sensing for DSU, including PU signal detection, adjacent channel interference, receiver sensitivity, and policy performance with local and cooperative sensing. This work has presented an ample and in-depth discussion of several important aspects that need to be carefully taken into account when assessing spectrum occupancy so as to avoid inaccurate results and properly characterize the activity of PU networks. Many issues are yet to be investigated, these includes the spatial correlation among sensing devices at diverse distances and how to choose a suitable threshold that differentiates low-power activities from noise.
REFERENCES
[1] F. H. Sanders, "Broadband spectrum surveys in Denver, CO, San Diego, CA, and Los Angeles, CA: Methodology, analysis, and comparative results," in Proc. IEEE International Symposium on Electromagnetic Compatibility (EMC 1998), vol. 2, Aug. 1998, pp. 988-993.
[2] M. A. McHenry et al., "Spectrum occupancy measurements," Shared Spectrum Company, Tech. Rep., Jan 2004 - Aug 2005, available at: http://www.sharedspectrum.com/measurements.
[3] A. Petrin and P. G. Steffes, "Analysis and comparison of spectrum measurements performed in urban and rural areas to determine the total amount of spectrum usage," in Proc. International Symposium on Advanced Radio Technologies (ISART 2005),Mar. 2005, pp. 9-12.
[4] R. I. C. Chiang, G. B. Rowe, and K. W. Sowerby, "A quantitative analysis of spectral occupancy measurements for cognitive radio," in Proc. IEEE 65th Vehicular Technology Conference (VTC 2007 Spring),Apr. 2007, pp. 3016-3020.
[5] P. E. N., B. Adedeji K, K. M. Y., P. J. J., J. B. Din, and S. K. S.Y., "Spectrum Occupancy Measurement: A Case for Cognitive Radio Network in Lagos, Nigeria," ARPN Journal of Engineering and Applied Sciences, vol. 12, pp. 951-955, February 2017.
[6] M. H. Islam et al., "Spectrum survey in Singapore: Occupancy measurements and analyses," in Proc. 3rd International Conference on Cognitive Radio Oriented Wireless Networks and Communications (CrownCom 2008),May 2008, pp. 1-7.
[7] Tektronix. (2016, 5th May). RSA306B USB Real Time Spectrum Analyzer Datasheet. Available: http://www.tek.com/datasheet/rsa306b-usb-real-time-spectrum-analyzer-0
[8] J.Mitola, III, “Cognitive radio,” Licentiate thesis, Royal Institute of Technology, Stockholm, Sweden, 1999 [9] A. Ghasemi and E. S. Sousa, “Capacity of fading channels under spectrum sharing constraints,” in Proc. IEEE
ICC06, Istanbul, Turkey, June 2006, pp. 4373-4378.
[10] T. K. Phan, S. A. Vorobyov, N. D. Sidiropoulos, and C. Tellambura, “Spectrum sharing in wireless networks via QoS-aware secondary multicast beamforming,” IEEE Trans. Sig. Process., vol. 57, no. 6, pp. 2323–2335, June 2009.
[11] X. Hong, C.-X. Wang, H.-H. Chen, and Y. Zhang, “Secondary spectrum access networks: recent development on the spatial models,” IEEE Veh. Technol. Mag., vol. 4, no. 2, pp. 36–43, June 2009.
[12] R. J. Matheson, "Strategies for Spectrum usage Measurements," in IEEE International Symposium on Electromagnetic Compatibility, 1988, pp. 235-241.
[13] R. A. Witte, Spectrum and network measurements: Scitech Publ., 2014.
[14] M. López‐Benítez and F. Casadevall, "Methodological Aspects of Spectrum Occupancy Evaluation in the Context of Cognitive Radio," European Transactions on Telecommunications, vol. 21, pp. 680-693, 2010.
[15] R. Bureau, "Spectrum Monitoring," ed: International Telecommunication Union (ITU), 2011.
[16] M. A. McHenry and K. Steadman, "Spectrum Occupancy Measurements," Shared Spectrum Company Report, pp. 1-55, 2005.
![Table 1. Features and Configuration of RSA306B Spectrum Analyzer [2]](https://thumb-us.123doks.com/thumbv2/123dok_us/8999039.2797705/3.892.267.651.672.919/table-features-configuration-rsa-b-spectrum-analyzer.webp)