Supporting Information
Revealing the Mechanism of Biochar Enhancing Medium Chain Fatty Acids Production from Waste Activated Sludge Alkaline Fermentation Liquor
Shu-Lin Wua,b, Wei Weia,b,*, Qiuxiang Xua,b, Xiaochen Huangc, Jing Suna,b, Xiaohu Daia,b,
Bing-Jie Nia,b,*
a State Key Laboratory of Pollution Control and Resources Reuse, College of
Environmental Science and Engineering, Tongji University, Shanghai 200092, PR China
b Shanghai Institute of Pollution Control and Ecological Security, Shanghai200092, P.R.
China
c School of Environment, Jinan University, Guangzhou 510632, P.R. China
Corresponding Authors
*Prof. Bing-Jie Ni: Phone: +86 21 65986849; e-mail: [email protected] *Dr. Wei Wei: Phone: +86 21 65986849; e-mail: [email protected]
The following are included as supporting information for this paper:
S2 Microscopic Observation
After CE, the mixed sludge samples were collected and diluted 10-fold with ultra-pure water, then the mixture was shaken on a vortex mixer for later microscopic observation. Microscopic observation was performed on an optimal microscope (BA410E, Motic Electric Group, Xiamen, China).
Electrochemical Impedance Spectra Determination
To assess the electrochemical impedance spectra of system, the three-probe electrical conductance measurement was performed. An electrochemical workstation was used to apply a voltage ramp of -0.6-0.6 V across split electrodes in steps of 50 mV.1
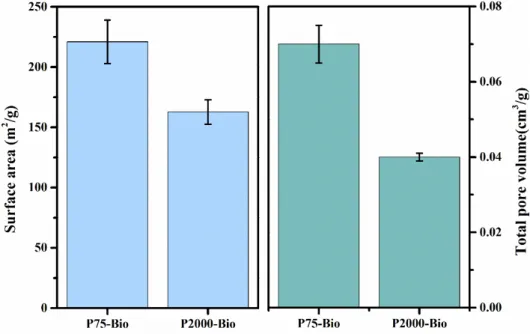
Figure S1. The surface area and total pore volume of biochar. Error bars represent standard errors of triplicate tests.
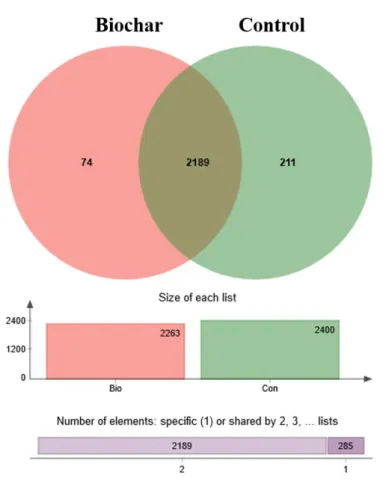
Figure S2. Venn diagram showing the number of shared and unique microorganisms in control and biochar samples (at genus level).
S4
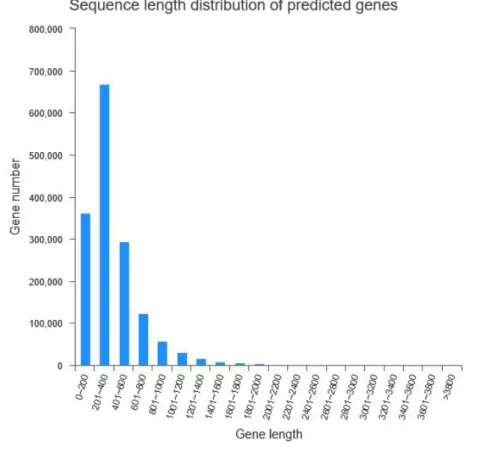
Figure S3. The predicted genes length distribution with nucleic acid lengths greater than or equal to 100bp using MetaGene software.
Figure S4. The X-ray photoelectron microscopy (XPS) analysis of (a) P75-redox biochar and (b) P75-biochar.
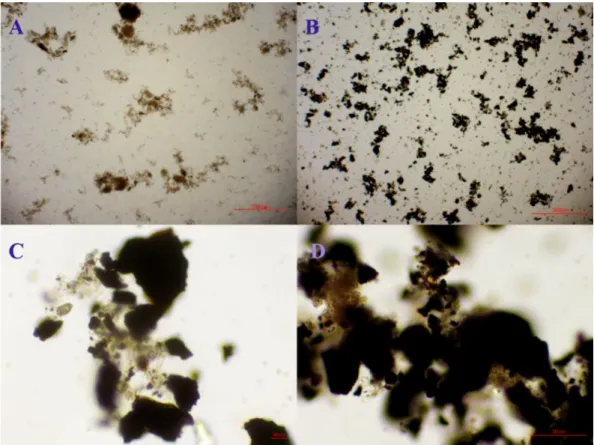
Figure S5. Electron microscopy images of the sludge mixture after CE process in the two experiments: (A) Control; and (B-D) Biochar with 75~150 μm particle size. Different scales are marked in the lower right corner of each image.
S6
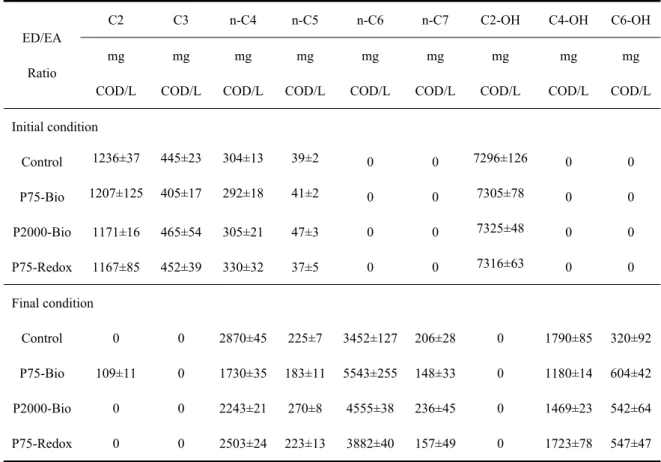
Table S1. The initial and final concentrations of different substances existed in the CE reactors under different biochar conditions.
C2 C3 n-C4 n-C5 n-C6 n-C7 C2-OH C4-OH C6-OH
ED/EA Ratio mg COD/L mg COD/L mg COD/L mg COD/L mg COD/L mg COD/L mg COD/L mg COD/L mg COD/L Initial condition Control 1236±37 445±23 304±13 39±2 0 0 7296±126 0 0 P75-Bio 1207±125 405±17 292±18 41±2 0 0 7305±78 0 0 P2000-Bio 1171±16 465±54 305±21 47±3 0 0 7325±48 0 0 P75-Redox 1167±85 452±39 330±32 37±5 0 0 7316±63 0 0 Final condition Control 0 0 2870±45 225±7 3452±127 206±28 0 1790±85 320±92 P75-Bio 109±11 0 1730±35 183±11 5543±255 148±33 0 1180±14 604±42 P2000-Bio 0 0 2243±21 270±8 4555±38 236±45 0 1469±23 542±64 P75-Redox 0 0 2503±24 223±13 3882±40 157±49 0 1723±78 547±47
Table S2. Sequence statistics after quality control
Sample Clean reads Clean
base(bp)
Percent in raw reads (%)
Percent in raw bases (%)
Control 43735418 6442211616 96.4697 94.1057
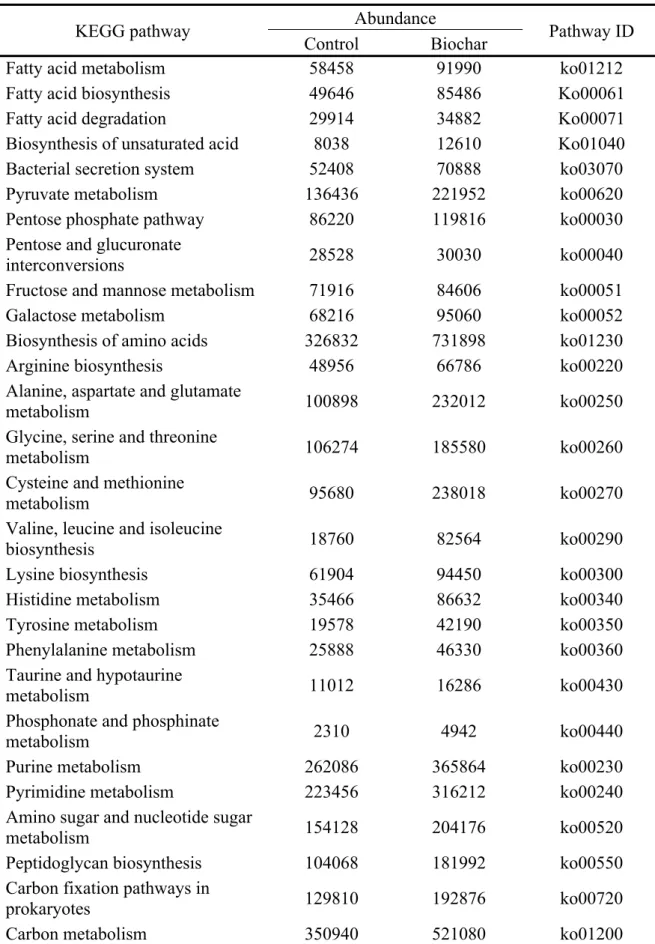
Table S3. Effects of biochar on the differential expression of KEGG pathway Abundance
KEGG pathway
Control Biochar Pathway ID
Fatty acid metabolism 58458 91990 ko01212
Fatty acid biosynthesis 49646 85486 Ko00061
Fatty acid degradation 29914 34882 Ko00071
Biosynthesis of unsaturated acid 8038 12610 Ko01040
Bacterial secretion system 52408 70888 ko03070
Pyruvate metabolism 136436 221952 ko00620
Pentose phosphate pathway 86220 119816 ko00030
Pentose and glucuronate
interconversions 28528 30030 ko00040
Fructose and mannose metabolism 71916 84606 ko00051
Galactose metabolism 68216 95060 ko00052
Biosynthesis of amino acids 326832 731898 ko01230
Arginine biosynthesis 48956 66786 ko00220
Alanine, aspartate and glutamate
metabolism 100898 232012 ko00250
Glycine, serine and threonine
metabolism 106274 185580 ko00260
Cysteine and methionine
metabolism 95680 238018 ko00270
Valine, leucine and isoleucine
biosynthesis 18760 82564 ko00290
Lysine biosynthesis 61904 94450 ko00300
Histidine metabolism 35466 86632 ko00340
Tyrosine metabolism 19578 42190 ko00350
Phenylalanine metabolism 25888 46330 ko00360
Taurine and hypotaurine
metabolism 11012 16286 ko00430
Phosphonate and phosphinate
metabolism 2310 4942 ko00440
Purine metabolism 262086 365864 ko00230
Pyrimidine metabolism 223456 316212 ko00240
Amino sugar and nucleotide sugar
S8
Table S4. Key enzymes involved in the acetyl-CoA production, reverse β oxidization (RBO) pathway and fatty acid biosynthesis (FAB) pathway of MCFAs production in the CE process of WASAFL as revealed by Metagenomic analysis. The abundance of enzyme was calculated based on RPKM (hit reads per kilo-base pair per million reads).
Name KO entry Enzyme number Description
Acetyl-CoA production
adh K00001 1.1.1.1 alcohol dehydrogenase
ALDH K00128 1.2.1.3 aldehyde dehydrogenase
cdhA K00192 1.2.7.4 anaerobic carbon-monoxide
dehydrogenase
cdhD K00194 2.1.1.245 Acetyl-CoA decarbonylase/synthase
RBO pathway
ACCA2 K07508 2.3.1.16 acetyl-CoA C-acyltransferase
HADH K00022 1.1.1.35 3-hydroxyacyl-CoA dehydrogenase
ECHS1 K07511 4.2.1.17 enoyl-CoA hydratase
MECR K07512 1.3.1.38 trans-2-enoyl-CoA reductase
FAB pathway
ACACA K11262 6.4.1.2 acetyl-CoA carboxylase
accC K01961 6.3.4.14 biotin carboxylase carrier protein
fabD K00645 2.3.1.39 [acyl-carrier-protein] S-malonyl
transferase fabF K09458 2.3.1.179 3-oxoacyl-[acyl-carrier-protein] synthase II fabH K00648 2.3.1.180 3-oxoacyl-[acyl-carrier-protein] synthase Ⅲ fabG k00059 1.1.1.100 3-oxoacyl-[acyl-carrier-protein] reductase fabZ k02372 4.2.1.59 3-hydroxyacyl-[acyl-carrier-protein] dehydratase
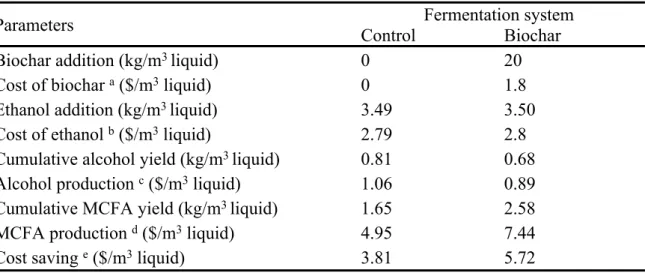
Table S5. Preliminary economic evaluation of WASAFL fermentation technology with and without biochar addition for MCFA production
Fermentation system Parameters
Control Biochar
Biochar addition (kg/m3 liquid) 0 20
Cost of biochar a ($/m3 liquid) 0 1.8
Ethanol addition (kg/m3 liquid) 3.49 3.50
Cost of ethanol b ($/m3 liquid) 2.79 2.8
Cumulative alcohol yield (kg/m3 liquid) 0.81 0.68
Alcohol production c ($/m3 liquid) 1.06 0.89
Cumulative MCFA yield (kg/m3 liquid) 1.65 2.58
MCFA production d ($/m3 liquid) 4.95 7.44
Cost saving e ($/m3 liquid) 3.81 5.72
a the power of tubular finance for biochar pyrolysis was 1200 w. The production cost of
biochar merely ascribed to the machinery and heating, which was estimated to be approximately 4$ per gigajoule.2
b the average price of ethanol (800 $/ton) was taken from http://www.alibab.com.
c, d alcohols, and MCFAs yield were equivalent to butanol (1.07 g COD/g butanol) and
caproate (2.21 g COD/g caproate) content, and the average price of commercial butanol (1300 $/ton) and caproate (3000 $/ton) were taken from http://www.alibab.com.
f Cost savings were roughly estimated as the difference between products (alcohols,
S10 REFERENCE
(1) Di, G.; Zhu, Z.; Dai, Q.; Zhang, H.; Shen, X.; Qiu, Y.; Huang, Y.; Yu, J.; Yin, D.; Küppers, S., Wavelength-dependent effects of carbon quantum dots on the photocatalytic
activity of g-C3N4 enabled by LEDs. Chemical Engineering Journal 2020,379, 122296.
(2) Ni, B. J.; Huang, Q. S.; Wang, C.; Ni, T. Y.; Sun, J.; Wei, W., Competitive adsorption of heavy metals in aqueous solution onto biochar derived from anaerobically digested