E
ffi
cient Heating at the Third-Harmonic Electron Cyclotron
Resonance in the Large Helical Device
Takashi SHIMOZUMA, Shin KUBO, Hiroe IGAMI, Yasuo YOSHIMURA, Takashi NOTAKE
1),
Nikolai B. MARUSHCHENKO
2), Yurij TURKIN
2), Takashi MUTOH
and the LHD Experimental Group
National Institute for Fusion Science, 322-6 Oroshi-cho, Toki 509-5292, Japan
1)University of Fukui, Research Center for Development of Far-Infrared Region, 3-9-1 Bunkyo, Fukui 910-8507, Japan 2)Max-Plank-Institut f¨ur Plasmaphysik, EURATOM-Association, Wendelsteinstr. 1, D-17491 Greifswald, Germany
(Received 16 November 2007/Accepted 4 March 2008)
Efficient heating at the third-harmonic electron cyclotron resonance was attained by injection of millimeter-wave power with 84 GHz frequency range at the magnetic field strength of 1 T in LHD. The electron temperature at the plasma center clearly increased, and the increment in the temperature reached 0.2-0.3 keV. The dependence of the power absorption rate on the antenna focal position was investigated experimentally, showing that the optimum position was located in the slightly high-field side of the resonance layer. Ray-tracing calculation was performed in the realistic three-dimensional magnetic configuration, and its results are compared with the experimental results.
c
2008 The Japan Society of Plasma Science and Nuclear Fusion Research
Keywords: electron cyclotron resonance heating, gyrotron, harmonic resonance, quasi optical antenna, ray trac-ing
DOI: 10.1585/pfr.3.S1080
1. Introduction
High-harmonic heating of the electron cyclotron res-onance (ECR) is an attractive method to extend the heat-ing regime of plasma parameters by alleviatheat-ing the den-sity limitation due to some cutoffs of EC wave propaga-tion. In the LHD launching geometry, the magnetic field strength is almost constant along the ray paths launched from upper- and lower-port antennas, which cross near the magnetic axis. Under this condition, the ray can remain resonant with electrons over a considerable length. There-fore, good absorption is expected over a wide density range even for the third-harmonic resonance heating by the linear theory [1].
Third harmonic resonance heating was attempted ex-perimentally in Heliotron DR and effective heating was ob-served [2]. In TCV tokamak, third harmonic resonance heating was performed with second-harmonic resonance heating using gyrotrons of two different frequencies such as 82.7 GHz for the second harmonic and 118 GHz for the third harmonic resonance. Hundred percent absorp-tion was attained on the existence of high energy electrons produced by the second-harmonic resonance heating [3,4]. Further, a sophisticated feedback control of antenna focal position realized 100 % absorption by only third-harmonic resonance heating [5]. In W7-X, third-harmonic heating is planned as a candidate of a normal heating scenario in the high density regime (0.6-2.0×10²⁰m−3) using a 140 GHz, author’s e-mail: [email protected]
10 MW ECH system [6].
Effective third-harmonic resonance heating has al-ready been achieved in the 2 T LHD plasma by injection of 168 GHz millimeter-wave power from upper-port anten-nas. In the experiments of third-harmonic resonance heat-ing, obvious heating of the bulk plasma (ΔTe =0.2 keV)
around the plasma center by 340 kW power injection was observed [7].
Because the ECH power in the 84 GHz range has re-cently been upgraded up to 1.3 MW, we attempted third harmonic extraordinary(X)-mode heating by injection of 84 GHz range power at the magnetic field strength of 1 T with a magnetic axis of 3.75 m. When the same fre-quency is used, the cutoffdensity for the third harmonic X-mode heating at 1 T becomes 4/3 times higher than that for second harmonic X-mode heating at 1.5 T. It is about 6×10¹⁹m−3.
2. Experimental Setup and Results
The ECH system consists of 84 GHz range and 168 GHz gyrotrons, high-voltage power supplies, long dis-tance transmission lines, and in-vessel quasi-optical an-tennas. It has been improved step by step. At the last campaign(2006) of LHD experiments, five 84 GHz range and three 168 GHz gyrotrons were operated, and ECH power could be injected from six antennas in the vertically elongated cross-section (upper-port and lower-port anten-nas) and two antennas in the horizontally elongatedcross-c
2008 The Japan Society of Plasma
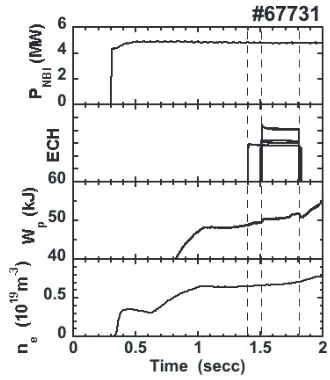
Fig. 1 Wave form of NBI power, ECH timing, stored energyWp, and line-averaged density from top to bottom.
section (outer-port antennas).
Two kinds of antenna systems for ECH are installed in the LHD vacuum vessel. The vertical injection antenna system consists of two or four millimeter-wave focusing and steering mirrors. The high power measurement of this system shows good agreement with the designed beam-waist size of 15 mm in radial and 50 mm in toroidal di-rections for the upper-port antennas and of 30 mm for the lower-port antennas. The direction of the beam can be steered radially and toroidally, respectively. The injected millimeter-wave beams from these antennas consequently have a grazing incidence angle to the cyclotron resonance and continue to interact along a long ray-path. For horizon-tal injection, the antenna system consists of two mirrors, one is fixed and another is steerable. The movable range covers the whole plasma cross-section for perpendicular injection and can be changed over a range of about±30 de-grees toroidally. In this case, the injected beams perpen-dicularly pass through the ECR layer with the shortest gra-dient length. A magnetic configuration was chosen such that the third-harmonic ECR was located near the mag-netic axis for both the vertically and horizontally elongated cross-sections, because the microwave beams from all an-tennas could access almost perpendicular to the magnetic field line of force. Therefore, the magnetic field strength of 1 T on the magnetic axis placed onR = 3.75 m was
adopted without plasmas.
In the experiments, target plasmas were produced and sustained by only NBI power. The electron temperature of a target plasma was about 1 keV and the line-averaged den-sity was 0.6×10¹⁹m−3at the center. ECH power (1.3 MW)
was injected fromt=1.4 sec and 1.5 sec in a stair-like man-ner, as shown in Fig. 1. The ECH pulse, which has a longer pulse width, corresponds to 84 GHz power from the outer-port antenna. The ECH pulse with a shorter pulse width is 82.7 GHz from upper-port antennas and 84 GHz from
Fig. 2 Profiles of electron temperature in (a) and electron den-sity in (b) just before (t=1.37 sec: open symbols) and during (t=1.57 sec: closed symbols) ECH are plotted.ρ is the normalized minor radius.
lower-port antennas. The absorption rate for the diff er-ent types of resonance can be discriminated independer-ently and effectively by the stair-like injection. An obvious in-crease in the stored energy was observed during both the first and second ECH pulses, while there was no change in the density. Figure 2 shows the profiles of electron temper-ature measured by Thomson scattering and electron den-sity measured by a far-infrared laser (FIR) interferometer just before (t =1.37 sec) and during (t =1.57 sec) ECH power injection. The plasma center was heated efficiently, and the increment in the temperature reached 0.2-0.3 keV. The electron density profile was rather hollow both before and during the ECH pulse. Density pump-out is noticed around the center during ECH (t=1.57 sec).
Absorbed power was estimated using the increment in the plasma stored energy dWp/dtbefore and after ECH
on-times, assuming that the other plasma parameters did not change quickly. The dependences on the focal point
Rfoc of the upper-port antennas (82.7 GHz) and on
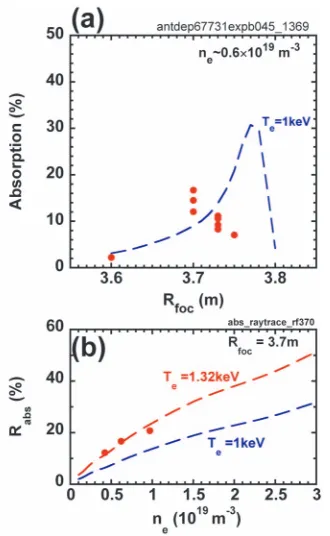
line-averaged density were examined and shown in Fig. 3 (a) and (b), respectively. In Fig. 3 (a), closed circles denote ex-perimentally obtained data for the line-averaged electron density of about 0.6×10¹⁹ m−3. The maximum
absorp-tion rate was obtained on the antenna focal posiabsorp-tionRfoc
Fig. 3 Efficiency of absorbed power for the 82.7 GHz antenna was estimated by change in dWp/dtat ECH on-time. An-tenna focal point on the equatorial planeRfocdependence is shown by closed circles for the density of 0.6×10¹⁹m−3 in (a). Electron density dependence is also shown for
Rfoc =3.7 m in (b). The calculation results obtained by ray-tracing are also plotted by dashed lines with an as-sumed electron temperature.
layer (3.78 m). The absorption rate, however, is rather low, because the temperature and density of the target plasma was fairly low. The density dependence of the absorption rate is plotted forRfoc =3.7 m in Fig. 3 (b). In these
fig-ures, dashed lines represent the results of ray-tracing cal-culations. In the calculations, the dispersion relation of a cold plasma was assumed for ray-trajectory calculations, and the weakly relativistic effect was included for the ab-sorption calculations [8]. The polynomial fitted data of electron temperature and density profiles shown in Fig. 2 were used. There is a great difference between experimen-tal data and ray-tracing calculations in the focal position dependence. The calculation results reflect strong single-pass absorption around ECR corresponding toR3.78 m.
The maximum value reaches about 30%. The gradual de-crease at Rfoc > 3.7 m noticed in the experimental data
cannot be explained by expectations of ray-tracing. On the other hand, the density dependence of the absorption agreed well with the calculation forTe1.3 keV. The
ex-perimental results show efficient heating up toRabs20%
at the third-harmonic resonance even for the fairly low electron temperature (∼ 1 keV) and low electron density (∼1×10¹⁹m−3).
In order to examine the dependence of the single-pass absorption rate on the electron temperatureTeand density
Fig. 4 Single-pass absorption rate for injection from the upper-port antenna is contour-plotted in the electron tempera-ture and density space. The focal point corresponds to
Rfoc=3.7 m. The profiles of the temperature and density are assumed to be those shown in Fig. 2. Contour lines of absorption rate are drawn at intervals of 0.1.
Fig. 5 Single-pass absorption rate for injection from the upper-port antenna is contour-plotted in the electron tempera-ture and density space. The focal point corresponds to
Rfoc=3.75 m. The profiles of the temperature and den-sity are assumed to be those shown in Fig. 2. Contour lines of absorption rate are drawn at intervals of 0.1.
ne, ray-tracing calculation was performed expensively over
two orders of magnitude in theTe−ne space. The
ex-perimentally obtained profiles shown in Fig. 2 were used in the calculations. Because the optical thickness scales asτ ∼ ne·Te2, a little temperature change possibly leads
to fairly large difference in the absorption rate. Figure 4 shows a contour-plot of the single-pass absorption rate in the electron temperature and density space for the injection from the upper-port antenna withRfoc =3.7 m. The
val-ues of temperature,Te, and density,ne, in the figure
rep-resent the values at the center. The figure clearly shows that almost 100 % absorption is expected in the high-temperature (3 keV) high-density (1-4×10¹⁹m−3 )
re-gion up to the right-hand cut-offdensity. However, in the low-temperature (1 keV) low-density (1×10¹⁹m−3)
re-gion, the absorption rate can change from several percent to several tens of percent according to the small change in plasma parameters around the resonance layer.
This mapping of the absorption rate is strongly af-fected by the focal point of the injection beam as expected. Figure 5 shows the sameTe−nemapping of single-pass
ef-ficiency region moves to a lower-temperature area, because the relativistic down-shift of ECR leads to father off-axis heating. This clearly indicates that the temperature at the beam focal point is more important than its profile.
3. Comparative
Study
with
Ray-Tracing Calculations by TRAVIS
code in LHD magnetic
Configura-tion
A more sophisticated ray-tracing code, “TRAVIS” was used to study some effects, such as relativistic and anomalous dispersion effects on ray trajectories and the existence of trapped particles on the absorption rate, for experimentally obtained electron temperature and density profiles in the LHD magnetic field configuration.
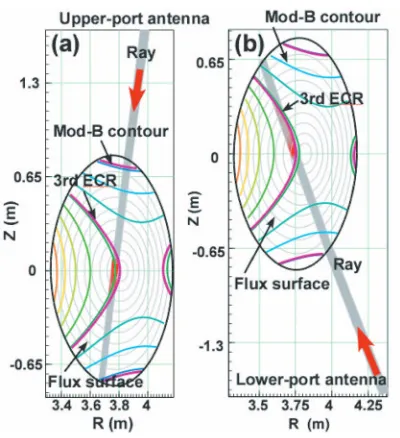
The ray-tracing code, “TRAVIS (IPP)”, has been de-veloped for ECH/ECCD and ECE studies in an arbitrary three-dimensional magnetic configuration [9, 10]. The ba-sic ray-tracing equations include weakly relativistic for-mulation for Hamiltonian, taking into account possible anomalous dispersion effects. The Gaussian power dis-tribution of an injected beam is assumed and the beam cross-section is discretized by the arbitrary number of ra-dial and azimuthal points. Wave absorption can be cal-culated in a fully relativistic formulation. Power deposi-tion is decomposed to passing and trapped electron con-tributions. Extraordinary-mode waves are assumed to be injected from the upper-port antenna with a frequency of 82.7 GHz and the lower-port antenna with 84 GHz focused around the magnetic axis. In these calculations, the exper-imentally obtained electron temperature and density pro-files which are shown in Fig. 2 at 1.37 s, were used. In Fig. 6, the configuration of the calculation is illustrated with mod-Bcontours, flux surfaces with a plasmaβvalue of 0.33 %, and wave rays. The third harmonic ECR is also depicted. Typical calculated ray trajectories from the upper-port antenna in Fig. 6 (a) and lower-port antenna in (b) are shown. No relativistic or anomalous effects were found in the trajectories in such a low temperature low-density plasma, and the trajectories follow almost straight-line paths.
The same focal point dependence of the absorption rate was investigated using the TRAVIS code. The result in Fig. 7 shows that almost equal values and dependence was reproduced with the same plasma parameters, when compared with the dashed line in Fig. 3 (a). This fact also implies that the relativistic and anomalous effects are weak in these parameter regimes.
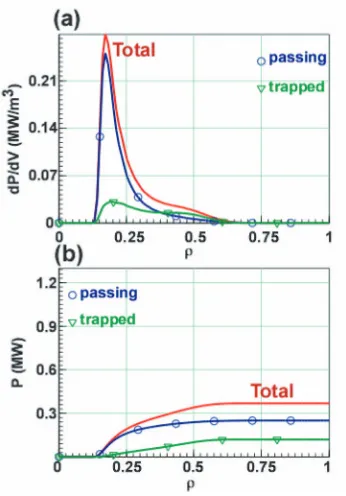
Figure 8 shows the profiles of the absorbed power den-sity in (a) and the integrated absorbed power in (b) for 84 GHz wave injected from the lower-port antenna, which corresponds to Fig. 6 (b). The absorption occurred along the third-harmonic resonance line (B = 1 T) and the de-position spreads over from ρ ∼ 0.1 to 0.6, as shown in
Fig. 6 Ray tracing calculation together with ECR, mod-B con-tours and flux surfaces. (a) Upper-port antenna injection. (b) Lower-port antenna injection. The strongly absorbed regions are indicated by red color around the high-field-side of third-harmonic ECR.
Fig. 7 Focal point dependence of single-pass absorption calcu-lated by TRAVIS for 82.7 GHz waves injected from the upper-port antenna.
Fig. 8 Power deposition. (a) Deposited power density is plotted as a function of normalized minor radius and (b) integral value of absorbed power along the ray path. Total amount is decomposed into each component absorbed by passing and trapped electrons.
the absorption rate evaluated from the temporal change of dWp/dt.
4. Summary
Third harmonic ECR heating experiments were per-formed. In particular, because of the upgrade of 84 GHz gyrotrons and the transmission line, efficient heating re-sults were obtained even for the third-harmonic resonance. During the ECH pulse of 0.4 sec, the stored energy of the plasma increased by several percents. The central elec-tron temperature increased by about 0.2-0.3 keV. The de-pendence of the absorption rate on the antenna focal posi-tion shows the maximum at a slightly higher-field side of the resonance position.
In order to discuss a detailed quantitative compari-son, ray-tracing calculation was performed and compared with experimental data. The calculation was based on the assumption of a cold plasma dispersion relation for trajectory calculation and of the weakly relativistic effect for absorption. The results imply that the absorption rate strongly depends on the values of the electron tempera-ture and density themselves, in the area where the wave is absorbed, and not on the profile in this plasma param-eter region. The experimentally evaluated absorption rate for Rfoc = 3.7 m shows fairly good agreement with the
results of the ray-tracing calculation. Nonetheless, the
cal-culation cannot completely explain the behavior on focal point dependence. Because the errors of the focal position setting of each antenna, which are about 1-3 cm, cannot ex-plain the discrepancy, supra-thermal electrons produced by the third harmonic resonance and their quick escape from plasma core possibly play a role in suppressing the increase in the stored energy.
More sophisticated calculation using ray-tracing code “TRAVIS”, which has been developed in IPP Greifswald (Germany), was successfully performed in the three-dimensional magnetic configuration of LHD. In this code, relativistic and anomalous dispersion effects on ray tra-jectories and the existence of trapped particles on the ab-sorption rate are taken into account. The results of calcu-lation performed in the LHD magnetic configuration and the actual temperature and density profiles show no rel-ativistic and anomalous effects in this plasma parameter regime. The contribution of trapped particles to the absorp-tion reaches about one-third of the total absorpabsorp-tion. This partly explains the smaller efficiency in experimental re-sults compared with the calculated efficiency. The experi-ments discriminating the contribution of trapped particles should be performed by changing the magnetic configura-tion. These issues will be dealt with in future.
Acknowledgment
The authors gratefully acknowledge the LHD techni-cal group for their sophisticated operation of LHD, and the heating and diagnostic devices. They also thank Profes-sors A. Komori, S. Sudo, and O. Motojima for their con-tinuous guidance and encouragement. This work has been supported by NIFS under NIFS06ULRR501,502,503.
[1] U. Gasparino, H. Idei, S. Kuboet al., Nucl. Fusion38, 223 (1998).
[2] N. Yanagi, S. Morimoto, M. Satoet al., Nucl. Fusion31, 261 (1991).
[3] S. Alberti, T.P. Goodman, M.A. Hendersonet al., Nucl. Fu-sion42, 42 (2002).
[4] G. Arnoux et al., Plasma Phys. Control. Fusion 47, 295 (2005).
[5] S. Albertiet al., Nucl. Fusion45, 1224 (2005).
[6] H.P. Laqua, V. Erckmann, R. Brakelet al., 15th International Stellarator Workshop, Madrid,3-7, October 2005, IT-20. [7] T. Shimozuma, H. Idei et al., 27th European Physical
So-ciety Conference on Controlled Fusion and Plasma Physics, Budapest, Hungary, June 12-16, 2000, P4.019.
[8] S. Kubo, T. Shimozumaet al., Plasma Phys. Control. Fusion 47, A81 (2005).
[9] N.B. Marushchenko, V. Erckmann, H. Maaßberg, Yu. Turkin, 34th European Physical Society Conference on Plasma Physics, Warsaw, Poland, July 2-6, 2007, P5.129. [10] N.B. Marushchenkoet al., Plasma Fusion Res.2, S1129