National Conference on Advances in Engineering and Applied Science (NCAEAS) 29th January 2018
Organized by : Anjuman College of Engineering and Technology (ACET) Nagpur, Maharashtra, India, In association with
International Journal of Scientific Research in Science and Technology
Review Paper on Unsupervised Change Detection Algorithm
from VHR Satellite Images using Soft Computing Technique
Asst Prof. Rahil Khan1, Abu Huzaifa2, Ziya Sheikh2, Sugat Deve2, Sameena Afroz2
1Asst Prof.,Electronics and Telecommunication Department,RTMNU/Anjuman College of Engineering,Tech, Nagpur, Maharashtra, India
2Student, Electronics and Telecommunication Department,RTMNU/Anjuman College of Engineering,Tech, Nagpur, Maharashtra, India
ABSTRACT
The change detection algorithms, based on remotely sensed satellite imagery, can be applied to various applications, such as the hazard/disaster analysis and the land monitoring. However, unchanged areas sometimes detected as the changed areas due to various errors in relief displacements and noise pixels, included in the original multi-temporal dataset at the application of unsupervised change detection algorithm To determine the areas that have and don’ t have changes, the image is grouped as two parts by Fuzzy C-Means Clustering method. For achieving these processes, firstly the process of image to image registration is completed. As a result of this, the images are being referred to each other. After that, gray scale difference image obtained is partitioned into 3x3 non overlapping blocks. With the method of principal component analysis, eigenvector space is gained and from here, principal components are reached. Finally, feature vector space consisting principal component is partitioned into two clusters using Fuzzy C-Means Clustering and after that change detection process has been done.
Keywords: Remote sensing, Change detection, Multi-temporal images, K-means clustering, Fuzzy c-means clustering, VHR Image.
I.
INTRODUCTION
In remote sensing, change detection aims to identify changes occurred on the Eart surface by analysing multitemporal images acquired on the same geographical area at different times (Coppin et al. 2004, Lu et al. 2004, Radke et al. 2005, Bruzzone and Bovolo 2013). Over the past few years, many change detection methods have been imposed for various remotely sensed data. Generally, these methods can be grouped into supervised
pixels into changed and unchanged parts using some methods, such as image differencing, image ratio, image regression, and change vector analysis (CVA), etc. (Yetgin 2012, Shi and Hao 2013).Oneof the most widely used change techniques is to analyse the difference image created by subtracting corresponding bands of the multitemporal images pixel by pixel. Some literatures proposed automatic analysis for the difference image instead of an empirical threshold to identify changes (Huang and Wang 1995, Bruzzone and Prieto 2000, Baziet al. 2005, Imet al. 2008).
In this paper, a novel change detection approach is proposed using FCM and K-MEANS to address, for example, the absence of detailed information of traditional K-MEANS and the value overlap of changed and unchanged pixels in the difference image of FMC. As shown in figure 1, the proposed approach is made up of three blocks as follows. First, the difference image is generated using CVA method based on multitemporal remotely sensed images. Then FCM is performed to the difference image, so the initial change map and the cluster membership probability of pixels belonging to changed and unchanged parts are obtained. Finally, the membership probability is introduced into KMEANS using the spatial attraction model to control the boundary pixels in this process and the change map is produced.
II.
METHODS AND MATERIAL
Unsupervised change detection techniques mainly use the automatic analysis of change data which are constructed using multitemporal images. The change data are generally created using one of the following: 1) image differencing; 2) normalized difference vegetation index; 3) change vector
analysis; 4) principal component analysis (PCA); and 5) image rationing
Figure 1
Simple Differencing In this technique, spatially registered images of time I, and 1, are subtracted, pixel by pixel, to produce a further image which represents the change between the two times. Mathematically,
Where =pixel value for band k and i and j are line and pixel numbers in the image, t1, =first date, t2r, =second date and C=a constant to produce positive digital numbers. The input data can be comprised of raw images or spatially filtered ones. Procedure yields a difference distribution for each band.
Image Ratioing
pixel basis. One computes Where , is the pixel value of band k for pixel x at row i and column j at time t2. If the intensity of reflected energy is nearly the same in each image then , this indicates no change.
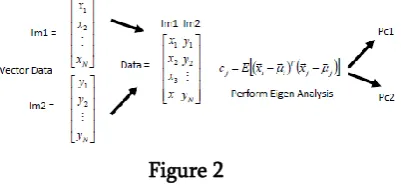
Figure 2
Principal Components Analysis (PCA) Figure.2. PCA algorithm for change detection Principal Component Analysis is a linear transformation technique and probably the most common of these techniques. The main principal of the PCA approach is to use as input a set of images and to reorganize them via a linear transformation, such that the output images are linearly independent. The new coordinate system for the data is projected such that the greatest variance lies on the first axis or the first principal component and the second greatest variance on the second axis. This technique is usually used to reduce the number of spectral bands or in compression schemes. In CD studies, the consequence of this linearization is that unchanged pixels or common information shared by a pair of images are 21 expected to lie in a narrow elongated cluster along a principal axis equivalent to the first component (PC1)
K-means Clustering
The K-means clustering is a simple clustering method which uses iterative technique to partition n observation into k clusters. The partition of n observation into k clusters is based on the nearest mean principle. Even though it is fast and simple in execution, the clustering will not converge if the selection of initial cluster center is not made
properly. Kmeans algorithm is an unsupervised clustering algorithm that classifies the input data points into multiple classes based on their inherent distance from each other. The algorithm assumes that the data features form a vector space and tries to find natural clustering in them. [Dalmiya et.al, 2012]. The basic k- means clustering algorithm is as follows: Step 1: Choose k = # of clusters. Step 2: Pick k data points randomly from the dataset. These data points act as the initial cluster centers Step 3: Assign each data point from the n observation into a cluster with the minimum distance between the data point and cluster centre. Step 4: Re-compute the cluster centre by averaging all of the data points in the cluster. Step 5: Repeat step 3 and step 4 until there is no change in cluster centers Therefore K-means clustering, the key endeavor is to partitions the n observation into k sets (k<n)s={s1,s2,s3,…..sk} so as to minimize the within cluster sum of squares. K arg min ∑ . ∑|| x j − ui ||2 i =1x j ∈si Where ui is the mean of points in Si, K is the number of clusters and xj is the j th data point in the observations [Ramani et.al, 2013][Gumaei et.al,2012].
III.
RESULTS AND DISCUSSION
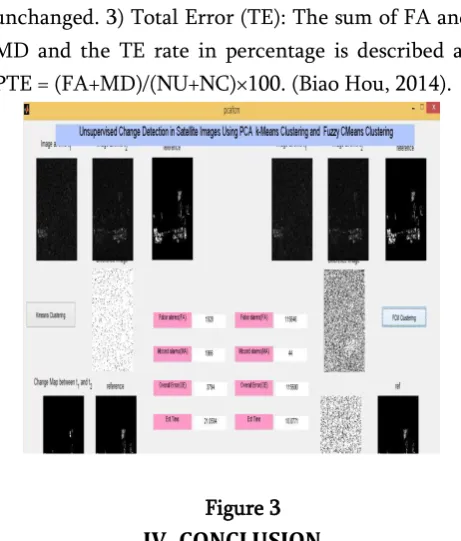
unchanged. 3) Total Error (TE): The sum of FA and MD and the TE rate in percentage is described as PTE = (FA+MD)/(NU+NC)×100. (Biao Hou, 2014).
Figure 3
IV.
CONCLUSION
An unsupervised change detection technique is developed by conducting fcm means clustering on feature vectors which are extracted using h × h local data projection onto eigenvector space. The eigenvector space is generated using PCA on h × h no overlapping difference image blocks. The proposed method uses h × h neighborhood to extract feature vector for each pixel so that it automatically considers the contextual information. The proposed algorithm is simple in computation yet effective in identifying meaningful changes which makes it suitable for real-time applications. It produces results comparable, even better, with the MRF-based approach [5], which requires computationally expensive data modeling and parameter estimation. Simulation results show that the proposed algorithm performs quite well on combating both the zero-mean Gaussian noise and the speckle noise, which is quite attractive for change detection in optical and SAR images
Figure 4.Change detection results obtained by using Kernel K-means clustering
V.
REFERENCES
[1]. R. Collins, A. Lipton, and T. Kanade, “ Introduction to the special section on video surveillance,” IEEE Trans. Pattern Anal. Mach. Intell., vol. 22, no. 8, pp. 745–746, Aug. 2000.
[2]. C. Stauffer and W. E. L. Grimson, “ Learning patterns of activity using real-time `tracking,” IEEE Trans. Pattern Anal. Mach. Intell., vol. 22, no. 8, pp. 747–757, Aug. 22000.
[3]. C. R. Wren, A. Azarbayejani, T. Darrell, and A. Pentland, “ Pfinder: Real-time tracking of the human body,” IEEE Trans. Pattern Anal. Mach. Intell., vol. 19, no. 7, pp. 780–785, Jul. 1997.
[4]. L. Bruzzone and D. F. Prieto, “ An adaptive semiparametric and context-based approach to unsupervised change detection in multitemporal remote-sensing images,” IEEE Trans. Image Processing, vol. 11, no. 4, pp. 452–466, Apr. 2002.
[5]. J. B. Collins and C. E. Woodcock, “ An assessment of several linear change detection techniques for mapping forest mortality using multitemporal Landsat TM data,” Remote Sens. Environ., vol. 56, pp. 66–77, 1996. International Journal of Engineering Science and Computing, May 2017 12358 http://ijesc.org/
structures,” Image Vis. Comput., vol. 18, no. 8, pp. 583–596, May 2000.
[7]. M. Bosc, F. Heitz, J. P. Armspach, I. Namer, D. Gounot, and L.
[8]. M. J. Dumskyj, S. J. Aldington, C. J. Dore, and E. M. Kohner, "The accurate assessment of changes in retinal vessel diameter using multiple frame electrocardiograph synchronised fundus photography," Current Eye Res., vol. 15, no. 6, pp. 652-632, Jun. 1996.
[9]. L. Lemieux, U. Wieshmann, N. Moran, D. Fish, and S. Shorvon, "The detection and significance of subtle changes in mixed-signal brain lesions by serial MRI scan matching and spatial normalization," Med.Image Anal., vol. 2, no. 3, pp. 227-242, 1998. RADKE et al.: IMAGE CHANGE DETECTION ALGORITHMS 305
[10]. D. Rey, G. Subsol, H. Delingette, and N. Ayache, "Automatic detection and segmentation of evolving processes in 3D medical images: Application to multiple sclerosis," Med. Image Anal., vol. 6, no. 2, pp. 163-179, Jun. 2002.
[11]. J.-P. Thirion and G. Calmon, "Deformation analysis to detect and quantify active lesions in three-dimensional medical image sequences," IEEE Trans. Med. Imag., vol. 18, no. 5, pp. 429-441, May 1999.
[12]. E. Landis, E. Nagy, D. Keane, and G. Nagy, "A technique to measure 3D work-of-fracture of concrete in compression," J. Eng. Mech., vol. 126, no. 6, pp. 599-605, Jun.1999.
[13]. G. Nagy, T. Zhang, W. Franklin, E. Landis, E. Nagy, and D. Keane, "Volume and surface area distributions of cracks in concrete," in Proc. Visual Form, 2001, pp. 759-768. K. Lebart, E. Trucco, and D. M. Lane, "Real-time automatic sea-floor change detection from