MICROWAVE BASED
CLASSIFICATION OF MATERIAL
USING NEURAL NETWORK
Anil H. Soni
Department of Electronics
Sipna’s College of Engineering & Technology
Amravati (M.S.), India
Mobile No.9421847455
Ajay A. Gurjar
Department of Electronics
Sipna’s College of Engineering & Technology
Amravati (M.S.), India
Abstract :
Microwave radar has emerged as a useful tool in many remote sensing application including material classification, target detection and shape extraction. In this paper, we present method to classify material based on their dielectric characteristics. Microwave radar in X-band range is used for scanning the target made of various materials like Acrylic, Metal and Wood in free space. Depending on their respective electromagnetic property, reflections from each target are measured and radar image is obtained. Further various features such as Energy, Entropy, Normalized sum of image intensity and standard deviation etc. are extracted and fed to feed-for word multilayer perceptron classifier, which determines whether it is dielectric or non-dielectric (metallic). Results show good performance.
Keywords: Radar, Remote sensing, Radar image, Feed-for word multilayer perceptron 1. Introduction
conduit pipe location, oil and gas explorations. Performance of GPR largely depends on dielectric contrast between object and soil surrounding it [Nuaimy et al,(2000)]. In this paper we present a technique for discrimination of different material having different dielectric constant for a classification as a dielectric or metallic. In particular metal and dielectric are two broad material classes. This technique uses classification based on concept of different amount of reflection from different material having distinct dielectric constant. When microwave reflections over a region of interest are collected a radar image of target can be obtained. This image can be used for classification. This paper is organized as follows Section-2, describes the methodology in which experimental set up, data collection is given. Section-3, describes preprocessing for microwave image formation, section-4, describes feature extraction for classification using feed forward multilayer perceptron. In section-5, results are illustrated, finally concluding remarks are given in section-6.
2. Methodology
The developed technique comprises data collection, preprocessing and filtering, image formation and feature extraction for classification, as shown in Fig.1.
Result
Fig. 1. Block diagram of processing stages.
The experimental set up shown in Fig.2, It uses X- band radar consists of reflex klystron as a microwave source, isolator, crystal detector, circulator and horn antenna. Circulator provides isolation from one port to other and used to route outgoing and incoming signal between antenna, transmitter and receiver. A single horn antenna placed on platform, was used for transmission as well as reception. It can slide both in horizontal and vertical direction.
Target
Fig.2. Block diagram of experimental set up.
2.1 Data collection
In this process reflections from each sheet were observed by scanning each sheet by plane polarized wave incident normally. A region, also called a grid of size one meter by one meter was taken for observation and sheet was placed exactly at centre of scanning area at a range of approximately 30cms. from platform and reflections were observed at space of five cms. along X and Y direction over a length of one meter as shown in Fig.3. [Hantscher et al, (2007)].The dot shows the point where antenna was placed for data collection thus a data vector of size 20*20 was measured for each sheet of material, size of sheet was 30cms.*33cms.taken for observations. The reflections collected by horn can be detected by crystal detector, it’s output is directly proportional to reflected power hence it can be observed on CRO.
Data collection
Preprocessing and Filtering
Neural Network Image formation and
Feature Extraction
Reflection from Sheet
Reflex Klystron Isolator Detector
Detector
∆x= 5cms. ∆y= 5cms.
Fig.3. Grid for scanning
3. Preprocessing and image formation
Before information in raw images can be utilized correctly, it must be processed to remove undesired system and ground effect. To make observations independent of range, observed data has to be calibrated with metal sheet using “Eq.(1)”
E0 = E / E metal (1)
Where, Emetal is reflections of metal sheet of size, one meter*one meter was taken for calibration , E0 is
calibrated data and E is observed data .Calibrated data was processed in MATLAB 7.7, using DIP tools and raw images are obtained as shown in Fig.4.
fig.4. Raw images .
As there is overlapping of antenna swath during scanning so filtering was performed in spatial domain to overcome this effect. Finally thresholding technique was applied to discriminate between object and background [Gonzalez and Woods, (2002)]. Processed images, based on dielectric characteristics of material are obtained as shown in Fig.5.4
4. Feature extraction and classification
Various image based features such as Entropy, Standard deviation, Energy and Normalized sum of image intensity etc. are calculated using “Eq. (2) to (5) “respectively.
. ∑ 2
Where, pq is ratio of window image intensity to total image intensity.
1 , 3
Where, m is mean value of image f(x, y), here N = 400.
, 4
Where, f(x, y) is pixel intensity at position (x, y) in image.
. ∑ ,
∑ ,
5
Where, f (xq,yq) is pixel intensity at position (x,y) in image.
The calculated data is not enough for training and testing purposes so additional data is generated synthetically and some noise is added to it. After normalizing to confine all feature vectors to range [0 to 1] , it is fed to feed – for word multi layer perceptron for training and testing purpose, it was trained with back propagation learning algorithm[Zhou et al, (2005)]. The neural network architecture has three layer. The input layer dimension depends on feature vector dimension. The hidden layer has ten neurons and the output layer contains One neurons to indicate metal as “1” and dielectric as “0”. A log sigmoid activation function was used in hidden and output layer.
5. Results and Discussion
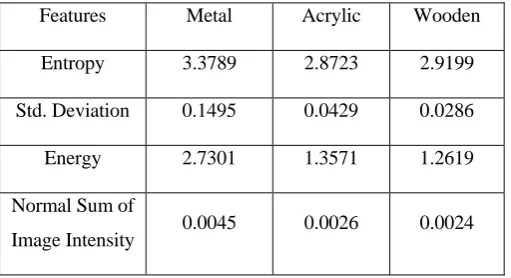
After scanning the sheets of different material in free space with x-band radar, at frequency 8.5 GHZ, radar images of each was obtained as shown in Fig.5. The image based features for each material is calculated and given in Table 1. There is large variation in features of metallic and dielectric material where as variation in acrylic and wood feature is small. It shows that the reflections from metal are more than that of dielectric material and all features are based on electromagnetic property (dielectric characteristics) of material. For classification ten feature samples were generated synthetically from available normalized feature vector for metal and dielectric each. Out of ten, six samples for training and four samples of each were used for testing purpose. Neural network classifier detects target as a metal three times and dielectric two times out of four samples of each material by indicating “1” and “0” respectively.
Table 1. Image based features of target materials.
Features Metal Acrylic Wooden
Entropy 3.3789 2.8723 2.9199
Std. Deviation 0.1495 0.0429 0.0286
Energy 2.7301 1.3571 1.2619
Normal Sum of
6. Conclusion
In this work, classification of material based on their reflective property has been presented. This system allows discriminating different material having different dielectric constant. The experimental results show that implemented system exhibits good performance and success of image- base classification depends on selection of feature. The performance of classifier is its ability to test new or unseen data correctly, as this data is not available, only an estimate may be made of this performance using classification of the data that is available. This method has just trained and tested on small data sets as we have observed data only for G.I. Sheets as metal, however Aluminum and Copper Sheet can be taken for observation and work can be extended for classification using additional features such as electromagnetic and spectral features and combing them to use as input to more efficient classifier such as Support Vector Machine.
References
[1] Gonzalez R.C.; Woods R.E.( 2002 ): Digital Image Processing , Second Edition , Pearson Education Asia , pp.116 - 123, 595-611 [2] Hantscher S. , et al . (2007): Application Of Surface Reconstruction Method For Material Penetrating UWB Radar ,
Proceedings [3] Of IEEE Conference .
[4] Hua C. ; Wolff L. B. (1996) : Polarization Phase - Based Method For Material Classification And Object Recognition In [5] Computer Vision , IEEE Transaction .
[6] Nuaimy W. H. , et al . (2000) : Automatic Detection Of Buried Utilities And Solid Objects With GPR Using Neural Network [7] And Pattern Recognition , Journal of Applied Geophysics, Vol. 43, pp. 157- 165.
[8] Thilak V. , et al. (2007) : Material Classification Using Passive Polarimetric Imagery , IEEE Transaction . [9] Wolff L.B. (1990) : Polarization Based Material Classification For Specular Reflection , IEEE Transaction ,Vol .12 , [10] pp. 1059-1071.
[11] Yarovoy A. (2007) : Ultra- Wideband Radars For High – Resolution Imaging And Target Classification , Proceedings Of The [12] Fourth European Radar Conference .
[13] Zhou H. , et al . (2005) : Feature Extraction And Classification Of Echo Signal Of Ground Penetrating Radar , Wuhan [14] University Journal Of Natural Sciences , Vol.10 , pp. 1009-1012 .
[15] Zurada J. M.( 2006 ) : Introduction to Artificial Neural Systems , Jaico Publishing House , Six Edition , pp. 37-42,163-248.