THE IMPLEMENTATION OF TAGUCHI
METHODOLOGY FOR OPTIMIZATION
OF END MILLING PROCESS
PARAMETER OF MILD STEEL
ANIL CHOUBEY1
1.M.Tech.Student of Mechanical Engineering Deparment, Madhav Institute of Technology & Sciene Gwalior
E-mail: choubey.anil1@gmail
VEDANSH CHATURVEDI2, JYOTI VIMAL3
2,3 Asst.Professor,Mechanical Engineering Department Madhav Institute of Technology & Sciene Gwalior
Abstract
In this paper Taguchi method is applied to find optimum process parameters for end milling while machining of mild steel. A L9 orthogonal array, taguchi method and analysis of variance (ANOVA) are used to formulate the experimental layout, to analyses the effect of each parameter on the machining characteristics and to predict the optimal choice for each end milling parameter such as spindle speed, feed rate, depth of cut and width of cut, and analysed the effect of these parameter on the material removal rate (MRR) and surface roughness (SR). Results obtained by taguchi method match with ANOVA and cutting speed are highly influencing parameter. The analysis of the taguchi method reveals that, in general the spindle speed significantly affects the SR, while, the feed mainly affects the MRR. Experimental results are provided to verify this approach.
Keywords: CNC end milling, surface finish, material removal rate (MRR), Taguchi method, ANOVA, mild steel
1. Introduction
End milling machine highly used in a industry for metal removal operation. Because of end milling having a ability to remove material faster with a reasonably high surface quality. End milling machine highly used in a industry for performing different-different Operation in a manufacturing industries including aerospace and automotive sectors, where quality is an important factor in the Production of high cost product. Productivity can be interpreted in terms of material removal rate in the machining operation and quality can be interpreted in terms of surface finish. Increase in productivity results in decrease in machining time which may results in quality loss. An improvement in quality results in increasing machining time and reduces productivity of machine. Productivity and quality are interdependence each other and it’s very difficult to balance both factors and find optimum results. MRR and SR also depend on the tool material and work material. In end milling, surface finish and material removal rate are two important aspects, which require attention from industry personnel because MRR and SR highly affect machining performances. In today environment industry want to manufacture low cost, high quality product in short time. CNC machine are suitable for flexible manufacturing system. In this paper, taguchi L9 orthogonal array is employed to analyze experimental results of machining
2. Experimental Process
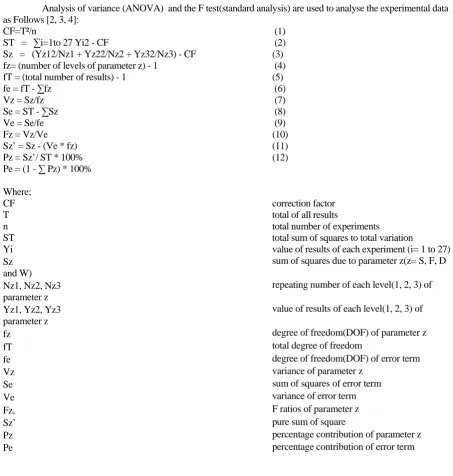
Mild steel was the target material used in this investigation. Table 1 shows the material related properties. Experiments were performed using a CNC vertical milling machine. Figure 1 depicts schematically the experimental set-up. A rectangular mild steel plate of size 100 mm ×76mm ×10mm in shaping machine for performing CNC end milling. Holy oil was used as the coolant fluid in this experiments and servo pat was used as the lubricant fluid in this experiments.
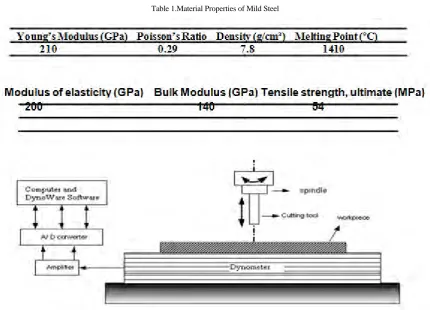
Table 1.Material Properties of Mild Steel
Young’s Modulus (GPa) Poisson’s Ratio Density (g/cm³) Melting Point (ºC) 210 0.29 7.8 1410
Modulus of elasticity (GPa) Bulk Modulus (GPa) Tensile strength, ultimate (MPa)
200 140 54
Table 1.Material Properties of Mild Steel
Figure 1. Schematically the experimental set-up
Table 2: End milling machining condition
Work Condition Description
Workpiece Spindle Speed Feed
Depth of cut Width of cut Coolant Lubricant Tool Servo motor
Mild Steel, Rectangular shape(100x76x10mm) 200 to 2000 rpm
200 t0 2000 mm/min 0.05 to 0.1 mm 0.1 to 0.4 mm Holy oil Servo pat
High speed steel, diameter 6 mm Siemens IFK7042-5AF71-1GG0
CNC vertical milling machine used for experiment Machine Model: MTAB MAX MILL PLUS 3. Design of Experiment and Data Analysis
3.1. Design of Experiment
The experimental layout for the machining parameters using the L9 orthogonal array was used in this study. This
array having a four control parameters and three levels, as shown in table 3. In the taguchi method, most all of the observed values are calculated based on ‘the higher the better’ and ‘the smaller the better’. Thus in this study, the observed values of MRR and SR were set to maximum, intermediate and minimum respectively. Each experimental trial was performed with three simple replications at each set value. Next, the optimisation of the observed values was determined by comparing the standard analysis and analysis of variance (ANOVA) which was based on the taguchi method.
Table 3: Design scheme of experiment of Parameters and levels
Control parameters Level Observed Value
1 2 3
Minimum Intermediate Maximum
Spindle Speed,S(rpm) Feed Rate, F (mm/min.) Depth of cut,D(mm) Width of cut,W(mm)
200 200 .01 .1
1000 1000 .05 .2
2000 2000 .1 .4
3.2. Analysis of Variance (ANOVA)
Analysis of variance (ANOVA) and the F test(standard analysis) are used to analyse the experimental data as Follows [2, 3, 4]:
CF=T²/n (1)
ST = ∑i=1to 27 Yi2 - CF (2)
Sz = (Yz12/Nz1 + Yz22/Nz2 + Yz32/Nz3) - CF (3)
fz= (number of levels of parameter z) - 1 (4)
fT = (total number of results) - 1 (5)
fe = fT - ∑fz (6)
Vz = Sz/fz (7)
Se = ST - ∑Sz (8)
Ve = Se/fe (9)
Fz = Vz/Ve (10)
Sz’ = Sz - (Ve * fz) (11)
Pz = Sz’/ ST * 100% (12)
Pe = (1 - ∑ Pz) * 100%
Where;
CF correction factor
T total of all results
n total number of experiments
ST total sum of squares to total variation
Yi value of results of each experiment (i= 1 to 27)
Sz sum of squares due to parameter z(z= S, F, D
and W)
Nz1, Nz2, Nz3 repeating number of each level(1, 2, 3) of
parameter z
Yz1, Yz2, Yz3 value of results of each level(1, 2, 3) of
parameter z
fz degree of freedom(DOF) of parameter z
fT total degree of freedom
fe degree of freedom(DOF) of error term
Vz variance of parameter z
Se sum of squares of error term
Ve variance of error term
Fz, F ratios of parameter z
Sz’ pure sum of square
Pz percentage contribution of parameter z
Pe percentage contribution of error term
3.3. Data Analysis
In this paper, analysis based on the taguchi method is done by Taguchi DOE software (Qualitek-4) to determine the main effects of the process parameters, to perform the analysis of variance(ANOVA) and to establish the optimum conditions. The main effects analysis is used to study the trend of the effects of each of the factors, as shown in figures 2 and 3. The machining performance (ANOVA-significant factor) for each experiment of the L9 can be calculated by taking the observed values of the MRR as an example from table 4. Table 5 lists the ANOVA and F test results for MRR. Then the contribution of the input parameters, such as Spindle speed, is defined as significant. Thus, the significant parameters can be categorised into two levels which is significant and subsignificant. All of them are based on the fact that the Fz values are much larger than F0.05;n1,n2
Table 4: L9 table and Observed values
Table 5: Analysis of variance and F test for MRR
Parameter (z) DOF (fz) Sum of Square(Sz) Variance (Vz) F-ratio
(Fz) F0.05;n1,n2
Pure Sum (Sz’) Percent(Pz) S F D W e 2 2 2 2 18 0.011 0.018 0.013 0.009 0.004 0.006 0.009 0.006 0.005 0.0002 21.600* 32.400** 21.600* 18.000* 3.55 3.55 3.55 3.55 0.011 0.018 0.012 0.009 0.004 19.756 31.777 21.746 15.855 7.284 ** Significant parameter, * Subsignificant parameter
Table 6: Analysis of variance and F test for SR
** Significant parameter, * Subsignificant parameter
Table 7: Summarization of significant parameter on the machinablity of End Milling
MRR SR
S F D W * ** * * ** * * * No. of Trial
Control Parameter(level) Result/Observed Value Spindle Speed(S) Feed (F) Depth of Cut(D) Width of Cut(W) MRR (g/min.) SR (Ra)
1 2 3 1 2 3
1 2 3 4 5 6 7 8 9 200 200 200 1000 1000 1000 2000 2000 2000 200 1000 2000 200 1000 2000 200 1000 2000 0.01 0.05 0.1 0.05 0.1 0.01 0.1 0.01 0.05 0.1 0.2 0.4 0.4 0.1 0.2 0.2 0.4 0.1 0.98 0.93 0.86 0.89 0.90 0.83 0.85 0.97 0.90 0.96 0.97 0.87 0.90 0.92 0.86 0.83 0.95 0.91 0.96 0.96 0.90 0.91 0.90 0.85 0.83 0.93 0.88 4.22 3.88 3.96 3.85 3.83 3.12 3.00 3.20 3.25 4.02 3.86 3.80 3.85 3.82 3.21 3.12 3.00 3.24 4.02 3.83 3.83 3.83 3.86 3.30 3.23 3.25 3.22 Parameter (z) DOF (fz) Sum of Square(Sz) Variance (Vz) F-ratio
(Fz) F0.05;n1,n2
4. Results and Discussion
The following discussion focuses on the effects of process parameters to the observed values(MRR and SR) based on the Taguchi methodology.
0.88 0.89 0.9 0.91 0.92 0.93 0.94
0 1000 2000 3000
SPEED MR R Series1 0.87 0.88 0.89 0.9 0.91 0.92 0.93 0.94
0 1000 2000 3000
FEED MR R Series1 0.87 0.88 0.89 0.9 0.91 0.92 0.93
0 0.05 0.1 0.15
DEPTH OF CUT
MR R Series1 0.875 0.88 0.885 0.89 0.895 0.9 0.905 0.91 0.915 0.92 0.925 0.93
0 0.2 0.4 0.6
Width of cut
MR
R
Series1
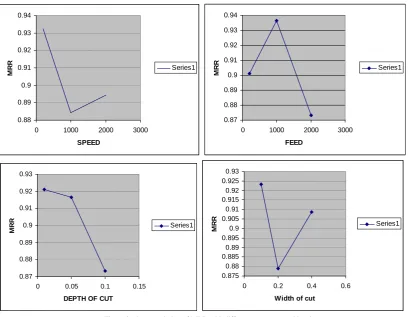
Figure 2: shows variation of MRR with different parameter and level
0 0.5 1 1.5 2 2.5 3 3.5 4 4.5
0 1000 2000 3000
SPEED R e sp o n se o f S R Series1 3.4 3.45 3.5 3.55 3.6 3.65 3.7
0 1000 2000 3000
Feed R e sp o n se o f S R Series1 3.46 3.48 3.5 3.52 3.54 3.56 3.58 3.6 3.62 3.64 3.66
0 0.05 0.1 0.15
Depth of cut
R e sp o n se o f S R Series1 3.35 3.4 3.45 3.5 3.55 3.6 3.65 3.7 3.75
0 0.2 0.4 0.6
Width of cut
R e sp o n se o f S R Series1
4.1 Confirmation Test
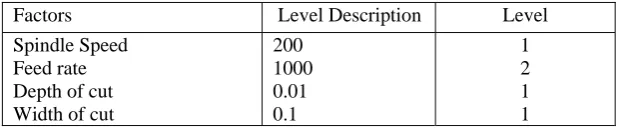
According to optimal parameter setting which we have found from the fig.2 and fig.3 For MRR the optimal parameter setting are S1F2D1W1 and in case of SR optimal parameter setting are S3F3D1W2. According to these Optimal parameter setting, we have conducted the experiment and found MRR as 0.985 g/min. And SR 2.98(Ra) These value shows the successive implementation of taguchi approach and ANOVA analysis for optimization of End milling process parameter.
Table 8: Optimum Machining Condition based on Results of MRR
Table 9: Optimum Machining Condition based on Results of SR
4.2. Material Removal Rate
Figure 2 shows the main effect of MRR of each factor for various level conditions. According to figure 2, the MRR decrease with the Depth of cut and slightly increases with feed.
4.3. Surface Roughness
Figure 3 shows the main effects of SR of each factor for various level conditions. According to this figure the SR slightly increase with depth of cut. In this paper surface roughness largely depends on the Spindle speed. According to this figure the SR decrease with spindle speed.
5. Conclusion
This paper has discussed the feasibility of machining Mild Steel by End Milling with a HSS Tool. Taguchi method has been used to determine the main effects, significant factors and optimum machining condition to the performance of Mild Steel. Based on the results presented herein, we can conclude that, the Spindle Speed of End Milling Tool mainly affects the SR. The Feed Rate largely affects the MRR
References
[1] J.A. McGeough, “Advanced Methods of Machining”, Chapman and Hall, New York, 1998. [2] Ranjit K.Roy, “A Premier On The Taguchi Method”, Van Nostrand Reinhold, New York,1996.
[3] Ranjit K.Roy, ”Design of Experiments Using the Taguchi Approach”, John Wiley & Sons,New York, 2001. [4] Glen Stuart Peace, “Taguchi Methods”, Addison-Wesley Publishing, inc, 1993
[5] Ghani, J.A., Choudhury, I.A., Hasan, H.H. Application of Taguchi Method in Optimization of End Milling Parameters, Journal of Materials Processing Technology (2004) 145: 84–92.
[6] Stroia Mihaela Dorica, RîsniŃă Remus, Optimization of cutting condition on a vertical milling machine Using vibromechanical analysis, International Conference of Mechanical Engineering ICOME 2010 Craiova, pp 919-924.
[7] Kopac J. and Krajnik P., 2007. Robust design of flank milling parameters based on grey-Taguchi method, Journal of Material Processing Technology, Vol. 191, No. 1-3, pp. 400-403.
[8] Ghani J A, Choudhury I A & Hassan H H, Application of Taguchi method in the optimization of end milling parameters, J Mater Process Technol, 145 (2004) 84-92.
Factors Level Description Level
Spindle Speed Feed rate Depth of cut Width of cut
200 1000 0.01 0.1
1 2 1 1
Factors Level Description Level
Spindle Speed Feed rate Depth of cut Width of cut
2000 2000 0.01 0.2