University of Pennsylvania
ScholarlyCommons
Publicly Accessible Penn Dissertations
1-1-2014
The Application and Challenges of
RNA-Sequencing to the Study of Circadian Rhythms
Nicholas LahensUniversity of Pennsylvania, [email protected]
Follow this and additional works at:http://repository.upenn.edu/edissertations
Part of theBioinformatics Commons,Biology Commons, and theMolecular Biology Commons
This paper is posted at ScholarlyCommons.http://repository.upenn.edu/edissertations/1336
For more information, please [email protected]. Recommended Citation
Lahens, Nicholas, "The Application and Challenges of RNA-Sequencing to the Study of Circadian Rhythms" (2014).Publicly Accessible Penn Dissertations. 1336.
The Application and Challenges of RNA-Sequencing to the Study of
Circadian Rhythms
Abstract
The circadian clock drives daily rhythms in behavior and physiology, often in anticipation of the coming dusk or dawn. Almost all organisms possess an internal time-keeper, as it represents an adaptation to one of the most ancient selective pressures; the day-night cycle. Mounting evidence suggests the clock plays important roles in critical metabolic and signalling pathways, the sleep/wake cycle, immune function, as well as learning and memory. Perhaps more importantly, misregulation of the clock is associated with metabolic disorders, neurodegeneration, and incidence of cancer. In an effort to unlock the connections between the circadian clock and these downstream effects, researchers have searched for genes with rhytmic transcription driven by the clock. These so-called clock-controlled genes (CCGs) mediate these observed rhythms in important biological pathways.
Over the past decade, researchers have searched for these CCGs using microarrays. However, with the
growing popularity of high-throughput sequencing, and revelations about both the number and importance of non-coding RNAs (ncRNAs), investigators have begun to use RNA-seq for their circadian profiles. While RNA-seq has led to important findings about the circadian regulation of RNA editing, small RNAs, and epigenetic modifications, there is still much about its biases and limitations that we are still discovering. To this end, this thesis seeks to build upon this foundation and examine the use of RNA-seq for studying
circadian transcription. I applied a hybrid RNA-seq, microarray approach to assay the circading transcriptome in liver, and eleven other mouse tissues. Notably, I saw that 1/3rd of ncRNAs conserved between human and mouse show rhythmic transcription. These rhythmic transcripts are strong candidates for future functional validation, and include important miRNA and snoRNA precursors. Additionaly, I found hundreds novel ncRNAs with rhythmic expression, which may provide novel CCGs. Lastly, I developped and applied a method for identifying the sources of bias in RNA-seq protocols. Taken together, this work extends our understanding of the circadian transcriptome, and the challenges associated with interpreting RNA-seq data.
Degree Type
Dissertation
Degree Name
Doctor of Philosophy (PhD)
Graduate Group
Genomics & Computational Biology
First Advisor
John B. Hogenesch
Keywords
Circadian, Genomics, ncRNA, RNA-seq
Subject Categories
Bioinformatics | Biology | Molecular Biology
THE APPLICATION AND CHALLENGES OF RNA-SEQUENCING TO THE STUDY OF
CIRCADIAN RHYTHMS
Nicholas F. Lahens
A DISSERTATION
in
Genomics and Computational Biology
Presented to the Faculties of the University of Pennsylvania
in
Partial Fulfillment of the Requirements for the
Degree of Doctor of Philosophy
2014
Supervisor of Dissertation
_______________________
John B. Hogenesch, Ph.D., Professor of Pharmacology
Graduate Group Chairperson
__________________________
Li-San Wang, Ph.D., Associate Professor of Pathology and Laboratory Medicine
Dissertation Committee
Russ P. Carstens, M.D., Associate Professor of Medicine
Brian Gregory, Ph.D., Assistant Professor of Biology
Junhyong Kim, Ph.D., Professor of Biology
Michael N. Nitabach, Ph.D., Associate Professor of Cellular and Molecular Physiology and of Genetics,
THE APPLICATION AND CHALLENGES OF RNA-SEQUENCING TO THE STUDY OF
CIRCADIAN RHYTHMS
COPYRIGHT
2014
Nicholas Francis Lahens
This work is licensed under the
Creative Commons Attribution-
NonCommercial-ShareAlike 3.0
License
To view a copy of this license, visit
iii
ABSTRACT
THE APPLICATION AND CHALLENGES OF RNA-SEQUENCING TO THE STUDY
OF CIRCADIAN RHYTHMS
Nicholas F. Lahens
John B. Hogenesch
The circadian clock drives daily rhythms in behavior and physiology, often in
anticipation of the coming dusk or dawn. Almost all organisms possess an internal
time-keeper, as it represents an adaptation to one of the most ancient selective pressures; the
day-night cycle. Mounting evidence suggests the clock plays important roles in critical
metabolic and signalling pathways, the sleep/wake cycle, immune function, as well as
learning and memory. Perhaps more importantly, misregulation of the clock is associated
with metabolic disorders, neurodegeneration, and incidence of cancer. In an effort to
unlock the connections between the circadian clock and these downstream effects,
researchers have searched for genes with rhytmic transcription driven by the clock. These
so-called clock-controlled genes (CCGs) mediate these observed rhythms in important
biological pathways.
Over the past decade, researchers have searched for these CCGs using
microarrays. However, with the growing popularity of high-throughput sequencing, and
revelations about both the number and importance of non-coding RNAs (ncRNAs),
iv
led to important findings about the circadian regulation of RNA editing, small RNAs, and
epigenetic modifications, there is still much about its biases and limitations that we are
still discovering. To this end, this thesis seeks to build upon this foundation and examine
the use of RNA-seq for studying circadian transcription. I applied a hybrid RNA-seq,
microarray approach to assay the circading transcriptome in liver, and eleven other
mouse tissues. Notably, I saw that 1/3rd of ncRNAs conserved between human and
mouse show rhythmic transcription. These rhythmic transcripts are strong candidates for
future functional validation, and include important miRNA and snoRNA precursors.
Additionaly, I found hundreds novel ncRNAs with rhythmic expression, which may
provide novel CCGs. Lastly, I developped and applied a method for identifying the
sources of bias in RNA-seq protocols. Taken together, this work extends our
understanding of the circadian transcriptome, and the challenges associated with
v Table of Contents
Abstract ... iii
List of tables and figures ... viii
Tables ... viii
Figures ... viii
Chapter 1: Introduction ...1
1.1 Background ...1
1.2 Motivation and thesis outline ... 10
Chapter 2: A combined DNA array and RNA sequencing approach to profiling circadian transcription in the mouse liver ... 12
2.1 Abstract ... 12
2.2 Introduction ... 13
2.3 Results ... 15
2.4 Discussion ... 24
2.5 Methods ... 27
2.6 Tables... 32
2.7 Figures ... 33
2.7 Supplemental tables ... 45
2.8 Supplemental figures ... 47
Chapter 3: The circadian non-coding transcriptome across twelve mouse tissues ... 54
vi
3.2 Introduction ... 55
3.3 Results ... 57
3.4 Discussion ... 64
3.5 Methods ... 66
3.6 Figures ... 72
Chapter 4: IVT-seq reveals extreme bias in RNA-sequencing ... 81
4.1 Abstract ... 81
4.2 Introduction ... 83
4.3 Results and discussion ... 86
4.4 Conclusions ... 100
4.5 Methods ... 103
4.6 Tables... 114
4.7 Figures ... 116
4.8 Supplemental tables ... 124
4.9 Supplemental figures ... 125
Chapter 5: Future directions ... 137
5.1 Circadian rhythms and RNA-seq ... 137
5.2 IVT-seq and bias analysis ... 141
Chapter 6: Summary and conclusions ... 143
Appendices ... 149
vii
Appendix B – Novel transcript sequences and qPCR amplicons ... 150
Appendix C – Detailed RNA-seq library construction protocol ... 153
Appendix D – Accession numbers for IVT transcripts ... 159
Appendix E – List of hunc regions ... 164
viii
List of tables and figures
Tables
Table 2.1: Core clock spliceforms expressed in RNA-seq data. ... 32
Table S2.1: RNA-seq alignment statistics. ... 45
Table S2.2: qPCR primer sequences. ... 46
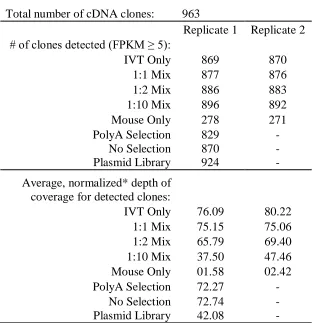
Table 4.1: Detection of source cDNA sequences in IVT-seq. ... 114
Table 4.2: Fold-change differences in within-transcript coverage by library type. ... 115
Table S4.1: Alignment statistics for all sequencing data sets. ... 124
Figures
Fig. 2.1: Comparison between RNA-seq and previous array study. ... 34Fig 2.2: Impact of time-resolution on circadian gene expression profiles... 36
Fig. 2.3: Multiple spliceforms of core clock genes. ... 38
Fig. 2.4: Expression peak in Dbp intron. ... 40
Fig. 2.5: Oscillating miRNA cluster. ... 42
Fig. 2.6: Novel oscillating lincRNAs. ... 44
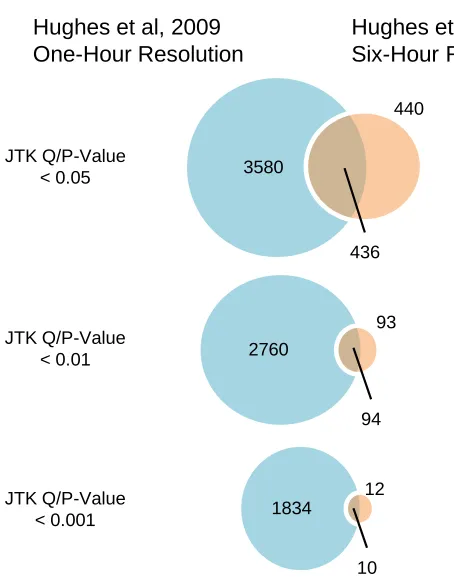
Fig. S2.1: Overlap between array data at 1-hour and 6-hour resolution... 47
Fig. S2.2: ClockΔ19 disrupts oscillations in Clock, Dbp and Tef expression. ... 49
Fig. S2.3: Exon-exon junctions and 5’ RACE suggest expression in Dbp intron corresponds to a TSS. ... 51
Fig. S2.4: ClockΔ19 disrupts oscillations in miRNA cluster. ... 53
ix
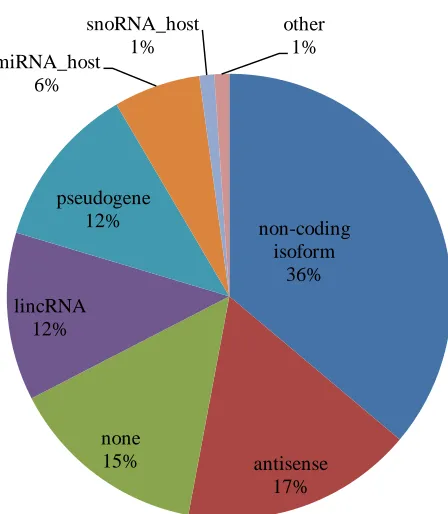
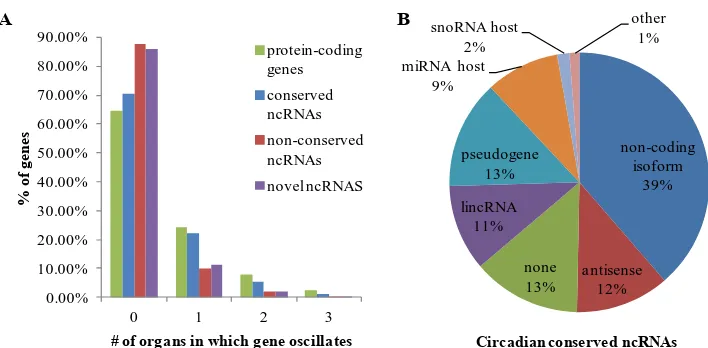
Fig 3.2: Functional groups for conserved ncRNAs ... 73
Fig. 3.3: Characteristics of rhythmic ncRNAs. ... 74
Fig. 3.4: Representative examples of conserved, oscillating ncRNAs. ... 76
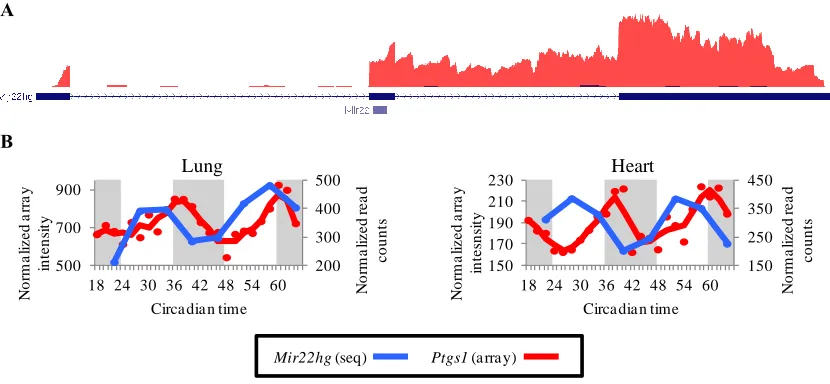
Fig. 3.5: Mir22hg expression is antiphase to its target Ptgs1. ... 77
Fig. 3.6: Antiphase, antisense transcripts of Arntl and Per2... 79
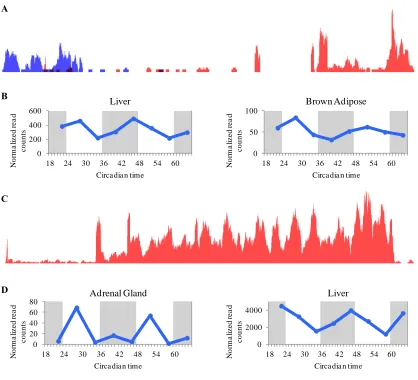
Fig. 3.7: Novel circadian ncRNAs. ... 80
Fig. 4.1: Construction of IVT-seq libraries. ... 117
Fig. 4.2: Within-transcript variations in RNA-seq coverage. ... 119
Fig. 4.3: Between-sample variations in RNA-seq coverage. ... 120
Fig. 4.4: Sources of bias in RNA-seq coverage. ... 122
Fig. 4.5: Effects of sequence characteristics on coverage variability... 123
Fig. S4.1: Expression comparison between replicates. ... 126
Fig. S4.2: Expression comparison between simulated and IVT data. ... 127
Fig. S4.3: Coverage patterns are reproducible across replicates. ... 129
Fig. S4.4: Fold-change in within-transcript coverage across libraries. ... 130
Fig. S4.5: Plasmid sequencing protocol compared to IVT-seq. ... 132
Fig. S4.6: Random hexamer bias across all selection methods. ... 133
Fig. S4.7: Confounding effects between coverage depth and variability. ... 134
Fig. S4.8: Effects of sequence characteristics on coverage depth. ... 135
1
Chapter 1: Introduction
1.1 Background
The circadian clock
The day-night cycle represents one of the most ancient environmental stimuli
under which life has evolved on Earth. As a result, nearly every organism on the planet
maintains an internal time-keeper, known as the circadian clock (in Latin: circa =
around/about, and diem = day). This internal clock oscillates with a period of roughly 24
hours, and allows organisms to anticipate the coming of dawn and dusk. A diverse set of
behaviors, biological processes, and diseases are under circadian regulation and/or
affected by circadian disruption. These include sleep, body temperature, blood pressure,
memory, neurodegeneration, and metabolic disorder, just to name a few [1–8].
The molecular basis for these organism-level rhythms consists of a
transcriptional/translational negative feedback loop. The transcriptional activators
CLOCK/NPAS2 [9, 10] and BMAL1 form a heterodimer that binds E/E’-box DNA
sequence motifs in gene promoters. This heterodimer activates the transcription of the
circadian repressors Per1, Per2, Per3, Cry1, and Cry2. Following their translation, the
PER and CRY proteins form a complex, and translocate back into the nucleus. Once in
the nucleus, they repress their own transcription by inhibiting the activity of CLOCK and
BMAL1. As PER and CRY levels drop due to targeted degradation, CLOCK and
BMAL1 activity is restored, and the cycle begins again. This cycle of activation and
2
circadian time-keeping. A second, stabilizing loop modulates Bmal1 and Cry1
expression. This secondary loop consists of the transcriptional activators Rora, Rorb, and
Rorc, and the transcriptional repressors Rev-erbα and Rev-erbβ [11–14]. For a more
thorough review of the core clock, please consult the following papers [15, 16].
The core oscillator is present and active in most cells throughout the body [17–
19]. However, the central time-keeper, or master oscillator, in the mammalian circadian
system is contained in the suprachiasmatic nucleus (SCN) of the hypothalamus.
Knocking out the molecular clock in the SCN, or damaging/removing the SCN itself
disrupts behavioral rhythms [20, 21]. The SCN is entrained by light input received
directly from the retina through melanopsin-positive ganglion cells [22, 23]. Most other
tissues maintain local or peripheral oscillators. These peripheral oscillators are capable of
sustained rhythms, but all are entrained by the master oscillator present in the SCN. This
cascade of light signaling through the retina, to the SCN, and on to the peripheral
oscillators, keeps the internal clocks throughout an organism running in phase with the
environmental day-night cycle [24–26].
Clock-controlled genes
The core, molecular oscillator is able to drive rhythms in other cellular and
physiological processes by regulating the expression of clock-output or clock-controlled
genes (CCGs). In some cases, this regulation is direct. For instance, Dbp, Tef, and Hlf are
direct targets of CLOCK/BMAL1 binding [27, 28]. Many of these direct targets regulate
3
D-box promoter elements and can drive rhythmic expression in genes downstream of the
core oscillator [30]. It is through this cascade of oscillating expression in direct and
indirect CCGs, that the molecular clock is able to affect a wide array of biological
processes. For example, rate-limiting enzymes in cholesterol biosynthesis (Hmgcr), bile
acid synthesis (Cyp7a1), catecholamine synthesis (Th), and catecholamine degradation
(Maoa), all have expression affected by the clock [31–35].
Finding clock-controlled genes
Given their rhythmic expression, and their role as mediators of the clock’s effect
on downstream biology, the research community has expended significant effort to
identify CCGs across a wide range of tissues and model organisms [34, 36–54]. Since the
turn of the century, the primary workhorse for these studies has been the DNA
microarray. The genome scale data provided by microarrays has allowed researchers in
the clock field to not only identify individual clock genes, but explore clock regulation at
the level of gene networks, and draw comparisons between different organs. These
studies lead to the finding that CCGs in the SCN are enriched in pathways for peptide
synthesis, secretion, and redox state, while those in the liver regulate various metabolic
pathways, and those in the heart are associated with G-protein-coupled receptor signaling
[34, 36]. While a CCG may oscillate in a particular set of tissues, it is still unclear
whether these rhythms are driven by the local organ clock, or the master clock in the
SCN. To address this question, later studies used transgenic mice with disrupted Clock
4
the majority of CCGs appear to be driven by local clocks, there is a small subset that may
receive their cues from the master oscillator. Researchers also noted that by increasing
sampling resolution of their circadian tissue collections (eg. collect RNA every 2 hours,
instead of every 4 hours), they decreased noise in their ability to accurately detect
oscillating genes [39]. Studies that applied this philosophy were able to find greater
numbers of CCGs, as well as genes displaying sub-circadian rhythms (cyclers with
12-hour and 8-12-hour periods) [40]. These recent studies have also brought to light the need to
carefully design experiments to identify CCGs, and to select analysis algorithms that
complement this experimental design [55].
While their use led to these great advances in the circadian field, microarrays are
not without their disadvantages. The first disadvantage is not specific to microarrays, but
arises more from assumptions made when designing these CCG-focused experiments.
Most CCGs are ultimately acting at the protein level. Researchers use RNA expression as
a proxy for the protein quantity. While it would be ideal to look for rhythms in protein
activity at the genome-level, our ability to detect proteins and their activity remains
limited with current technology. At present, nucleic acids are simply a more tractable
molecule to study at scale. Secondly, microarrays are limited by the composition of their
probesets. In other words, an array can only assay transcripts for which it has matching
probes. Manufacturers have sought to mitigate this shortcoming by increasing the number
and diversity of probesets included in successive versions of their arrays. Alternatively,
5
for organisms with larger genomes (like humans and mice). Lastly, microarrays do not
yield nucleotide-level information or splicing information. Some researchers and
manufactures have developed specialized exon and splicing arrays to partially overcome
this deficit. In fact, one study used exon arrays to identify a set of CCGs in the liver with
clock-regulated splicing [41]. Despite these limitations, microarrays still offer an efficient
and effective means to quantify RNA expression.
RNA-sequencing
Over the past six years, high-throughput sequencing of RNA (RNA-seq) has
emerged as a potential successor to microarrays for studying transcriptomics. Though
there are multiple implementations of the RNA-seq paradigm, all involve reading
sequences from a massive number of RNA fragments at the resolution of individual base
pairs. It is this massive number of sequences that differentiate RNA-seq from traditional
Sanger sequencing. In the context of this dissertation, RNA-seq refers specifically
Illumina's implementation, unless otherwise stated. Briefly, RNA-seq begins with the
fragmentation of RNA into short fragments (100 ~ 1000 bp), which are subsequently
converted to cDNA. Since most RNA samples consist of 90-99% ribosomal RNA, these
first steps are commonly preceded by some form of polyA selection or rRNA-depletion.
After cDNA generation, special adapters are ligated to the cDNA fragments. This in turn
is most commonly followed by a PCR step to enrich the quantity of cDNA fragments
with ligated adapters. These adapters will serve as primers during the sequencing
6
place through a bridge PCR reaction. This leaves clusters of cDNA fragments that are all
copies of the original that was bound to the flowcell. The sequencing-by-synthesis
reaction is carried out through the incorporation of special fluorescent nucleotides with
reversible terminators, which prevent the addition of more than one nucleotide at a time.
Next, the flow cell is scanned with a laser to determine which nucleotides were
incorporated (each nucleotide has a different fluorescent color associated with it). Finally,
the 3’ terminator and flurophore are removed and the colonies are ready for the addition
of the next nucleotide. These steps of nucleotide incorporation, base imaging, and
terminator cleavage are repeated to yield short sequence reads ranging from 35-300 bp in
length. For paired-end sequencing, the sequencing reaction is repeated from the opposite
end of the cDNA fragments. This yields two reads with a range (dependent upon the
fragmentation kinetics) of possible distances between them, making them easier to map
to a reference genome. For further details on this procedure, consult the following papers
[56–59].
Analyzing RNA-seq data
After generating these short reads, the next stage in the process is to map them
back to a reference genome. The sequencing machine produces a text file containing a list
of nucleotide sequences. This information is relatively useless unless we can identify
which transcripts these sequence reads originated from. This is the problem solved by the
alignment step. At its core, the alignment step involves sorting through all possible
7
alignment step must perform this task efficiently, as it needs to repeat this millions of
times (once for each read). Early aligners, like Bowtie [60], used a method based upon
the Burrows-Wheeler transform to both rapidly query the reference genome for possible
alignments, and to shrink the reference genome down to a size small enough to fit into
the main memory of most desktop computers. While this made the aligners quick and
memory efficient, these aligners suffered from decreased accuracy [61]. They tended to
have difficulty handling sequencing errors, SNPs, and gapped alignments, which
commonly arise from reads mapping across splice junctions. These problems
compounded as the length of reads has steadily increased from 35 bp. The current
generation of aligners achieve high accuracy and speed by leaving the reference genome
uncompressed [62–64]. This effectively trades off memory efficiency for speed; a human
sized genome requires roughly 30 GB of RAM. However, by storing the entire reference
in an uncompressed state, these aligners can quickly access the reference genome and
find alignments, without suffering from the inaccuracies introduced by a memory
transformation function.
Comparing RNA-seq to microarrays
RNA-seq offers several advantages over microarrays. The most substantial
difference being that seq is not limited to specific probe regions. In theory,
RNA-seq should be able to assay any transcript originating from anywhere in the genome,
regardless of prior knowledge. For quantification, RNA-seq possesses a higher dynamic
8
form of nucleotide-level data. This allows for the detection of RNA-editing, as well as
genetic variants [48, 67]. Also, RNA-seq data can identify the splicing state of transcripts
by searching for reads that span splice junctions (ie. two thirds of the reads map to one
exon, and one third map to another exon) [68–70]. This, in theory, allows RNA-seq data
to differentiate between different transcript isoforms. While RNA-seq offers several
advantages of microarrays, it is not without its shortcomings.
Given the relative youth of RNA-seq, when compared to microarrays, there are
substantial biases and challenges present when handling and analyzing RNA-seq data.
These biases/challenges come in two forms: those introduced by the molecular biology of
library preparation and sequencing, and those introduced during downstream
bioinformatics analyses. The molecular biology involved in library preparation and
sequencing itself can introduce biases that lead to over-/under-representation of particular
transcripts or genomic regions. These can arise from GC-content biases, PCR artifacts,
preferential adapter ligation to particular sequences, random-priming during reverse
transcription, and errors introduced during the actual sequencing reaction [71–75]. Many
of these artifacts are cause by the biases inherent to the enzymes that catalyze the various
steps during library preparation and sequencing. These biases are mostly likely overcome
by making changes to the protocol, like using different enzymes or devising methods for
skipping particularly troublesome steps (like PCR enrichment). Alignment and analysis
of RNA-seq data also presents several challenges. Importantly, RNA-seq data requires
9
than microarrays [76]. Also, while it is theoretically possible to quantify different
transcript isoforms, this is an extremely difficult problem to address given current read
lengths. Current methods for quantifying isoforms produce significant numbers of false
positives in the form of incorrectly assembled transcripts [77]. These biases introduced
by biology and informatics compound to make it extremely difficult to accurately
quantify transcripts and identify differentially expression genes [78]. Microarrays offer a
comparatively simple and accurate analysis pipeline. They are a mature technology and
we have come to understand their associated biases [79, 80]. As a result, bias analysis in
RNA-seq remains a very active area of research.
Clock-controlled genes and RNA-seq
Despite these challenges and its recent adoption, RNA-seq offers great promise in
the search for CCGs. Circadian studies using RNA-seq have found evidence of
oscillations in RNA editing, as well as novel and non-coding transcripts [44, 48]. Other
studies have used specialized RNA-seq protocols to differentiate between accumulated
RNA transcripts, and nascent transcripts in the process of being actively transcribed [49,
50]. These studies found transcripts with rhythmic RNA accumulation, but no rhythms in
transcription, suggesting these transcripts may owe their oscillations to
post-transcriptional processes like RNA degradation. Researchers have also leveraged
ChIP-seq experiments to find loci with coordinated rhythms in clock factor binding, transcripts,
and epigenetic chromatin marks [42–47, 54]. These complementary approaches have
10
confirm oscillation in these metabolic genes, but they found their transcriptional rhythms
appear to be driven by both BMAL1 and REV-ERBα binding. Additionally, these studies
revealed the temporal sequence of chromatin events leading to rhythmic transcription.
Finally, researchers have also begun to search for CCGs among non-coding RNAs
(ncRNAs) [48, 51, 53]. These include snoRNA host genes, miRNAs, and novel
transcripts. Many of these transcripts were missed by previous studies, since they were
not included on any microarrays. While there is little functional information about many
of these non-coding transcripts, there is emerging evidence of their importance for
downstream processes like sleep, and their ability to feedback into the clock [52, 81].
1.2 Motivation and thesis outline
RNA-seq has experienced explosive popularity since its introduction. When this
thesis project began in August of 2009, there were 46 datasets stored in GEO that
featured the keyword “RNA-seq.” As of June 2014, there are 6,286. Researchers across
all fields have sought to leverage this technology, and the circadian field is no exception.
In the search for oscillating transcripts, recent studies have used RNA-seq to add to the
strong foundation already established by microarray data. As I mentioned in the
background, this work has revealed a great deal more complexity in circadian
transcriptional control, especially in the area of ncRNAs. However, many of these studies
focused on single tissues. Furthermore, while RNA-seq has proven extremely powerful, it
11
biases. The work presented in this thesis demonstrates the utility and challenges of using
RNA-sequencing, with a focus on the circadian system and ncRNAs.
Chapter 2 describes a hybrid circadian expression profile which uses both
microarrays and RNA-seq to identify oscillating transcripts. I demonstrate the utility of
this combined approach and examine core clock gene splicing and ncRNAs present in the
mouse liver. In chapter 3 I apply this technique to twelve different mouse tissues in order
to study the circadian non-coding transcriptome. I identify oscillating transcripts
conserved between humans and mice, as well as hundreds of putative lincRNAs and
antisense transcripts. Chapter 4 describes a technique to assess the sources of coverage
bias in sequencing protocols. Using this technique, I identify rRNA-depletion as a
significant source of bias that has been previously unappreciated. In chapter 5, I discuss
the future of this work and additional experiments which will expand upon my existing
findings. Finally, in chapter 6 I conclude this thesis by summarizing my work and
12
Chapter 2: A combined DNA array and RNA sequencing
approach to profiling circadian transcription in the mouse
liver
2.1 Abstract
The circadian clock regulates biological rhythms of ~ 24 hours in most organisms.
The molecular clock is comprised of transcriptional regulators that drive rhythmic
expression of key mediators of physiology and behavior. Here we apply a combined
approach using high resolution temporal profiling by DNA arrays with lower resolution
temporal profiling by RNA sequencing to profile clock regulated gene transcription in
mouse liver. This hybrid approach allows us to leverage array data to identify oscillating
transcripts with a high degree of accuracy, and then explore the structure and splicing
patterns of these transcripts. Analysis of this data demonstrates the importance of
sampling resolution when designing experiments to identify oscillating transcripts.
Furthermore, we show that more than half of core clock factors express alternatively
spliced forms concurrently in mouse liver. Interestingly, we find several forms of
non-coding RNAs, including microRNAs and long non-non-coding RNAs, exhibit high amplitude
circadian rhythms. These results provide a more complete picture of circadian
13
2.2 Introduction
The circadian clock is a cell-autonomous molecular mechanism that drives daily
rhythms in behavior, physiology, and metabolism [3–5]. Dysfunction in the clock has
been linked to a wide array of diseases, including sleep and metabolic disorders [1, 2, 6].
Oscillations of the clock at the molecular level are driven by the interactions of two
transcriptional/translational negative-feedback loops [82]. The main loop consists of the
transcriptional activators Clock, Bmal1, and Npas2 [9, 10, 83]. These transcriptional
activators drive the transcription of, and are subsequently repressed by the repressors
Per1, Per2, Per3, Cry1, and Cry2 [16]. The secondary loop consisting of Nr1d1, Nr1d2,
Rora, Rorb, and Rorc, further modulates the transcription of Bmal1 and Cry1 [11–13].
Rhythmic expression of these core clock genes in turn drives oscillations in the
expression of their target genes, also known as clock controlled genes (CCGs). It is
largely through these CCGs that the circadian clock is able to influence various biological
pathways [27].
Since CCGs mediate the circadian clock’s biological influence, researchers have
spent a great deal of time and effort profiling the expression of oscillating transcripts [36–
38, 84]. Over the past decade, DNA microarrays have been the primary tool used for this
purpose. These arrays have proven extremely useful due to their low cost and
well-established analysis methods [85]. Nevertheless, DNA microarrays can only assay a
finite, defined set of loci and/or transcripts. Given the well-trodden state of this
14
from a new approach and a leap in technology to progress beyond what we can currently
see, particularly to assess the rich diversity of ncRNAs in the transcriptome.
One such alternative is high-throughput sequencing of RNA/cDNA (RNA-seq).
This technology provides several advantages over DNA microarrays, including the ability
to profile virtually any transcribed region of the genome, and analyze alternative splicing
by sequencing exon-exon junctions [57, 65, 68]. Researchers have successfully used
RNA-seq for circadian profiling in several model organisms [44, 48, 53, 86].
Nevertheless, the monetary costs and investment of time required for RNA-Seq
analyses – both for the bench top and computational work – is prohibitively expensive for
many applications [76, 87, 88]. This is particularly relevant to studies of circadian
transcription, which are exquisitely sensitive to sampling resolution and require large
sample sizes [39]. Therefore, we have developed a hybrid approach that combines the
advantages of DNA arrays with the un-paralleled sequence resolution of RNA-Seq.
Using this method, we analyze circadian transcriptional rhythms in the mouse liver and
demonstrate that alternative splicing generates extensive diversity among clock genes.
Additionally, we sequenced liver RNA of ClockΔ19 mutant mice and found that the loss of
the molecular clock did not alter the splicing patterns of core clock genes. Finally, we
identify many ncRNAs that oscillate with high-amplitude in the liver, and appear to be
regulated by the clock. These results reveal a greater degree of diversity in the
mammalian circadian liver transcriptome than previous array-based studies and broaden
15
2.3 Results
Sampling resolution in circadian experiments
We collected liver mRNA every six hours for two days (8 samples total) from
wildtype animals, and every six hours for one day (4 samples total) from ClockΔ19 mutant
animals. This mutation results in the loss of exon 19 from the mature Clock transcript and
produces a dominant-negative form of the CLOCK protein [89, 90]. The mutant CLOCK
interacts with and inhibits the function of BMAL1, thereby eliminating oscillations of the
core molecular clock and leading to behavioral arrhythmicity in constant conditions [38,
89]. We sequenced all of these mRNA samples using the Illumina GA IIx platform,
yielding ~46 gigabases of sequencing data (see section 2.5 Methods). We successfully
mapped 94% - 97% of the raw reads to the mouse genome (Table S2.1) using the
RNA-seq Unified Mapper (RUM) [61]. Additionally, we RNA-sequenced mRNA from the livers of
mice with the ClockΔ19 mutation collected every six hours for one day (4 samples total).
To identify genes with rhythmic transcription, we used quantification values for each
transcript generated by RUM for the wildtype samples and analyzed them with
JTK_CYCLE [91]. This analysis yielded 1166 genes with rhythmic transcription.
We compared these 1166 oscillating genes from our RNA-seq data with a
previous DNA array study which identified over 3000 oscillating genes in mouse liver
[40]. In practice, the RNA-seq data found at most 12% of the oscillating genes identified
by the array study (Fig. 2.1A). Aside from the difference in technology (sequencing vs.
16
(every 6 hours vs. every hour). However, when we looked at Bmal1, Per2, and Dbp, three
clock genes identified as oscillating by both the arrays and RNA-seq, we saw excellent
agreement between the two data sets (Fig. 2.2B). These observations led us to examine
the effects of sampling resolution on our ability to accurately identify oscillating genes.
To simulate different sampling resolutions we took the Hughes et al. data set [40]
(one hour resolution), and sampled different subsets (ie. every other array = two hour
resolution, every third array = three hour resolution, etc.). We then analyzed each of these
smaller data sets using JTK_CYCLE, and compared the results to the one hour data set,
which served as our gold standard. We saw a steep drop-off in our ability to identify
oscillating genes in the gold standard as we increased the time between samplings (Fig.
2.2A; upper panel). Additionally, we saw a reciprocal increase in the number of false
positives (genes incorrectly identified as oscillating when compared to the gold standard)
as we increased the time between samples (Fig. 2.2A; lower panel). For example, the four
hour resolution data correctly identified 26% of the gold standard at the lowest levels of
statistical stringency, with a false positive rate of 24%. The statistical weakness of low
sampling resolutions is particularly apparent when one day of data is analyzed rather than
two (Fig. 2.2B). The four-hour resolution data from a single day correctly identifies 13%
of the gold standard with a false positive rate of 72%. These data indicate that as the
sampling resolution for a circadian time course experiment decreases, the ability to
correctly identify oscillating genes drops drastically. Furthermore, this effect appears to
17
spanning multiple days allow us to see the repeated expression patterns that are the
hallmark of rhythmic genes. Based on these data, we recommend collecting data over two
days at no less than two-hour resolution for the most accurate profile of circadian
transcription.
These simulations with the Hughes et al. data explained the low concordance
between the RNA-seq and array data sets. The six-hour resolution from the array
simulation (same resolution as the RNA-seq experiment) has a 50% false positive rate
and only correctly identifies 11% of the gold standard as oscillating (Fig. 2.2A). This is
extremely close to the RNA-seq data, which has a false positive rate of 58% and correctly
identifies 12% of the gold standard. Furthermore, comparing the overlap between the lists
of cycling genes identified in the six-hour array data set and in the one-hour array data set
is remarkably similar to the previous RNA-seq vs. arrays comparison (Fig. S2.1). These
results suggest that the differences we saw are likely the result of sampling resolution,
rather than a difference in technology.
Transcript diversity of clock genes
Next, to characterize splicing of rhythmically expressed genes we leveraged the
structural data from RNA-seq with the high temporal resolution of the array data set. To
this end we used the Hughes et al. array data, re-analyzed with JTK_CYCLE, as a first
pass to identify oscillating genes. We performed this re-analysis because JTK_CYCLE
has greater sensitivity and specificity than the algorithms originally used to identify
18
patterns of these oscillating genes. Of the 4016 oscillating genes identified by the arrays
(JTK q-value < 0.05), 2530 express more than one spliceform in our wildtype RNA-seq
data (see section 2.5 Methods).
We are particularly interested in alternative splice forms of core clock genes. The
majority of core clock genes (16 of 19) have multiple annotated spliceforms, with over
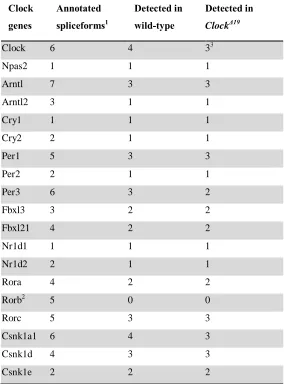
half of those expressing multiple spliceforms in the liver (Table 2.1). Furthermore, our
ClockΔ19 RNA-seq data showed little change in the spliceform usage of core clock genes.
While we detected fewer spliceforms for Per3 and Csnk1a1 in the ClockΔ19 samples than
in the wildtype samples, this is likely due to the loss of amplitude in cycling genes shown
in a previous study [38]. The expression levels of these alternative transcripts may simply
be too low to detect. This evidence for expression comes in the form of RNA-seq reads
which map across exon-exon junctions. By examining which junctions are used, we
determined which transcripts are expressed. We focused subsequent analyses on three
key circadian genes: Clock, Dbp, and Tef. Each of these genes concurrently express both
a principal, well-studied spliceform (Fig. 2.3A; orange gene models), and at least one
minor, but less well-studied spliceform (Fig. 2.3A; purple gene models). In the case of
Clock, we saw the spliceform skipping exon 18 (Fig. 2.3A; top panel), which was
originally identified during the positional cloning of Clock [90]. For Dbp, there was a
spliceform skipping exon 2 (Fig. 2.3A; middle panel). Finally, in the case of Tef, we saw
a spliceform with an extra exon added between the first and second (Fig. 2.3A; bottom
19
phase with each other using spliceform-specific qPCR primers in wildtype samples (Fig.
2.3B). These spliceforms were also expressed in the ClockΔ19 samples, but were
arrhythmic and expressed at extremely low levels (Fig. S2.2). Taken together, these
results not only confirm the concurrent expression of multiple spliceforms in clock genes,
but also suggest that transcription and splicing may co-occur for these genes.
Alternative transcriptional start site in Dbp intron
In addition to alternative splicing, we also saw many genes with expression peaks
located within their introns. We have seen 853 oscillating genes with intronic expression
(RPKM of intron is at least 10% of those for adjacent exons) in the wildtype samples. We
chose to focus on Dbp because of its importance as a well-characterized circadian output
gene in the liver [92]. According to RNA-seq coverage plots, there is an expressed peak
located in Dbp’s first intron (Fig. 2.4A). We did not detect this peak in our RNA-seq data
from the ClockΔ19 samples (Fig. S2.3A), which is likely due to the extreme loss of
amplitude in Dbp expression we observed previously (Fig. S2.2B). This peak oscillates in
phase with the remainder of the transcript, and has amplitude similar to that of the
surrounding exons. This result was confirmed by quantitative PCR, from an independent
tissue collection, using primers specific to the intronic sequence (Fig. 2.4B; lower panel),
and the mature spliced transcript (Fig. 2.4B; upper panel). These results provide strong
evidence that this peak is expressed, and that it oscillates with the remainder of the Dbp
20
There are three likely explanations for this peak in expression: 1) It is a novel
exon spliced into the Dbp transcript. 2) It is a small RNA that is processed from the
spliced intronic sequence, similar to Mir132 and Mir212 [93]. 3) It represents a novel,
alternative transcriptional start site (TSS) for another Dbp spliceform. However, there
was no evidence of splice junctions connecting this peak to any exons in the Dbp
transcript (Fig. S2.3A), which suggests this is not a novel exon. The height of this peak in
the RNA-seq data suggested that this was not simply a retained intron. To determine the
size of the transcript(s) containing this intron, we performed a northern blot with probes
specific to the region of the intronic peak as well as the spliced junction between exons 1
and 2 (Fig. 2.4C). For the splice junction probe, we saw bands at the appropriate lengths
for Dbp pre-mRNA and the mature spliced transcript, as expected (Fig. 2.4C; upper
panel). For the intron probe, we saw the expected pre-mRNAs (Fig. 2.4C; lower panel).
However, rather than seeing a short length band corresponding to a small RNA, we saw a
band of a similar length to the mature spliced Dbp mRNA. Furthermore, since we
performed the northern blot using mouse liver RNA samples from the peak and trough of
Dbp expression (CT34 and CT46 respectively), we saw that all of these bands oscillate
together. Interestingly, a recent study has found evidence of rhythmic CLOCK/BMAL1
binding, and rhythmic changes in histone modifications directly upstream of this intronic
peak in expression [44]. These histone modifications include H3K4me3, a marker for
active promoters [94], as well as H3K9ac and H3K27ac, which are also associated with
21
is located within the first intron of Dbp and is independent of the binding/chromatin
signal present at the annotated TSS. These new data indicate this intronic transcript is not
a small RNA, but rather an alternative TSS. To test this hypothesis, we performed a 5’
RACE experiment and did in fact find evidence of a TSS in Dbp’s first intron
corresponding to the beginning of this peak in intronic expression (Fig. S2.3C). Taken
together, all of these results suggest that an alternative form of Dbp is transcribed from an
alternative TSS located in its first intron. This alternative, un-annotated TSS is similar to
those found for Clock and Timeless in Drosophila [48].
A cycling miRNA cluster
In addition to robust expression within introns, we were also surprised to see
RNA-seq coverage of miRNAs. Given that our RNA isolation and library construction
methods were not optimized for small RNAs, those RNA-seq reads aligning to miRNA
loci (taken from miRbase [97]) are likely from the larger, primary transcripts. We were
very interested to examine miRNAs from a circadian perspective, since previous work
has shown they play an important role in the regulation of the Drosophila clock [52].
None of these loci oscillated in our wildtype samples when analyzed by JTK_CYCLE.
This is likely due to the low sampling resolution of this study, and the fact that the
annotations we used were limited to stem-loop sequences. Through manual curation and
visual inspection of the top hits near the significance threshold for oscillation, we found
several members of a miRNA cluster with a primary transcripts that oscillate (Fig. 2.5A).
22
Mir293, Mir294, and Mir295. Interestingly, the annotated locations of the stem-loop
structures correspond to dips in the RNA-seq coverage plot (Fig. 2.5A). Given the high
degree of RNA secondary structure associated with the stem-loop region, it is possible
that this drop in coverage is due to the inaccessibility of the RNA during library
construction. We tested three regions by qPCR: Mir292, Mir291b, and the putative TSS
for this miRNA cluster (Fig. 2.5B). Each of these regions showed consistent,
low-amplitude oscillations. Additionally, we saw loss of these oscillations in our ClockΔ19
samples (Fig. S2.4), indicating expression at these loci is regulated at least in part by the
molecular clock. These miRNAs have largely been characterized in mouse ES cells [98],
so little is known about their role in liver biology.
Novel circadian lincRNAs
From the wildtype RNA-seq data, we found seven oscillating junctions in
intergenic regions that were not part of any known transcript, raising the possibility that
our data includes novel, clock-regulated transcripts. We chose to focus on two of these
loci, located on chromosomes 6 and 7 (Fig. 2.6). Interestingly, the structure of the
adjacent junctions from the RNA-seq data (Fig. 2.6A and B; middle panels) forms
putative exons from their boundaries (Fig. 2.6A and B; bottom panels). These putative
exons correspond to peaks in the coverage plot (Fig. 2.6A and B; top panels). This is true
even for the chromosome 6 locus, despite the relatively noisy coverage plot. In the case
of the chromosome 7 locus, the putative exons line up almost exactly with peaks in the
23
custom designed qPCR primers (Fig. 2.6C). Interestingly, when we examined these same
transcripts in the ClockΔ19 samples, they continued to oscillate but at a different phase
than in the wildtype livers (Fig. 2.6C). This suggests that the clock influences the
expression of these novel trancripts, but is not the sole driver. Additionally, we used the
PCR primers to clone and sequence their amplicons, and confirm the presence of the
spliced forms of these transcripts (see Appendix B). Our RNA-seq data define the
boundaries and structure of the chromosome 7 transcript most clearly, predicting a
transcript length of 1843 bp. We performed Northern blots using probes specific to the
same spliced regions assayed by the qPCR primers (Fig. 2.6D). These probes hybridized
in bands of the same size predicted by RNA-seq. Having confirmed their expression, we
examined the sequences for these putative transcripts for ORFs and found none, which
indicates these transcripts likely do not have protein-coding potential. Additionally, we
performed a BLASTX search using these transcript sequences to determine if proteins
produced by these transcripts are similar to any known protein. BLASTX yielded no
results, which provides further evidence that these transcripts are non-coding. Taken
together, these data suggest these putative transcripts are long non-coding intergenic
24
2.4 Discussion
This study presents a combined RNA-seq and DNA microarray analysis of
circadian transcriptional rhythms, revealing a high degree of diversity in oscillating
transcripts. This hybrid approach has many significant advantages, notably combining the
ease and affordability of DNA microarrays to conduct high-resolution studies, with the
un-biased resolution of RNA-seq. Our hybrid approach will prove useful for future
studies, since it allows us to leverage the vast amount of pre-existing array data to bolster
the ability of RNA-seq studies to accurately identify oscillating transcripts. In an effort to
make this data available to the community, we have integrated our RNA-seq data into the
web interface we use for circadian microarray profiles
(http://bioinf.itmat.upenn.edu/circa) [99].
We also demonstrated how a circadian profiling experiment’s power to accurately
identify oscillating transcripts is greatly influenced by sampling resolution. To this end,
we recommend collecting a minimum of 24 samples (1-hour resolution for 1-day study,
2-hour resolution for 2-day study, etc.) to accurately identify the majority of oscillating
transcripts, while limiting the number of false positives (Fig. 2.2). Given the substantial
investment of time and resources required to both perform and analyze a circadian profile
by RNA-seq, researchers may be limited to a lower than ideal sampling resolution. The
integration of cheaper or pre-existing microarray data with RNA-seq provides one way of
25
Our RNA-seq data have also shown that most genes with rhythmic transcription
express multiple spliceforms at the same time. This diversity in oscillating transcripts has
not been previously seen by microarrays due to the limitations of the technology. While
there are exceptions [41], the general trend appears to be that alternative transcripts from
the same gene are regulated together and accumulate with the same phase and period.
This trend is in agreement with previous RNA-seq studies performed in Drosophila and
Arabidopsis [48, 100]. One of the best uses for this splicing information in future studies
may be for comparing spliceform usage of rhythmic genes across different tissues.
In addition to alternative splicing, our RNA-seq data have allowed us to identify
oscillating, non-coding RNAs. We used RNA-seq to characterize novel oscillating
transcripts that appear to be non-coding (Fig. 2.6). Our finding that RNA-seq is capable
of identifying novel circadian clock genes is in agreement with previous studies [48, 53].
Furthermore, lncRNAs are an ideal place to look for new clock components, since new
lncRNAs are continually being discovered [101], and there is emerging evidence of their
involvement in cancer and disease [102, 103]. Given the existence of many transcripts
that are not polyadenylated [104], future studies using rRNA depletion, as well as RNA
isolation and library construction techniques optimized for small RNAs may find a
greater number of novel oscillating transcripts and miRNAs in the mammalian system.
Additionally, since novel transcripts and miRNAs are traditionally not detectable by
arrays, it is likely there are more oscillating transcripts of this kind that will require
26
centered around Mir292 (Fig. 2.5) that we did identify as oscillating appears to be
involved in mouse ES cell stress response [105]. Interestingly, Casp2 and Ei24, two of
the validated targets of this miRNA cluster involved in stress response, are themselves
rhythmically transcribed [40]. Previous studies demonstrating that the clock and CCGs
can be regulated by miRNAs [52, 106, 107] emphasize the need to include small RNA
sequencing in future profiling experiments, and we have demonstrated that RNA-seq is
capable of profiling the larger, miRNA primary transcripts. Furthermore, given that our
focus has previously been restricted to protein-coding transcripts, due largely to
technological limitations, it is likely that non-coding RNAs hold great promise for future
27
2.5 Methods
Circadian tissue collection
Mouse liver tissue was collected as previously described [40]. Briefly, WT
6-week old male C57/BL6 mice were acquired from Jackson Labs; ClockΔ19 mice were
prepared as previously described [38]. Mice were entrained to a 12-h:12-h light:dark
schedule for 1 week before being shifted to total darkness. Mice were supplied with food
and water ad libidum. Starting at CT18, 3-5 mice were sacrificed in the darkness every 6
hours for 2 days. Livers samples were quickly dissected and snap-frozen in liquid
nitrogen. Liver samples used for quantitative PCR were collected in the same manner,
except collection began at CT24 and continued every 2 hours for 2 days. All animal
experiments were performed in accordance with the approval of the Institutional Animal
Care and Use Committee.
RNA-seq library preparation
Liver samples were homogenized in Trizol reagent (Invitrogen) using a
Tissuelyser homogenizer (Qiagen). RNA was extracted using RNeasy columns according
to the manufacturer’s protocol (Qiagen). For the full library preparation protocol, please
see Appendix C. Briefly, equal quantities of total RNA were mixed from 3 animals for
each time point. Total RNA was subjected to two rounds of poly(A) selection with
Dynabeads (Invitrogen). The mRNA was fragmented for 5 minutes by metal-ion
hydrolysis (Ambion), and then used as a template for a random-primed cDNA generation.
28
fragments were prepared for sequencing by an end-repair reaction. Blunted fragments
were adenylated to create a single A overhang, and Illumina adapters were ligated to
these sticky ends. Library fragments were size-selected by gel electrophoresis
(350-550bp), and amplified by 13 PCR cycles.
Library sequencing and analysis
RNA-seq libraries were each sequenced in a single lane on the Illumina Genome
Analyzer IIx, using the 100bp paired-end chemistry. Raw reads were aligned to the
mouse genome (mm9/NCBI37) using the RNA-seq Unified Mapper [61]. Transcripts
were quantified by RUM using the UCSC [108], Refseq [109], and Vega [110] gene
annotations. Quantification values were tested for oscillations using the JTK_CYCLE
[91] package in R. miRNAs from the miRbase annotations v18 [97] were also quantified
and tested for oscillations. For all junction analyses, only those junctions identified by
RNA-seq reads mapping at least 8 bp on each side were used. A junction was classified
as novel if it did not appear in any of the following annotations: Vega, UCSC,
Transcriptome, SGP, RefSeq, Other RefSeq, NSCAN, Genscan, GeneId, Esnsembl and
AceView [108–116]. Each of these annotation tracks was downloaded from the UCSC
Genome Browser. Genes with alternative splicing were identified by searching for splice
junctions with identical start coordinates, but different end coordinates (and vice versa).
We have made our raw RNA-seq data and aligned results freely available on GEO
(accession numbers: GSE40190 and GSE41082).
29
The gold standard of oscillating genes was determined by analyzing the Hughes
1-hour data set [40] with the JTK_CYCLE [91] package in R. A 2-hour sampling
resolution was simulated by taking data from every second array from the Hughes data
set, beginning with CT18, and using JTK_CYCLE to identify oscillating genes. A 3-hour
sampling resolution was simulated by taking data from every third array, and so on, up to
a 10-hour sampling resolution. A one-day data set was simulated by repeating the above
process, but only using arrays from the first day of sampling (CT18-CT41). The one-day
simulation used a maximum resolution of 8-hours. For the comparison, a true positive
was defined as a gene identified as oscillating in both the simulated data set and the gold
standard. A false positive was defined as a gene identified as oscillating by the simulated
data set, but not by the gold standard. The one-day simulation with replicates used time
points separated by 24 hours as replicates for each other. For example, CT42 served as a
replicate for CT18.
Quantitative PCR
0.5 µg of total RNA, pooled from 3 liver samples, was used to generate cDNA
with the QuantiTect Reverse Transcription kit according to manufacturer’s protocol
(Qiagen). Quantitative PCR reactions were performed using SYBR Green PCR Master
Mix (Applied Biosystems) in combination with custom primers on 7900 HT Real-Time
PCR System (Applied Biosystems). Rps18 (Mm_Rps18_1_SG) was used as endogenous
control for all qPCR experiments. Information for this primer is available from the
Primer-30
BLAST [117] and ordered from Integrated DNA Technologies. Sequences for primer
pairs are included in Table S2.2. All analysis was performed using RQ Manager v1.2.1
(Applied Biosystems).
5-prime RACE
Total RNA was isolated from mouse livers collected at the peak phase of Dbp
expression (CT34). The RNA was used for 5-prime race using FirstChoice RLM Race
Kit (Applied Biosystems) and Superscript III (Invitrogen) by manufacturer’s protocols.
Race products generated using forward primers included with kit and reverse primers
used for Dbp qPCR primers (see Table S2.2). These products were visualized on a 2%
agarose gel, purified using MinElute Gel Purification columns (Qiagen), and sequenced
to confirm their identities.
Northern blots
Templates for Northern probes were generated from qPCR amplicons. Briefly,
amplicons were run on a 2% agarose gel following qPCR reactions and purified using
MinElute Gel Purification kit (Qiagen) by manufacturer’s protocol. Purified amplicons
were cloned using TOPO TA Cloning Kit (Invitrogen) by manufacturer’s protocol.
Templates verified by sequencing (sequences included in Appendix B). RNA for
Northern blots was isolated from frozen mouse liver samples (collected as described
above) by TRIzol according to manufacturer’s protocol (Invitrogen). For the Dbp
Northern blots, 40 µg of total RNA was subjected to poly(A) purification by Dynabeads
31
NorthernMax Kit according to manufacturer’s protocols (Ambion). Briefly, 700 ng of
poly(A) RNA (Dbp) or 20 µg of total RNA (novel chr7 transcript) were run on a 1.5%
denaturing agarose gel. RNA was transferred to Amersham Hybond-N+ membrane (GE
Life Sciences) by downward transfer using a TurboBlotter (Whatman). RNA was
crosslinked to membrane using a UV Stratalinker 2400 (Stratagene) using the Auto Cross
Link setting. Oligonucleotide probes incorporating P-32 alpha dCTP were synthesized
from the probe template using Prime-It II Random Primer Labeling Kit (Agilent) and
unincorporated nucleotides were removed using Micro Bio-Spin Chromatography
Columns (Biorad), according to manufacturer’s protocols. Probes were hybridized
overnight in an Isotemp Hybridization Incubator (Fisher) at 46ºC. Hybridized probes
were exposed to a Storage Phosphor Screen (GE Life Sciences) overnight and imaged
32
2.6 Tables
Table 2.1: Core clock spliceforms expressed in RNA-seq data.
Clock genes
Annotated
spliceforms1
Detected in wild-type
Detected in ClockΔ19
Clock 6 4 33
Npas2 1 1 1
Arntl 7 3 3
Arntl2 3 1 1
Cry1 1 1 1
Cry2 2 1 1
Per1 5 3 3
Per2 2 1 1
Per3 6 3 2
Fbxl3 3 2 2
Fbxl21 4 2 2
Nr1d1 1 1 1
Nr1d2 2 1 1
Rora 4 2 2
Rorb2 5 0 0
Rorc 5 3 3
Csnk1a1 6 4 3
Csnk1d 4 3 3
Csnk1e 2 2 2
1
derived from visual inspection of UCSC, Refseq, Ensemble, & NSCAN annotations
2
not expressed in RNA-seq data set
3
33
2.7 Figures
Oscillating genes from Hughes et al., 2009.
Oscillating genes from RNA-seq JTK Q/P-Value < 0.05 JTK Q/P-Value < 0.01 JTK Q/P-Value < 0.001 2184 102 150 2783 392 517 1456 16 18 A B G ene E x pres s ion (Inten s ity ) G ene E x pres s ion (RP K M )
Circadian Time (hours)
Dbp 0 30 60 90 120 0 40000 80000 120000 160000
18 26 34 42 50 58
Bmal1 0 4 8 12 16 0 1500 3000 4500 6000
18 26 34 42 50 58
Per2 0 7 14 21 28 0 700 1400 2100 2800
18 26 34 42 50 58
Hughes et al., 2009.
34
Fig. 2.1: Comparison between RNA-seq and previous array study.
(A) RNA-seq data and array data from Hughes et al. 2009, were analyzed with
JTK_CYCLE to identify genes with oscillating transcripts. These gene lists were
compared at different JTK q-value cutoffs of 0.05, 0.01, and 0.001 to determine the
number of overlapping genes. For the RNA-seq data, JTK p-values were used instead of
q-values due to the lower time resolution of the data set. (B) Expression profiles from
Hughes et al. array data (blue) and wildtype RNA-seq data (red) for three genes identified
as oscillating by both datasets: Dbp, Bmal1, and Per2. Grey and black bands identify
times corresponding to subjective day and night, respectively. Array intensity plotted
35 0 20 40 60 80 100
1 2 3 4 5 6 7 8 9 10
% o f Go ld S ta n d a rd
Sampling Resolution (Hr)
True Positives 0 20 40 60 80
1 2 3 4 5 6 7 8 9 10
% Fals e P o s it iv e
Sampling Resolution (Hr)
False Positives A B 0 10 20 30 40
1 2 3 4 5 6 7 8
% o f G o ld St a n d a rd
Sampling Resolution (Hr)
True Positives 0 20 40 60 80
1 2 3 4 5 6 7 8
% Fa ls e Pos it iv e
Sampling Resolution (Hr)
False Positives
2-day Time Course 1-day Time Course
36
Fig 2.2: Impact of time-resolution on circadian gene expression profiles.
Circadian profiling studies of different sampling resolutions were simulated by taking
different subsets of the Hughes et al. 2009 array data set and analyzing them with
JTK_CYCLE. These subsets used data from (A) 2 days of the array data or (B) just the
first day to simulate two day and one day experiments, respectively. The list of genes
with oscillating transcripts from each of these subsets was compared to those identified
by the full 2 day, one-hour resolution data set, which served as a gold standard. The
percentage of genes with oscillating transcripts from a given subset that overlap with
those from the gold standard served as an indicator of the true-positive rate for that subset
(top panels). The percentages of genes that did not overlap with the gold standard served
as the false-positive rate for that subset (bottom panels). These lists of oscillating genes
identified by the subsets were calculated using JTK p-value cutoffs of 0.05, 0.01, and
37 Annotated Gene Models Major spliceform Minor spliceform RNA-seq Junctions Major spliceform Minor spliceform Clock 3 14 18
Ex17 Ex18 Ex19
Dbp
112
121
15
Ex1 Ex2 Ex3
Tef 3 89 4 Ex2 Extra Exon Ex3 A B qPCR Ex pr es s ion (ar bi tr ar y uni ts )
Circadian Time (hours)
0 0.5 1 1.5 2
0 8 16 24 32 40
Clock 0 200 400 600 800 1000
0 8 16 24 32 40
Dbp 0 2 4 6 8 10 12
0 8 16 24 32 40
38 Fig. 2.3: Multiple spliceforms of core clock genes.
(A) Exon junctions mapped by RNA-seq data were used to identify major (blue junctions,
orange gene models) and minor (green junctions, purple gene models) spliceforms for
Clock, Dbp, and Tef. The numbers adjacent to the blue and green junctions are the
number of gapped RNA-seq reads mapping to those junctions from a representative time
point. (B) qPCR with primers specific to major (orange) and minor (purple) spliceforms
shows expression of these spliceforms across two days. Grey and black bands identify
times corresponding to subjective day and night, respectively. Expression of transcripts
39 A CT47 CT53 CT59 CT65 N orm al iz ed R N A -s eq C ov erag e B C Dbp Intron Dbp Exons 1-2 CT34 CT46 2 kb 4.6 kb 2 kb 4.6 kb
Circadian Time (hours)
qP C R E x pres s ion ( arbi tr ary un its ) 0 100 200 300 400
0 8 16 24 32 40
DbpExons 1-2
0 100 200 300 400
0 8 16 24 32 40
DbpIntron
Circadian Expression in DbpIntron
40 Fig. 2.4: Expression peak in Dbp intron.
(A) Wildtype RNA-seq coverage plots from four representative time points (CT47,
CT53, CT59, CT65) are displayed above the Dbp gene model (purple). The gray bar
highlights the region in the first intron showing rhythmic expression. Coverage plots are
normalized by the total number of reads in in each RNA-seq sample. (B) qPCR with
primers specific to the mature splice junction between the first and second exon (top),
and the expressed region of the first intron (bottom) was used to detect expression of
these transcripts in wildtype livers across two days. Grey and black bands identify times
corresponding to subjective day and night, respectively. Expression of these transcripts
was normalized to Rps18. (C) Northern blots with probes specific to the mature splice
junction between the first and second exon (top), and the expressed intronic region
(bottom) were used to determine the size of the transcripts associated with each of these
regions. Poly(A) RNA for the Northern was collected from two independent, wildtype
41 A Cluster TSS Mir292 Mir291b CT47 CT53 CT59 CT65 Nor m al iz ed RNA -s eq Cov erage B
Circadian Time (hours)
qP CR E x pres s ion (arbi tr ary un its ) 0 1 2 3 4
24 32 40 48 56 64
miRNA Cluster TSS
0 0.5 1 1.5 2 2.5 3
0 8 16 24 32 40
Mir291b 0 1 2 3 4 5
0 8 16 24 32 40
42 Fig. 2.5: Oscillating miRNA cluster.
A miRNA cluster containing Mir290, Mir291a, Mir292, Mir291b, Mir293, Mir294, and
Mir295 is located at chr7:3,217,507-3,221,276. (A) Wildtype coverage plots for this
genomic region from four representative time points (CT47, CT53, CT59, CT65) are
displayed. The annotated locations of Mir292 (blue) and Mir291b (red), in addition to the
putative TSS of the cluster (green) are displayed below the coverage plots. All coverage
plots are normalized by the total number of reads in each sample. (B) qPCR with primers
specific to Mir292 (blue), Mir291b (red), and the putative TSS (green) were used to
detect expression in wildtype livers across two days. Grey and black bands identify times
corresponding to subjective day and night, respectively. Expression of these transcripts