IJEDR1704001
International Journal of Engineering Development and Research (
www.ijedr.org
)
1
Modelling and simulation of full vehicle to study its
dynamic behavior
1Prof. Sachin Jadhao, 2Mr. Milind K Patil
1Assistant Professor, 2Student of ME (Design) Mechanical Engineering J.S.P.M’s Rajarshi Shahu College of Engineering, Tathawade, Pune.
________________________________________________________________________________________________________
Abstract—Integration of Multibody Systems Analysis with Design of Experiments creates a powerful combination of tools
for thorough investigation of a specified design space, identification of the optimal system configuration, and the illustration of the effects on system changes on a given output. Classical Vehicle dynamics uses a mathematical model for evaluation of handling characteristics. This study is to demonstrate the use of modelling and simulation in assessing the performance of the whole vehicle system using Multi body system software and plot the effect of Kinematic and Compliance characteristics using virtual model. Step by step building complete vehicle model in Adams/Car, independently modelling various subsystems such as front suspension, steering, rear suspension, body, Powertrain, brakes and wheels as per vehicles specification. All these subsystems integrated to make full vehicle assembly. After validation of the virtual model, study the effect of these Kinematic and Compliance characteristics on handling performance of the vehicle. The vehicle mass, cornering stiffness of tires, the distance of center of gravity from both axles and vehicle speed are the parameters considered in the vehicle handling analysis. Compare these results with actual measurements done on a physical prototype using Suspension parameter measuring machine. Further testing of the vehicle model as per ISO guidelines and analyzing the impact of selected Kinematic and Compliance variables on the vehicle handling behavior.
Index Terms— Kinematic and Compliance, Suspension parameter measuring machine, Automatic Dynamic Analysis of
Mechanical Systems (ADAMs)
________________________________________________________________________________________________________ I. INTRODUCTION
Simulations in various mechanical systems using computers is becoming increasing important in many areas of engineering. The power of such programs lies in their ability to accurately simulate real world mechanical systems using computer code and equations. This eliminates design iterations of the prototype, lab testing and model revision. This reduction in hardware constructions saves time and money. Because of this and other benefits afforded by such digital simulation programs, their use is becoming more and more widespread. One of the dominant users of these programs is the automotive industry which is using ADAMs and other similar programs to do many types of studies, such as vehicle dynamics.
Vehicle Dynamics is the study of body motion of complete vehicle. The total vehicle system is subjected to different degrees of free motion. The interaction of these movements, each with its own velocity, acceleration, and frequency, makes a road vehicle one of the most complex systems in the field of dynamics. One objective of this study is to demonstrate the use of modeling and simulation in assessing the performance of the whole vehicle system using Multi body system software. And plot the K&C characteristics using virtual model, compare these results with actual measurements done on a physical prototype using Suspension parameter measuring machine. After validation of the virtual model, study the effect of these K&C characteristics on handling performance of the vehicle. Step by step building the vehicle model in Adams/Car and comparing the suspension K&C plots with those obtained from actual SPMM machine and thus validating the model. Further it continues with the testing of the vehicle model as per ISO guidelines and analyzing the impact of selected K&C variables on the vehicle handling behavior.
II.LITERATUREREVIEW
1. Reza Kazemi and Kaveh Soltani et al- In this paper, the effects of important design parameters on passenger cars untripped rollover were discussed and sensitivity of vehicle to some of parameters was determined. The prediction and simulation of vehicle rollover is very difficult. It needs additional modeling based on empirical data by taking energy dissipation, nonlinearities and effects of vehicle surrounding parameters like road surface, embankment into consideration. Based on the results of this study, conclusions are drawn that vehicle is very sensitive to the distance from body C.G. to roll axis, and the sensitivity is strongly related to other parameters such as inertia properties, maximum suspension travel, and suspension stiffness and damping. Also adjusting vehicle parameters to make vehicle more stable, needs very careful attention of an expert. Some vehicle design parameters have adverse and nonlinear effects on vehicle responses.
IJEDR1704001
International Journal of Engineering Development and Research (
www.ijedr.org
)
2
design parameters, such as roll stiffness and damping, stiffness in the heave mode and locations of roll centers. To improve rollover resistance the design parameters and guidelines for suspension were discussed. In particular, an analytical expression for the optimal roll center height from the viewpoint of rollover resistance was developed. The analytical results obtained are supported by the results of simulations, which show that the lateral accelerations at the rollover threshold predicted by the model are in a reasonably good agreement with the results of simulations.3. Orlandea et al- This paper describes a computer simulation of the front suspension of a Chevrolet using the ADAMS (Automatic Dynamic Analysis of Mechanical Systems) computer program. The model was proposed by the SAE fatigue design and evaluation on committee for evaluating the speed, economy and accuracy of various computer simulations in predicting displacements and loads in a suspension system.
In this paper author concluded that there is a substantial disagreement between experimental and simulated loads. Most of these errors are produced by the following factors like: Linear approximation of forcing effects, neglecting friction, representing the elastic bushing as ideal joints,
This model suggests that displacement behavior of the suspension can be simulated more accurately than reaction force.
4. Tatsuya Fukushima et al– Vehicle was modeled using finite element to represent tires and kinematics of the front and rear suspension systems. This vehicle model was used to simulate dynamic behavior of the vehicle like cornering and braking situation, including extreme conditions. The tires and suspension systems are fully modelled using finite elements and connected to a rigid body that represents the whole vehicle body. The model is used to perform cornering and braking behavior simulations and the results were compared with experimental data. In cornering behavior simulation; lateral acceleration and yaw rate calculated at vehicle CG where as in braking behavior simulation; longitudinal acceleration calculated shows good experimental results.
III. PROBLEM STATEMENT
Transient behavior describes vehicle handling characteristics in response to transition from straight-line motion into a turn or to a sudden course change. With a large time lag between steering input and rise in yaw rate, the vehicle feel sluggish and unwilling to corner. To improve transient behavior of the vehicle it is very important to identify the parameters which are largely determine the driver assessment of the vehicle. To identify these critical parameters and their governing design variables; work will be the analysis of the suspension characteristics & improve handling properties by varying values of its governing design variables. Transient handling analysis of full vehicle system using ADAMs and experimental results.
IV. OBJECTIVE The main factors have considered completing the research paper as follows:
1. Prediction of Kinematic & Compliance characteristics of vehicle suspension, steering systems using Adams/Car software 2. Measurement of Kinematic & Compliance characteristics of vehicle suspension using Suspension parameter measuring
machine (SPMM).
3. Comparison of results obtained using Adams/Car and Suspension parameter measuring machine. 4. Identify the critical suspension parameters for better vehicle handling performance.
V.METHODOLOGY
1. Study of literature survey & fundaments of vehicle dynamics - Collection and study of research papers and books relative to the objective
2. Learn ADAMS software & develop full vehicle model. Modelling of different vehicle sub-systems in Adams/Car (steering, suspension (front & rear), body,tire, brakes and powertrain). Assembling these sub-systems to make a full vehicle model 3. Simulating Kinematic and compliance analysis & measuring its characteristics - Setting up complete suspension assembly &
Perform wheel travel analysis (parallel & opposite) using kinematic and compliance characteristics in Adams/Postprocessor
4.
Comparison of results and model validation. Compare kinematic and compliance analysis results obtained from Adams/Carwith those obtained from physical prototype on SPMM.
5.
Simulating handling test iterations; conduct maneuvers/tests of geometrical suspension parameters (toe angle, track width, caster angle, scrub radius, camber angle). Use Adams/Postprocessor to plot & analyze results. Identify critical suspension parameters for better handling performance.2.Modelling of different vehicle sub-systems in Adams/Car:
ADAMs is an interactive motion simulation software for analyzing the complex behavior of mechanical assemblies. ADAMs allows virtual testing of prototypes and optimize
IJEDR1704001
International Journal of Engineering Development and Research (
www.ijedr.org
)
3
Fig. 1 Schematic representation of Multi body system.
Various vehicle modules prepared in ADAMS system are:
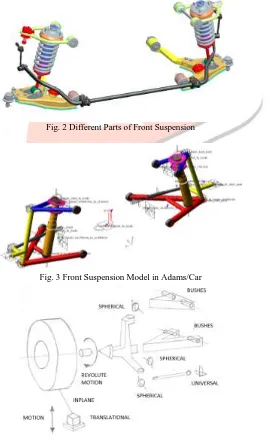
a) Front Suspension System:
Modeling of vehicle consists following subsystems; body, front suspension, steering, rear suspension, tire, powertrain and brakes. The vehicle used for this study is having double wishbone with coil spring type front suspension. Modelling of suspension system is begun with plotting hard points.
Fig. 2 Different Parts of Front Suspension
Fig. 3 Front Suspension Model in Adams/Car
IJEDR1704001
International Journal of Engineering Development and Research (
www.ijedr.org
)
4
The hard point coordinates for front suspension are as per table 1, these points belongs to right hand side of the suspension. As the suspension is symmetrical about the vertical center plane of the vehicle, the left hand side hard points are found out by putting negative valve for the y-coordinate.Table I. Hard point Coordinates for Front Suspension
Location X (mm) Y (mm) Z (mm)
Wheel center 0 790 -78
Track center 0 790 -410
Lower wishbone
Ball joint -6 708 -173
Front Pivot -155 345 -156
Rear Pivot 277 345 -156
Upper wishbone
Ball joint 21 611 240
Front Pivot -173 402 254
Rear Pivot 67 402 254
Rack & Pinion
On Rack 164 400 -121
On stub axle 130 682 -124
Damper On Chassis -60 476 294
On lower W/B -60 560 -121
Table II. Mass and MI Properties for Front Suspension Parts
Part Name Mass Ixx Iyy Izz Upper
control arm 3.54 2.3 x 10
4 4.1 x 10⁴ 6.3 x 10⁴ Lower
control arm 11.6 1.2 x 10
4 2.1 x 10⁴ 3.2 x 10⁴ Steering
Knuckle 8.2 2.2 x 10
4 1.1 x 10⁴ 1.2 x 10⁴ Tie rod 0.86 2.2 x 10⁴ 1.02 x 10⁴ 1.03 x 10⁴
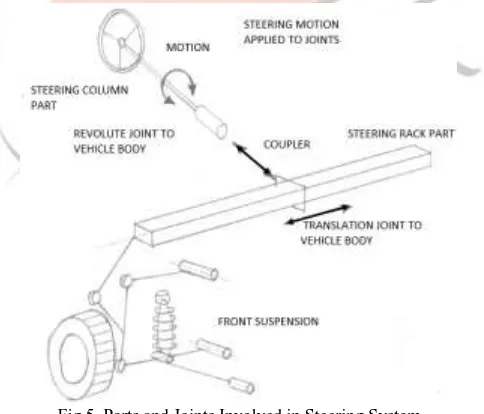
b) Steering System:
The steering inputs required to vehicle are applied as motion or torque inputs at this joint. The steering rack part is connected to the vehicle body by a translational joint and connected to the tie rod by a universal joint. The translation of the rack is related to the rotation of the steering column by a coupler statement that defines the ratio.
Fig 5. Parts and Joints Involved in Steering System
In order to implement the ratios used in the coupler, linking the rotation of the steering column with the steer change at the road wheels it is necessary to know the steering ratio. Hard points of steering system modeling shown in table III.
Table III. Hard point Co-ordinates for Steering System
Location X
(mm) Y
(mm)
Z
(mm)
Rack house mount 164 375 -121
Tie Rod inner 164 400 -121
IJEDR1704001
International Journal of Engineering Development and Research (
www.ijedr.org
)
5
Location X
(mm) Y
(mm)
Z
(mm)
Rack house mount 164 375 -121 Intermediate shaft
rearward 550 300 600
Pinion pivot 164 300 121
Steering wheel center 900 300 700
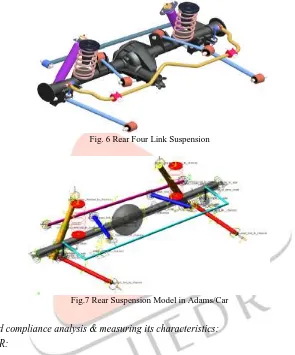
c) Rear Suspension System:
Four-link type rear suspension is modeled in similar way as explained in front suspension. The springs are modeled as per the L-D characteristics.
Fig. 6 Rear Four Link Suspension
Fig.7 Rear Suspension Model in Adams/Car
3.Simulating Kinematic and compliance analysis & measuring its characteristics:
a) Using ADAMS/CAR:
A steering sub-system and a front suspension sub-system, plus a suspension test rig, form the basis of a suspension assembly that is analyzed for kinematic behavior. Several parameters about the vehicle which include vehicle’s wheel base and sprung mass, un-sprung mass, wheel drive, braking ratio, loading conditions. For this analysis, front-wheel drive a brake ratio of 70% front and 30% rear are assigned.
Parallel & opposite/crossed wheel travel:
IJEDR1704001
International Journal of Engineering Development and Research (
www.ijedr.org
)
6
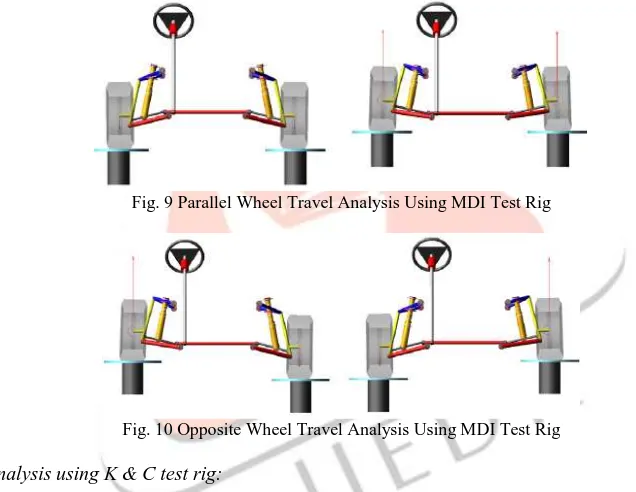
Fig. 8 Adams/Car MDI Suspension Test Rig
analysis, when one wheel goes in bump the other wheel simultaneously goes in rebound. This analysis is performed to simulate roll behavior of the vehicle. During the wheel motion, various suspension & steering characteristics, such as camber and toe angle, wheel rate, and roll center height are calculated.
Fig. 9 Parallel Wheel Travel Analysis Using MDI Test Rig
Fig. 10 Opposite Wheel Travel Analysis Using MDI Test Rig
b) Suspension analysis using K & C test rig:
IJEDR1704001
International Journal of Engineering Development and Research (
www.ijedr.org
)
7
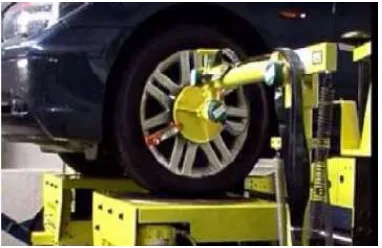
Fig. 11 Suspension parameter measuring machine (SPMM) test rig.
The machine can impart a wide variety of displacements, forces and moments to quantify a wide range of suspension characteristics; like suspension stiffness, bump-steer, roll-steer, roll stiffness distribution, longitudinal & lateral compliance. Various measurements are made at the wheel center & most commonly calculated outputs are as listed below:
Bump movement Caster angle Half-track change Camber angle Steer Toe angle Steering inclination Roll center height Wheel rate. 4.Comparison of results and model validation.
An actual prototype under development is mounted on SPMM. The wheels are subjected to vertical displacement and roll displacement. An exercise conducted on the suspension test rig with the use of ADAMS virtual test, where front suspension with steering system is mounted on the test rig. Parallel & opposite wheel travel analysis are performed and results are plotted in ADAMS/ post-processor. The plots are evaluated based on the three criteria, viz. nature of curve, values obtained and gradients of the curve.
1. Simulating Kinematic and Parallel wheel travel
1.1 Measured Parameter: Toe angle
Graph 1. Toe change Vs Susp. Stroke (SPMM Results)
Graph 2. Toe change Vs wheel travel(Adams/Car Results)
IJEDR1704001
International Journal of Engineering Development and Research (
www.ijedr.org
)
8
Graph 3. Camber change Vs Susp. Stroke (SPMM Results)
Graph 4. Camber angle Vs wheel travel(Adams/Car Results)
1.3 Measured Parameter: Caster Angle
Graph 5. Caster changeVs Susp. Stroke (SPMM Results)
Graph 6. Caster angle Vs wheel travel(Adams/Car Results)
IJEDR1704001
International Journal of Engineering Development and Research (
www.ijedr.org
)
9
Graph 7. Roll center ht. Vs Susp. Stroke (SPMM Results)
Graph 8. Roll center ht. Vs wheel travel(Adams/Car Results)
2. Roll Motion Analysis: opposite wheel travel
2.1 Measured Parameter: Roll Steer
Graph 9. Toe change. Vs Roll angle(SPMM Results)
IJEDR1704001
International Journal of Engineering Development and Research (
www.ijedr.org
)
10
2.2 Measured Parameter: Roll Camber
Graph 11. Camber change Vs Roll angle (SPMM Results)
Graph 12. Camber angle Vs Roll angle (Adams/Car Results)
2.3 Measured Parameter: Caster Change
Graph 13. Caster change Vs Roll angle (SPMM Results)
IJEDR1704001
International Journal of Engineering Development and Research (
www.ijedr.org
)
11
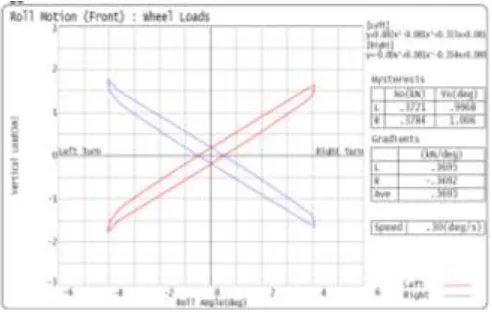
2.4 Measured Parameter: Vertical Wheel Loads
Graph 14. Wheel loadsVs Roll angle (SPMM Results)
Graph 16. Wheel loadsVs Roll angle (Adams/Car Results)
VI. RESULTSANDVALIDATION
An exercise is undertaken to correlate the results obtained from ADAMS/Car with those obtained from the SPMM. The co-relation of values is summarized as following:
Table IV. Comparison of vertical motion analysis Parameters
Results
Co-relation of values in %
(SPMM) (ADAMS)
Toe angle 0.0058 0.006 90
Camber
angle 0.025 0.020 78
Caster angle 0.0228 0.0230 84
Roll center
height 1.25 1.50 76
Table V. Comparison of Roll motion analysis Parameters Results Co-relation of
values in %
(SPMM) (ADAMS)
Roll Steer 0.078 0.085 80
Roll Camber 0.220 0.277 78
Caster angle 0.265 0.293 88
IJEDR1704001
International Journal of Engineering Development and Research (
www.ijedr.org
)
12
VII. CONCLUSIONThe following are the some major conclusions drawn from this dissertation work:
1. The kinematic and compliance characteristics are predicted using Adams/car and the results obtained are shown in the form of graphs.
2. Also these kinematic and compliance characteristics are measured on suspension parameter measuring machine and the results obtained are shown in the form of graphs.
3. By following the comparison made between Adams/Car and SPMM results, conclusion can be drawn that Adams/Car results match very well with the corresponding SPMM results. On an average the co-relation obtained in the values is 83%. 4. By randomly choosing five geometrical suspension parameters, handling test iterations are carried out in Adams/Car by
assigning different values to these parameters.
5. After comparing the obtained results, conclusion can be drawn that, out of the chosen five parameters, toe angle and caster angle had profound impact on the vehicle’s overall handling behavior. Even a slightest change in the value of toe and caster angle was inducing large change in the vehicle’s understeer gradient.
6. Also it is seen that, on the other hand, the remaining parameter viz. camber angle, track width, scrub radius did not had any appreciable influence on the vehicle cornering ability as well as transient roll over stability.
7. Using this knowledge, automobile designer will be able to focus only on these critical parameters to achieve good handling performance.
8. Using the method of virtual prototyping, reduction in development time and cost can be achieved. VIIIREFERENCE
[1] Reza Kazemi and Kaveh Soltani, “Effect of Important Parameters on Vehicle Rollover”, Journal of SAE Technical Paper Series, 2003, Paper No.:2003-01-0170
[2] Aleksander Hac, "Rollover Stability Index Including Effects of Suspension Design", Journal of SAE Technical Paper Series, 2002, Paper No.:2002-01-0965.
[3] N. Orlandea, “Simulation of a Vehicle Suspension with the Adams Computer Program”, Journal of SAE Technical Paper Series, 2000, Paper No.: 2000-01-0153.
[4] Tatsuya Fukushima, “Vehicle cornering and braking behavior simulation using a finite element method”, Journal of SAE Technical paper series, 2005, paper no.: 2005-01-0384.
[5] Allen, R.W., Szostak, H. T., Rosenthai, T. J., Kiyde,D.H. and Owens, K.J., "Characteristics influencing ground vehicle Lateral/directional dynamic stability", SAE 910234, 1991.
[6] R. Anbazhagan1, B. Satheesh and K. Gopala Krishnan, “Mathematical Modeling and Simulation of Modern Cars in the Role of Stability Analysis”, Journal of science and technology.
[7] R. Wade Allen, Theodore J. Rosenthal, David H. Klyde and Jeffrey R. Hogue “Computer Simulation Analysis of Light Vehicle Lateral/DirectionalDynamic Stability”, Journal of SAE Technical paper series 1999-01-0124