Shaoping Chen • Hiroo Tanaka
Surface analysis of paper containing polymer additives by X-ray
photoelectron spectroscopy h Application to paper containing dry
strength additives
Received: September 12, 1997 / Accepted: January 29, 1998
Abstract The surfaces of handsheets containing polydiallyl- dimethylammonium chloride ( P D A D M A C ) and anionic polyacrylamide (A-PAM) were analyzed using X-ray pho- toelectron spectroscopy (XPS). The observed Nls chemical shifts were compared with those of the strength additives. Chemical covalences on paper surfaces due to a small amount of polymer additives were clarified and determined by an XPS curve-fitting technique. Some of the problems associated with surface analysis of paper by XPS are dis- cussed. The effects of strength additives on the fiber surface or between fibers are illustrated. This technique appears promising as a tool to analyze paper surfaces treated with small amounts of polymer additives.
Key words XPS Paper strength additive Polydiallyldimethylammonium chloride Anionic polyacrylamide
Introduction
The surface chemistry of paper plays an important role in the performance of the paper during its end use. When various chemical additives and wood components migrate to the surfaces of fibers, the surface properties of the paper can be changed dramatically. Such additives include, for example, wet-strength resins to improve mechanical strength when the paper is wet ~-3 and sizing agents to impart water repellency. 4-7 Changes in the performance of the paper are strongly related to the functional groups of the additives. Although X-ray photoelectron spectroscopy
S. Chert • H. Tanaka ( ~ )
Department of Forest Products, Faculty of Agriculture, Kyushu University, Fukuoka 812-8581, Japan
Tel. +81-92-642-2992; Fax +81-92-642-3078 e-mail: [email protected] S. Chen
Faculty of Chemistry, Fujian Normal University, Fujian, China
Part of this paper was presented at the 64th Pulp and Paper Research Conference, Tokyo, Japan, June 19-20, 1997
(XPS) was found to be a powerful tool for chemical analysis of surfaces of synthetic polymers, 8-zl natural and modified textiles, ~2'13 and wood and cellulose fibers, 1445 no detailed study of covalent bonds on the paper surface due to small amounts of polymer additives has been reported in the literature.
We first discuss experimental conditions to confirm by XPS that chemical covalent bonds arise from small amounts of strength additives on the paper surface. As an illustration of the problem-solving capability of this technique, three examples of hand-made paper analysis are described. The first example represents XPS Cls, Ols, and Nls spectra of a hardwood bleached kraft pulp (LBKP) handsheet made with no additive. The second example illustrates the characteristic XPS Nls spectrum of paper containing polydiallyldimethylammonium chloride ( P D A D M A C ) , and the third example is of a handsheet containing 0.2% P D A D M A C and 0.5% anionic polyacrylamide (A-PAM) on dry pulp. The effect of paper strength additives on the fiber surface or between fibers on paper strength is explained.
Materials and methods
Handsheets: preparation and strength properties
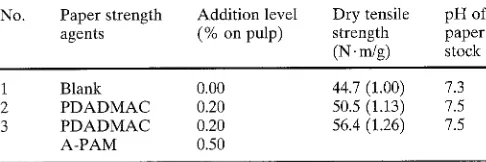
The various polymer additives were added to an LBKP slurry (Table 1). The standard handsheets with a grammage of 60g/m 2 were made at pH 7.5. P D A D M A C was used as a retention aid for A-PAM. The wet handsheets were pressed at 345kPa for 5min and dried at 105°C for 10min in a convection oven. The tensile strength of the paper sheet was determined according to JIS P8113.
Preparation of samples for XPS characterization
304
Table
1. Effects of PDADMAC and A-PAM on dry tensile strengthNo. Paper strength Addition level Dry tensile p H of
agents (% on p u l p ) strength paper (N. m/g) stock
1 Blank 0.00 44.7 (1.00) 7.3
2 P D A D M A C 0.20 50.5 (1.13) 7.5
3 P D A D M A C 0.20 56.4 (1.26) 7.5
A-PAM 0.50
Pulp: LBKP (hardwood-bleached kraft pulp).
PDADMAC, polydiallyl dimethlammonium chloride; A-PAM, ani- onic polyacrylamide.
were prepared by applying the aqueous polymer solution (5%) to a stainless steel plate (5 × 10mm) and heating at 105°C for 10min. The films were cooled to 22 ° -+ 2°C in a desiccator. The P D A D M A C and A - P A M powders, which were prepared by pouring 40% P D A D M A C and 15% A - P A M aqueous solutions into acetone, respectively, were fixed to an electrically conductive adhesive-coated tape (5 x 10mm).
Equipment
All analyses were performed on an AXIS-HSi spectrometer from Shimadzu/Kratos. Monochromatic A1Ka radiation was used to excite the electrons. Unmonochromated A1Ka radiation was also used for comparison. For all analyses, a low-energy electron flood gun was applied to neutralize the specimen surfaces. The background pressure during the analysis was in the low 0.1#Pa range. Curve fitting and quantification were performed using version 1.4.0 provided on the system. Binding energies of all spectra were related to carbon ls(C-C) at 285 eV.
Results and discussion
Analysis conditions
Effects of charging compensation
For a successful XPS analysis of paper, the surface of which was insulating, minimization of sample charging was the critical factor. A n unmonochromated X-ray source (A1Ka) generates low-energy electrons as the bremsstrahlung com- ponent of the radiation passes through the aluminium foil separating the anode from the sample chamber. For this reason, unmonochromated XPS of an insulator does not normally require any additional charge compensation, as shown in Fig. la. However, a monochromated source does not generate such low-energy electrons, so not only is the intensity of the spectrum low but the chemical shifts are large, as shown in Fig. lb. Sample charging can shift the photoelectron peak tens (15eV in Fig. la,c) or hundreds (221eV in Fig. lb,d) of electron volts. Furthermore, the intensity of the spectrum of monochromated A1Ka is six
3 ¸
~ z
~ 2
×
~;~"~ 3
(a) Ols
15.27Cls
I000 800 600 400 200 0
(e)
Ols
2 ¸
0 ~ .. ... .. ... .. : - : - ~ ' ,
2000 800 600 400 200 0
2.
0
1000 800 600
2s10202s
I (d) Ols
400 200 0
Cls
i
s ~
~ls
0 J . . . : , : : : . ,
1000 800 600 400 200 0
Binding Energy (eV)
Fig. 1. X-ray Photoelectron spectroscopic (XPS) survey spectra of an anionic polyacrylamide (A-PAM)-containing handsheet, a,c Unmono- chromated AIK(x source,
b,d
Monochromated AIK(x source, a,b Elec- tron flood gun off. c,d Electron flood gun on. Measuring conditions: voltage 15kV, current 10mA, pass energy 80eV, sweep times 5times that of unmonochromated A1Ka in charging compen- sation, as shown in Fig. ld,c.
Resolution
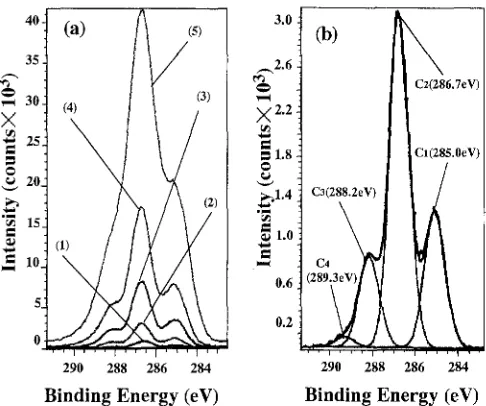
For the more precise identification of chemical states, excel- lent energy resolution is an important factor. The C core- level spectra for a handsheet sample in this study were compared at different pass energies (PEs), as shown in Fig. 2a. The peaks of the C1, C2, C3, and C4 components derived by curve fitting are shown in Fig. 2b. The full width at half- maximum (FWHM) values of the C1, C2, C3, and C4 compo- nents derived at different PEs are given in Table 2. Excellent energy resolution was obtained at a pass energy of 5 eV (Table 2) but with a considerable sacrifice of inten- sity, which, for example, reduces from the 41 × 103 counts of PE 80eV to 1 × 10³ counts of PE 5eV (Fig. 2a). A good compromise between intensity and energy resolution is ob- tained at 10eV pass energy if the integrating times are lengthened 10-50 times. Figure 3a shows Cls spectra re- corded for the same sample as that in Fig. 2 under the conditions shown in Table 3. The FWHM of the C1, C2, C3, and C4 components are 1.13, 1.07, 1.08, and 1.09 eV, respec- tively; and the intensity is almost the same as that of PE 40 eV (Fig. 2a). With the same instrument settings, but using the unmonochromated A1Ka source, the widths are 1.51, 1.30, 1.40, and 1.40 eV, respectively, as shown in Fig. 3b. The details of the XPS analyses are listed in Table 3.
XPS of P D A D M A C and A - P A M
4 0 ! ( a )
3s I
30-" (4)
i
•
0
290 288
1 (5)
(:
\
286 284
Binding Energy
(eV)
3.0 1 (b)
•
\
2 z ( 2 8 6 . 7 e V )
21(285.0eV) C3(288.2eV) /
290 288 286 284
Binding Energy (eV)
Fig.
2. a Comparison of the Cls core-level spectra for a hardwood bleached kraft pulp (LBKP) handsheet sample in this study at different pass energies (PEs). (1) PE 5eV; (2) PE 10eV; (3) PE 20eV; (4) PE 40eV; (5) PE 80eV. b High-resolution Cls XPS at PE 10eV. X-ray source was monochromated A1KR; voltage 15kV; current 10mA; sweep times 10; electron flood gun onTable 2. FWHM of core-level components Pass energy
(eV)
FWHM of components (eV)
Ci
C2 C3 C45 1.08 1.04 1.06
10 1.12 1.06 1.10
20 1.15 1.09 1.15
40 1.19 1.19 1.24
80 1.49 1.40 1.49
See Fig. 2.
FWHM, full width at half-maximum.
1 4 -
(a)
~ ,
12
b
=~a
C 3
C4
2 '
F , , , i , , , \
C a
q
!
' ' , i , , , , , ,
292 290 288 286 284 282
Binding Energy (eV)
2 . 0 ~
~ - ~ 1.8-
16i
1.4-
"~ 1.0- 0.8"
0 . 6 4
0.4-~
b'
a
. . . i ,
292 290 288 286 284 282
Binding Energy (eV)
Fig. 3.
Cls core-level spectrum for the same sample as that of Fig.2.
The measuring conditions are shown in Table 3. a Monochromated A1Ku. b Unmonochromated A1Ka. C1, Ca, C3, C4: see Fig. 2b. Full width at half-maximum (FWHM): a, 1.I3eV; b, 1.07eV; c, 1.08eV; d, 1.09 eV; a', 1.51eV; b', 1.30eV; c', 1.40eV;
d',
1.40eVTable 3. Conditions for XPS analysis
XPS AXIS-HSi
X-ray source Monochromatized A1Ka
Output 15kV × 10mA
Vacuum level <5 × 10 7pa
Data processing Version 1.4.0 (Kratos)
Analyzer pass energy (eV) 10
Integration times 50
Analyzer mode HYBRID mode
Sample size (mm × mm) 5 × 10
XPS, X-ray photoelectron spectroscopy.
Table
4. XPS analysis of PDADMAC with and without heatingParameter Cls Nls
1
2
3
1
2
Sample 1
BE (eV) 285.0 286.3
FWHM (eV) 1.19 1.32
Area (%) 49.9 50.1
Sample 2
BE (eV) 285.0 286.2
FWHM (eV) 1.19 1.32
Area (%) 50.0 43.6
Structure of PDADMAC
402.6
no 1.15
100
288.1 402.6
2.04 1.15
6.4 66.5
1 i 1
- C H : - C H - C H - C H ~ -
c~2 ~cHa
~N ÷ Ct aCH5 ~CH3
n o
399.7 1.16 33.5
1.05 Sample 1, PDADMAC powder sample precipitated from 40% 1.09 PDADMAC aqueous solution by pouring into acetone; sample 2, film 1.15 sample formed by heating PDADMAC aqueous solution at 105°C for 1.19 10min.
1.35
T h e C l s spectra data c o r r e s p o n d e d to the = C H - C H 2- structure a n d the - (CH2) 2- N ~ - (CH3) 2 structure at b i n d i n g energies (BEs) of 285.0 a n d 286.2eV, respectively. T h e dif- ference in both areas is 0.2%, as shown in T a b l e 4, which indicates that the error in XPS m e a s u r e m e n t s is low. T h e N l s XPS data show the c o m p o n e n t at B E 402.6 eV, attribut- able to the - ( C H z ) z - N + - ( C H 3 ) 2 structure.
W h e n aqueous P D A D M A C was heated to dryness at 105°C for 10rain, the expected heat d e n a t u r a t i o n was con- firmed by the a p p e a r a n c e of a n e w C l s c o m p o n e n t at a b o u t B E 288.1eV a n d an N l s c o m p o n e n t at a b o u t B E 399.7eV, as shown in T a b l e 4 (sample 2).
306
Table g. XPS analysis of A-PAM with and without heating
Parameter Cls Nls Ols
1 2 3 4 1 2 3
Sample 1
BE (eV) 285.0 285.4 288.5 289.3 399.9 531.6 532.2 533.3
FWHM (eV) 1.04 1.10 1.15 1.22 1.31 1.30 1.43 1.46
Area (%) 36.3 36.4 24.4 2.9 100 80.2 9.9 9.9
Sample 2
BE (eV) 285.0 285.4 288.5 289.3 399.9 531.6 532.2 533.3
FWHM (eV) 1.04 1.10 1.15 1.22 1.31 1.30 1.43 1.46
Area (%) 36.5 36.3 24.3 3.0 100 80.0 10.0 10.0
Sample 3
BE (eV) 285.0 285.4 288.5 399.8 531.5
FWHM (eV) 1.01 1.10 1.15 no 1.31 1.34 no no
Area (%) 36.0 36.0 27.0 100 100
Structure°fA-PAM(n=lO°/°'m=90%):
4 1CH2 - CH2 ~ , C H 2 -- CI-I2 ~[ co O N a n [ O NH a Jm
Sample 1, A-PAM powder sample precipitated from pouring 15 % A-PAM aqueous solution into acetone; sample 2, film sample formed by heating A-PAM aqueous solution at 105°C for 10min; sample 3, literature values 26 of polyacrylamide (PAM).
XPS of handsheets with and without paper strength
additives
Carbon signal
The carbon atoms in woody materials were divided into
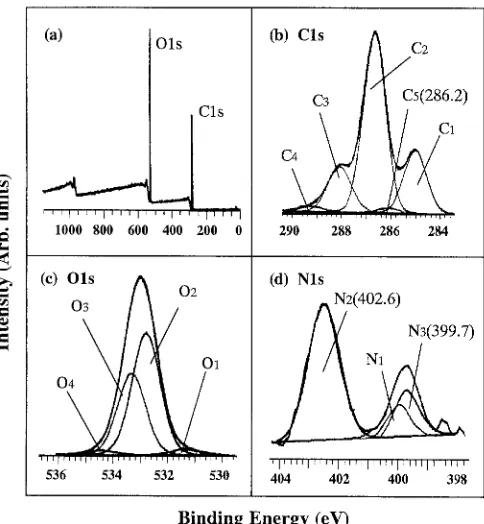
four categories based on their chemical shifts, is Figure 4b
shows a high-resolution Cls signal for paper without addi-
tives. The total signal can be resolved into four peaks (C1-
C4) due to carbons at different oxidation levels: C1 refers
to unoxidized carbon, C2 refers to carbon with one bond to
oxygen (i.e., O - C ) , C3 refers to carbon with two bonds to
oxygen (i.e., O - C - O and C=O), and C4 refers to carbon
with three bonds to oxygen (i.e., O - C = O ) . C2 and C3 com-
ponents arise mainly from cellulose and C, and C4 mainly
from lignin and wood
extractives. 14A5'24'25Figure 5b shows the Cls spectra of XPS for P D A D M A C -
containing paper. The Cls peak shows five components.
The new C 5 fraction of 286.2eV arises from the
- ( C H 2 ) 2 - N + -
(CH3) 2 structure of P D A D M A C (Table 4).
In the case of the ( P D A D M A C + A-PAM)-containing
sheet (Fig. 6b), the Cls peak has been curve-fitted with
seven components. The new C6 and C7 fractions at 285.4 and
288.5eV are attributable to = C H - C H 2 - and -CONH2,
respectively.
Although the C l s peaks (Cs, C6, Cv) for P D A D M A C and
A - P A M are detected apparently on the surface of the paper
to which P D A D M A C and P D A D M A C + A - P A M were
added, these peak areas (Cs + C6 + C7) are much smaller
than total peak areas (C~-C7) of Cls in the sheet. For ex-
ample, the mass concentration of C5 + C6 + C7 components
to total mass of C atoms is only 2.55%. The Cls spectra is
therefore not suitable for identifying the chemical cova-
lence on the paper surface arising from small amounts of
strength additive.
.=
(a)
Ols
Cls
1000 S00 600 400 200
(c)
Ols
O3(5~ ~ ~302(531.~i)
O 4 ( 5 3 4 . 2 ) ~
~,1,,i,i .... i~llL,~llllt~,ll,l.i [
536 534 532 530
(b) C l s
C2(286.7)
C1(285.0)
,,,,1,,,~1,~1, I ....
290 288
>,
.... I .... I .... I ....
286 284
(d) N l s
N1(399.9)
402 401 400 399 398
Binding Energy (eV)
Fig. 4. XPS spectra for the LBKP sheet without additives, a Survey
spectra, b Cls peak. c Ols peak. d Nls peak
Oxygen signal
d
(a)
01s
Cls
, , , l l J , i , l l l , , , I , ~ t i i'~ll
1000 800 600 400 200 0
(c)
Ols / ' ~ 0201
' 1 ' 1 I I ' 1 I I I ' ' ~ 1 ] I ' I ' 1 . . . . [ . . . . I " 1 ' 1 ' '
536 534 532 530
,Cls ! C2
C3 2)
290 288 286 284 (d) Nls
(402.6)
N3(399.7)
404 402 400 398
Binding Energy (eV)
Fig. 5. XPS spectra for the LBKP sheet containing polydiallyl dimethylammonium chloride (PDADMAC) at the 0.2% level on dry pulp. a Survey spectra, b Cls peak. c Ols peak. d Nls peak
° N
~4 <
.=
(a)
Ols
i
Cls
, ~ l q l I l i t ~ I I I I 1 ~ I l l i t t l
1000 800 600 400 200 0
(c) Ols
/ / ~02
536 534 532 530
(b)
Cls
A / C 2 I XC 7 ( 2 8 8 . 5 ) ~ " I C5 C t
\
III/
'i;;'
'H ' i d
(d) Nls
/ ~404 402 400 398
Binding Energy (eV)
Fig.
6. XPS spectra for the LBKP sheet added with PDADMAC at the0.2% level and with A-PAM at the 0.5% level on dry pulp. a Survey spectra, b Cls peak. c Ols peak. d Nls peak
307 In our study curve-fitting on the O l s spectra was per- formed according to
High Resolution XPS of Organic Poly-
mers, 26
a highly authoritative book on XPS data. The O l s spectra analysis of the additive-free sheet give O1, 02, 03, and 04 components at BE 531.6, 532.9, 533.5, and 534.2eV, respectively, as shown in Fig. 4c. The BEs ofO2 and 03 are in an excellent agreement with those of cellulose reported in the literature. 26 O1 and 04 components arise mainly from lignin and wood extractives.The O l s peaks of the PDADMAC-containing sheet (Fig. 5c) and of the ( P D A D M A C + A-PAM)- containing sheet (Fig. 6c) are similar to those of additive- free paper.
In the P D A D M A C + A - P A M added case (Fig. 6c), the peak area of the O1 fraction at 531.6eV increased slightly, arising from a - C O N H 2 structure. However, for the same reason as for the Cls, because the mass concentration of O of - C O N H 2 is only 1.2% of the total mass of O atoms, it is difficult to identify the chemical covalence caused by small amounts of strength additive from the Ols spectra of the paper.
Nitrogen peaks
The survey spectra of an LBKP sheet is shown in Fig. 4a. The carbon and oxygen can be easily detected, but a nitro- gen peak is difficult to find. Although the nitrogen originally present in the sheet was found by increasing the integrating time, the amounts were small, less than 0.08% of the total mass of the C, O, and N atoms (Table 6). It is therefore possible to identify the chemical covalences arising from small amounts of additive containing nitrogen on the paper by analyzing the Nls spectra.
The Nls core-level spectrum for an additive-free sheet (Fig. 4d) has been curve-fitted with components arising from the nitrogen of the - C O - N H - structure at BE 399.9eV, 26 which originates from protein in pulps.
Figure 5d shows the high-resolution and curve-fitted XPS of Nls signals for PDADMAC-containing paper. It reveals two new peaks not present in the signals for additive-free paper: the N fractions of the -(CH2)2-N +-(CH3)2 structure at BE 402.6 eV and of heat denaturation at BE 399.7 eV.
The Nls spectra for paper containing P D A D M A C + A- P A M (Fig. 6d) shows these NI-N3 three components to be the same BEs as for the PDADMAC-containing sheet. However, a considerable increase in the area of the N~ fraction at 399.9eV, from 3 to 14eV.counts (Table 6), was observed in this case. Because N 1 is associated with the - C O N H 2 structure, this increase indicates the presence of A - P A M on the paper surface.
308
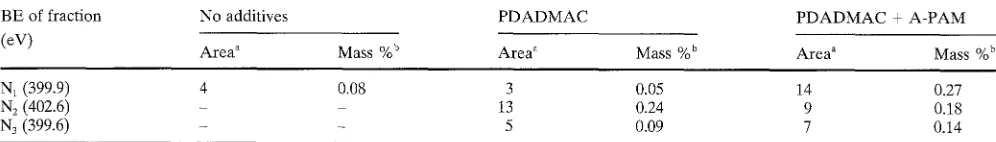
Table 6. XPS Nls peaks analysis of additive-free sheet, PDADMAC-containing sheet, and (PDADMAC + A-PAM)-containing sheet
BE of fraction No additives PDADMAC PDADMAC + A-PAM
(eV)
Area a Mass %b Area . Mass %b Area a Mass %b
N1 (399.9) 4 0.08 3 0.05 14 0.27
N 2 (402.6) - -- 13 0.24 9 0.18
N3 (399.6) - - 5 0.09 7 0.14
aThis is raw area of Nls peak, the unit is eV. counts. The counts are those of net peak intensity.
bMass concentration of nitrogen fraction is the percentage mass of the nitrogen fraction to total mass of C, O, and N atoms in the sample.
P D A D M A C is 0.017% on pulp; N of A - P A M is 0.09% o n pulp), indicating that the p o l y m e r additives used in this study are m a i n l y distributed o n the fiber surface.
Effects of strength additives o n the dry tensile strength
D r y tensile strengths of handsheets c o n t a i n i n g P D A D M A C + A - P A M at p H 7.5 and of handsheets with n o additive a n d with only P D A D M A C are shown in T a b l e 1. T h e dry tensile strength of handsheets c o n t a i n i n g only P D A D M A C is somewhat higher (13%) than that of the additive-flee paper. It is guessed that a larger fiber and fiber contact area is created through networks formed by P D A D M A C adsorbed on the surface of fibers and b e t w e e n fibers w h e n sheets were formed.
With the addition of A - P A M , a significant increase (26 %) in dry tensile strength was obtained. It was attributed to h y d r o g e n b o n d s formed b e t w e e n A - P A M / A - P A M a n d A - P A M / c e l l u l o s e through the presence of A - P A M o n the fiber surface.
Conclusions
The conditions for XPS m e a s u r e m e n t s of handsheets con- taining small a m o u n t s of paper strength additives were discussed. Based o n the evidence, the use of flood guns and m o n o c h r o m a t e d X-rays are r e c o m m e n d e d . T h e XPS chemical shift data o b t a i n e d for A - P A M a n d P D A D M A C are in good a g r e e m e n t with values reported in the literature.
T h e observed N l s chemical shifts for handsheets con- taining P D A D M A C a n d P D A D M A C + A - P A M were compared with those of P D A D M A C alone and A - P A M alone. XPS analysis m a d e it possible to d e t e r m i n e chemical covalences on a paper surface arising from small a m o u n t s of p o l y m e r additive. The n i t r o g e n con- c e n t r a t i o n detected o n the h a n d s h e e t surfaces by XPS analysis indicate that p o l y m e r additives used in this study are distributed mainly o n the fiber surface.
A n increase in dry tensile strength for paper sheet con- taining P D A D M A C + A - P A M was attributed to h y d r o g e n bonds formed b e t w e e n A - P A M / A - P A M a n d A - P A M / c e l - lulose, a n d the networks f o r m e d by P D A D M A C a n d A- P A M on the fiber surface.
References
1. Britt KW (1981) Wet strength. In: Casey JP (ed) Pulp and paper chemical technology, 3rd edn. Wiley Interscience, New York, pp 1609-1624
2. Dunlop-Jones N (1991) Wet-strength chemistry. In: Roberts JC (ed) Paper chemistry. Chapman & Hall, New York, pp 76-97 3. Eklund D, Lindstr6m T (1991) Wet strength. In: Paper chemistry,
an introduction. DT Paper Science, Grankulta, Finland, pp 89- 104
4. Keavney JJ, Kulick RJ (1981) Internal sizing. In: Casey JP (ed) Pulp and paper Chemical Technology, 3rd edn. Wiley Interscience, New York, pp 1547-1580
5. Gess JM (1991) The sizing of paper with rosin and alum at acid pHs. In: Roberts JC (ed) Paper chemistry. Chapman & Hall, New York, pp 97-113
6. Roberts JC (1991) Neutral and alkaline sizing. In: Roberts JC (ed) Paper chemistry. Chapman & Hall, New York, pp 114-131 7. Ektund D, Lindstr6m T (1991) Water penetration and internal
sizing. In: Paper chemistry, an introduction. DT Paper Science, Grankulla, Finland, pp 192-222
8. Dwight DW, Riggs WM (1974) Fluoropolymer surface studies. J Colloid Interface Sci 47:650-660
9. Courval GJ, Gray DG, Goring DAI (1976) Chemical modification of polyethylene surfaces in a nitrogen corona. J Polym Sci Chem 14:231-235
10. Clark DT, Peeling J, O'Malley JM (t976) Application of ESCA to polymer chemistry. XIII. Surface structures of AB block copoly- mers of polydimethylsiloxane and polystyrene. J Polym Sci Chem 14:543-551
11. Zhang X, Kang ET, Neoh KG, Tan KL, Kim DY, Kim CY (1996) Surface studies of pristine and surface-modified polypyrrole films. J Appl Polym Sci 60:625-636
12. Soignet DM, Berni RJ, Benerito RR (1976) Electron spectroscopy for chemical analyses (ESCA)--a tool for studying treated textiles. J Appl Polym Sci 20:2483-2495
13. Millard MM, Pavlath AE (1972) Surface analysis of wool fibers and fiber coatings by x-ray photoelectron spectroscopy. Text Res J 42:460-463
14. Dorris GM, Gray DG (1978) The surface analysis of paper and wood fibres by ESCA (electron spectroscopy for chemical analy- sis). I. Application to cellulose and ligniu. Cell Chem Techno112:9- 23
15. Dorris GM, Gray DG (1978) The surface analysis of paper and wood fibres by ESCA. II. Surface composition of mechanical pulps. Cell Chem Technol 12:721-734
16. Ahmed A, Adnot A, Kaliaguine S (1987) ESCA study of the solid residues of supercritical extraction of Populus tremulo~des in methanol. J Appl Polym Sci 34:359-375
17. Ahmed A, Adnot A, Kaliaguine S (1988) ESCA analysis of par- tially converted lignocellulosic materials. J Appl Polym Sci 35:1909-1919
18. Ahmed A, Adnot A, Grandmaison JL, Kaliaguine S, Doucet J (1987) ESCA analysis of cellulosic materials. Cell Chem Technol 21:483-492
20. Kamdem DP, Riedl B, Adnot A, Kaliaguine S (1991) ESCA spec- troscopy of poly (methylmethacrylate) grafted onto wood fibers. J Appl Polym Sci 43:1901-1912
21. Ohno N, Sawatari A, Yoshimoto I (1992) Studies on distribution of extractives in pulp fibres by means of ESCA (in Japanese). Jpn Tappi 46:1295-1312
22. Hua X, Kaliaguine S, Kokta BV, Adnot A (1993) Surface analysis of explosion pulps by ESCA. Part 2. Oxygen (ls) and sulfur (2p) spectra. Wood Sci Technol 28:1-8
23. Ben Y, Kokta BV, Doucet J, Kaliaguine S (1993) Effect of chemical pretreatment on chemical characteristics of steam
explosion pulps of aspen. J Wood Chem Technol 13:349- 369
24. Laine J, Stenius P (1994) Surface characterization of
unbleached kraft pulps by means of ESCA. Cellulose 1:i45 160
25. Koubaa A, Riedi B, Koran Z (1996) Surface analysis of press dried-CTMP paper samples by electron spectroscopy for chemical analysis. J Appl Polym Sci 61:545-552