110
Ann Back Propagation For Forecasting And
Simulation Hydroclimatology Data
Syaefudin Suhaedi, Evi Febriana, Syaharuddin, HRP Negara
Abstract: Government policies in distributing fertilizers and seeds of food crops such as rice and crops depend on the growing season of the farmers. Therefore, before conducting the distribution, it is necessary to spread early planting season in each region farmers so that the result of distribution is optimal. One of the alternatives that must be done first is to predict the pattern of hydroclimatological data cycle of the coming year to see the pattern of data of previous years. In this case required a method that can be used to predict the hydroclimatological data. The exact method used to make predictions is Artificial Neural Network (ANN) Back Propagation. As a follow-up step will be predicted by this ANN will be used to build system planning optimal cropping pattern for agricultural crops to avoid harvest failure (puso) in order to obtain maximum production results so as to support national food security. Based on the results of the simulation is known that ANN Back Propagation with two hidden layer are able to predict hydroclimatological data with an average accuracy of 95.72% - 96.61%. While the prediction validation obtained an average percentage error of 1.12% with the accuracy of 99.76%. The data used for training, testing, validation, and prediction are data in Central Lombok, NTB, Indonesia.
Index Terms: GUI, Matlab, ANN, Back Propagation, Hydroclimatology, Data
————————————————————
1
I
NTRODUCTIONThe Master Plan for the Acceleration of Economic Development of Indonesia (MPAEDI), West Nusa Tenggara (NTB) in corridor V, namely as a sector supporting food security and tourism. This is the benchmark of various planning and development of work programs in the field of agriculture is continuously implemented by the Government of NTB for food and food needs for both the people of NTB and the people of Indonesia are met maximally. On the other hand, the last eight years of climate change resulting in puso or crop failure have been felt in most parts of Indonesia, especially in NTB. Almost every year the area of cultivated land (ha) is drought and the number of production (tons) experiences crop failure especially in NTB priority food crops such as rice, corn, soybean, peanuts, green beans, cassava and sweet potato [10]. This is due to the changes and seasonal shifts which one main indicator is the pattern of unpredictable rainfall. This phenomenon makes the farmers in NTB difficulty in determining the pattern of planting food crops. Therefore, there is a need for a computational system to detect climate change so that the government and farmers know early on the pattern of rain dispersion and other indicators such as temperature, humidity, solar irradiance, and wind speed. One good method of predicting future time series data by analyzing previous data is Artificial Neural Networks [5].
2
A
NNB
ACKP
ROPAGATIONBack Propagation is a supervised learning algorithm and is commonly used by perceptrons with multiple layers to alter the weights connected to the neurons present in the hidden layer [5, 6, and 7]. Back Propagation network training algorithm as follows.
Step 0: Initialize all weights with small random numbers.
Step 1: If the termination condition has not been met, do step 2-9.
Step 2: For each pair of training data, do step 3-8.
Feedfoward (Fhase 1: Step 3-5)
Step 3: Each input unit receives a signal and passes it to a hidden unit above it.
Step 4: Calculate all outputs in hidden units. zj (j=1, 2,..., p).
j net z j j n i ji i j j e net z f z v x v net z _ 1 0 1 1 ) _ ( _
Step 5: Calculate all network outputs in the output unit yk, (k=1, 2,..., m).
k net y k k p j kj j i k e net y f y w z w net y _ 1 0 1 1 ) _ ( _
Back Propagation of Error (Fhase 2: Step 6-7)
Step 6: Calculate factor δ unit output (output) based on error
in each output unit
yk (k=1, 2,..., m).
) 1 ( ) ( ) _ ( ' )
(k k k k k k k
k t y f y net t y y y
tk = Target output
δk = Is the unit of error that will be used in the change of screen weight below it.
_____________________________
Syaefudin Suhaedi, Muhammadiyah University of
Mataram, Indonesia,
Evi Febriana, Muhammadiyah University of Mataram,
Indonesia,
Syaharuddin, Muhammadiyah University of Mataram,
Indonesia,
HRP Negara, Islamic University of Mataram,
Indonesia
Calculate the wkj weight change with the rate of understanding α .
) , , 1 , 0 ; , , 2 , 1 (
, k m j p
z
wkj k j
Step 7: Calculate hidden δ unit factors based on errors in each hidden unit
zj (j=1, 2,..., p)
m
k
kj k
j w
net
1
_
Factor δ hidden units
) 1 ( _ ) _ ( '
_ j j j j j
j net f z net net z z
Calculate the weight change rate vji
n i
p j
x
vji j i, 1,2,, , 1,2,,
Changes of Weight and Bias (Fhase 3: Step 8) Step 8: Calculate all weight changes.
The weight change of the line leading to the output unit is: w
kj (baru) = wkj (lama) + Δwkj , (k=1, 2,..., m ; j=0, 1,..., p). The weight change of the line leading to the hidden unit ie: v
ji (baru) = v ji (lama) + Δvji , (j=1, 2,..., p ; i=0, 1,..., n).
Step 9: Testing complete.
3
M
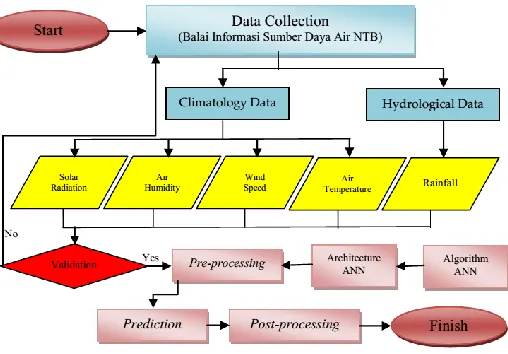
ETHODSStages performed to build ANN Back Propagation computing system as follows:
1. Identify the problem. At this stage the authors collect references related to hydroclimatological data and time series data-time simulation methods using Artificial Neural Network Back Propagation.
2. Collection and Validation Data. At this stage the authors took hydrological data (rainfall) and climatological data (air humidity, temperature, solar radiation, and wind speed) from Water Resources Information Office (BISDA) NTB Public Works Department from 1986 to 2016 for Central Lombok At the post of Keruak and Kopang, then validated.
3. Design, Implementation, and Prediction. At this stage, the authors designed the algorithm and architecture of ANN Back Propagation numerically and implemented it using GUI of Matlab to determine the prediction result of hydroclimatology data in 2017 and 2018.
4. Analysis and Discussion. At this stage, the authors performs data analysis and discusses the prediction result by ANN Back Propagation.
Fig. 1. Prosedur Pengembangan Aplikasi
4
R
ESULT4.1
4.2 Collection and Validation Data
Data that has been collected ie data from 1987 to 2016 validated before the data entered into the network to make predictions. A formula for data repair if there is missing data (unallocated data) on a post with the formula below.
n
i i n
i i i
x
L L p
p
1 2 1
2
1
(1)
In this study, the data is assumed to be valid, since it has been validated by the computational team in BISDA NTB.
4.3 Data Setting for Training, Testing, and Validation The input data in this research are (1) rainfall data, (2) temperature data, (3) air humidity data, (4) wind speed data, and (5) solar radiation data. These five data are semi-monthly (15 days) for 30 years and each data will be predicted using ANN Back Propagation.
TABLE 1: SETTING OF INPUT DATA SETUP FOR
PREDICTION
Years Data
Jan I Jan II Feb I Feb II … Des I Des II
1987 x1 x2 x3 x4 ... x23 x24
1988 x25 x26 x27 x28 ... x47 x48
1989 x47 x48 x49 x50 ... x71 x72
… ... ... ... ... ... ... ...
2016 x696 x697 x698 x699 ... x719 x720
From Table 1 above, it is assumed that y11987 ,
, 1988
2
y y3 1989 ,..., y30 2016 that will be used for forecasting. Since forecasting in 2017 (
31
y ), caused by
30 3 2
1,y ,y ..., x
y , then mathematically can be formulated: y31 caused by y1,y2,y3 ..., y30, or x721,x722,..., x744 caused by
..., , , ,x x x
112 validation and prediction process are presented in Table 2
below.
TABLE 2: SETTING INPUT AND TARGET DATA
Data Process
Validation Prediction 2017 Prediction 2018 Years 1987 – 2015 1987 – 2016 1987 – 2017 Amount 696 data 720 data 744 data Input
695 3 2 1,x ,x,..., x
x x1,x2,x3,..., x719 x1,x2,x3,..., x743
Target
696 27 26 25,x ,x ,..., x
x x25,x26,x27,..., x720 x25,x26,x27,..., x744
Prediction -
744 722 721,x , ..., x
x x745,x746,..., x768
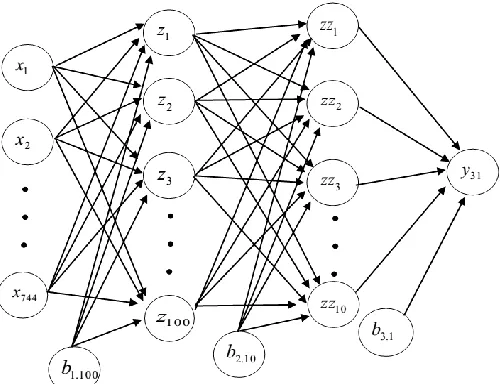
The design of Back Propagation ANN architecture is done to determine the best architecture by setting certain parameters which will be used as algorithm for prediction through training and data testing. The architectural parameters that researchers use in this study according to Table 3 below.
TABEL 3: SETTING THE BACK PROPAGATION
PARAMETERS
Parameters Atributs Size / type
Amount of Neuron
Input layer 744
Hidden layer 1 100 Hidden layer 2 10
Output layer 1
Training Algorithm Trainrp Activation function Sigmoid Biner
Setting of Parameters
Max Epoch 10000
Error (Goal) 0,0001 Learning Rate 0,07
Momentum 0,9
Decrease Ratio 0,7
Raise Ratio 1,05
The architecture used in this study for data prediction in 2017 and 2018 is shown in Figure 2 below.
Fig. 2. Architecture ANN Back Propagation with Two Hidden
Layer
The designed architecture is then simulated using GUI of Matlab which has been built before and evaluated by percentage value of its accuracy with the following formula.
% 100
R Q
P (2)
The simulation results for hydrological training data obtained an average accuracy rate of 96.61% and climatology training data obtained an average accuracy rate reached 96.32%. While the accuracy level for testing hydrological data on average reaches 95.72% and the accuracy level for testing of climatology data reaches on average 96.19%.
4.4 Architectural Validation
Validation is done to see the level of validity and prediction results using the architecture that has been designed. Validation is done by predicting data of 2016 using data from 1987-2015. Then the predicted results are compared with the actual data of 2016 to see the large percentage of errors (errors) of the predicted results that have been obtained with the following formula.
% 100
1 1
n
i i n
i i i
O n
O P
G
(3)
Where i
P the results predicted in 2016 and Oi actual data in
2016. The smaller the resulting error the better the architecture used. From the simulation results obtained a large percentage of architectural errors in each data type as presented in Table 4 below.
TABLE 4: PREDICTION ERROR ARCHITECTURE VALUE
Data Type Accuracy Error Percentage
Rainfall 99,73 % 2,78 %
Temperature 99,63 % 0,20 %
Humidity 99,78 % 0,45 %
Wind Speed 99,90 % 1,45 %
Solar Radiation 99,77 % 0,74 %
Average 99,76 % 1,12 %
From Table 4 above, it can be seen that the average error of predicted results using a design architecture of 1.12% This proves that the architecture is good for prediction with an average accuracy of 99.76%. Then using the validated architecture is predicted hydroclimatological data from 1987-2016 for 2017, and data from 1987-2017 for 2018. Prediction is done on semi-hydrological climatology data in half-monthly size (15 days). From the predicted results then determined the average of each area of Rainfall and Climatology Post.
4.5 Prediction Results
Fig. 3. Rainfall 2017 and 2018 in Central Lombok, Indonesia.
From the prediction result, it is known that Central Lombok in 2017 has average temperature 27,05oC, air humidity 80.38%, wind speed 57.97 m/s, and solar radiation 54.70%. Meanwhile, according to the prediction in 2018 it is known that Central Lombok has an average temperature of 26.53oC, air humidity 82.22%, wind speed 62.20 m/s, and solar radiation 53.46%.
Fig. 4. Air Temperature 2017 and 2018 in Central Lombok,
Indonesia.
Fig. 5. Wind Speed 2017 and 2018 in Central Lombok,
Indonesia.
Fig. 6. Air Humidity 2017 and 2018 in Central Lombok,
Indonesia.
Fig. 7. Solar Radiation 2017 and 2018 in Central Lombok,
Indonesia.
5
C
ONCLUSIONBased on the simulation and calculation results obtained some conclusions as follows:
1. Artificial neural network with Back Propagation method able to predict hydroclimatological data consisting of rainfall data, temperature data, air humidity data, wind speed data, and solar irradiation data with accuracy of 95.72% - 96.61% for data training and testing. While the prediction validation test obtained the average average percentage error is 1.12% with an average accuracy of 99.76%.
2. Algorithm and architecture is very good and can be used in the next process of calculating the needs of water crops and optimization of the calculation of maximum profits from the crops of farmers.
A
CKNOWLEDGMENT114
R
EFERENCES[1] A. Raj, A. Upadhyay, and V. Nakhate, ―Software Testing and Defect Analysis Using Soft Computing Concepts‖, International Journal of Scientific & Technology Research, vol. 6, no. 6, pp. 210-215, June 2017.
[2] Direktorat Jendral Departemen Pekerjaan Umum. Standar Perencanaan Irigasi-Kriteria Perencanaan 01, Badan Penerbit Departemen Pekerjaan Umum, Jakarta, 1986.
[3] Fausett, L, Fundamentals of Neural Network, Prentice Hall, New York, 1994.
[4] H. A. R. Akkar, and F. R. Mahdi, ―Evolutionary Algorithms for Neural Networks Binary and Real Data Classification‖, International Journal of Scientific & Technology Research, vol. 5, no. 7, pp. 55-60, July 2016.
[5] Herbert, Riza, L. S, and Mukmin, A., "Penerapan Jaringan Saraf Tiruan Backpropagation Untuk Peramalan Curah Hujan‖, Teknologi Informasi dan Komunikasi, Vol 1, No. 1, pp. 1-5, 2011.
[6] M. A. M. Mohammad, S. K. Biswas, M. C. Urmi, and A. Siddique, ―An Algorithm For Training Multilayer Perceptron (MLP) For Image Reconstruction Using Neural Network Without Overfitting‖, International Journal Of Scientific & Technology Research, vol. 4, no. 2, pp. 271-275, February 2015.
[7] M. Abdullah-al-mamun, and M. Ahmed, ―Hypothetical Pattern Recognition Design Using Multi-Layer Perceptorn Neural Network For Supervised Learning‖, International Journal Of Scientific & Technology Research, vol. 4, no. 12, pp. 97-102, December 2015.
[8] N. M. Nawi., et al., ―The Effect of Pre-Processing Techniques and Optimal Parameters selection on Back Propagation Neural Networks. Internasional Journal On Advance Science Engineering Information Technology, vol. 7, no. 3, pp. 770-777, 2017.
[9] N. A. Harun., ―The Application of Apriori Algorithm in Predicting Flood Areas. Internasional Journal On Advance Science Engineering Information Technology, vol. 7, no. 3, pp. 763-769, 2017.
[10]Sektor Pertanian, Kajian Risiko dan Adaptasi Terhadap Perubahan Iklim Pulau Lombok Provinsi Nusa Tenggara Barat, Dinas Pertanian NTB, Mataram, 2011.