R E S E A R C H
Open Access
Large scale analysis of positional effects of
single-base mismatches on microarray gene
expression data
Fenghai Duan
1*, Mark A Pauley
2, Eliot R Spindel
3, Li Zhang
4, Robert B Norgren Jr
5** Correspondence: fduan@stat. brown.edu; [email protected]
1Center for Statistical Sciences,
Brown University, Providence, RI, USA
5Department of Genetics, Cell
Biology and Anatomy, University of Nebraska Medical Center, Omaha, NE, USA
Abstract
Background:Affymetrix GeneChips utilize 25-mer oligonucleotides probes linked to a silica surface to detect targets in solution. Mismatches due to single nucleotide polymorphisms (SNPs) can affect the hybridization between probes and targets. Previous research has indicated that binding between probes and targets strongly depends on the positions of these mismatches. However, there has been substantial variability in the effect of mismatch type across studies.
Methods:By taking advantage of naturally occurring mismatches between rhesus macaque transcripts and human probes from the Affymetrix U133 Plus 2 GeneChip, we collected the largest 25-mer probes dataset with single-base mismatches at each of the 25 positions on the probe ever used in this type of analysis.
Results:A mismatch at the center of a probe led to a greater loss in signal intensity than a mismatch at the ends of the probe, regardless of the mismatch type. There was a slight asymmetry between the ends of a probe: effects of mismatches at the 3’ end of a probe were greater than those at the 5’ end. A cross study comparison of the effect of mismatch types revealed that results were not in good agreement among different reports. However, if the mismatch types were consolidated to purine or pyrimidine mismatches, cross study conclusions could be generated.
Conclusion:The comprehensive assessment of the effects of single-base mismatches on microarrays provided in this report can be useful for improving future versions of microarray platform design and the corresponding data analysis algorithms.
Introduction
High-density microarrays have revolutionized biomedical research by providing com-prehensive profiling of DNA and RNA molecules extracted from normal and diseased cells and tissues [1]. The Affymetrix GeneChip is one of the most frequently used microarray platforms for gene expression and genotyping assays [1,2]. For gene expres-sion assays, each transcript is assessed by a set of 25-mer oligonucleotides probe pairs, a Perfect Match (PM) probe and a Mismatch (MM) probe; the difference between the PM probe signals and MM probe signals are used to estimate gene expression levels. In genotyping assays, PM/MM probe pairs are used to determine SNP calls. The MM probe is identical to the PM with the exception that there is a mismatch nucleotide at position 13, i.e., the center position of the probe http://www.affymetrix.com. Upon binding to the targeted molecule, the mismatch is expected to cause a disruption
around position 13 and destabilize the binding. Consequently, a MM probe should yield less signals than the corresponding PM probe. MM probes were designed to mea-sure nonspecific binding and background noise. However, the observed MM probe sig-nals are sometimes substantially higher than the corresponding PM probe sigsig-nals, which is unexpected from microarray design [3,4]. Clearly, it is important to assess the effects of mismatches on probe signal intensity and the subsequent consequences in the interpretation of the microarray data. There have been several previous studies focused on the issue [5-11], which revealed that the hybridizations on microarrays are much more complicated than hybridization in solution. It was found that the mismatch effects may depend on the mismatch types, the positions on the probe, florescent labels and off-target hybridizations. The exact mechanisms remain unclear. Clearly, more data is necessary to understand the effects of mismatches on miocrarrays.
In this study, we hybridized rhesus macaque mRNA samples with arrays designed for the human genome (Human Genome U133 Plus 2 [Affymetrix, Inc., California]) and with arrays designed for the rhesus genome (Rhesus GeneChip [Affymetrix]). By com-paring species differences in target sequences, we were able to examine the effects of a large number of mismatches (15,800) between target and probe on signal intensity. Moreover, the mismatch positions in our dataset are not limited to the center of the probes, which allowed us to perform the most in-depth analysis done to date of the effect of mismatches at each of the 25 probe positions.
Materials and methods
Microarray Data
Rhesus macaque RNA samples from five sources (immortalized fibroblast, cerebral cor-tex, pancreas, testes and thymus) were equally divided into two sets of aliquots. Sam-ples from each of the five sources were labeled and hybridized with either two Rhesus Macaque Genome microarrays (Affymetrix) or two Affymetrix human genome micro-arrays (HGU133plus2.0) according to the manufacturer’s instructions. Thus, a total of 10 rhesus and 10 human microarrays were processed. See Duan et al. 2007 for further details [12].
Affymetrix GeneChip Preprocessing
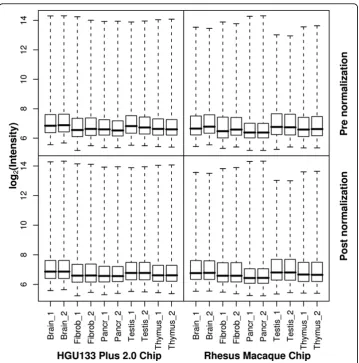
The .CEL files were exported and raw PM intensities were extracted for the 20 arrays. Quantile normalization was applied within two array replicates to control for variation in hybridizations (Figure 1). The raw data (20 .CEL files) have been uploaded to the GEO repository [13] (GEO accession no. GSE9531).
Identifying Single Base-Pair Mismatches between Human and Rhesus Probes
for which the probes did not align sequentially with the consensus sequence and those for which the alignment was incomplete were discarded. Step 4: 15,800 HGU133-plus2.0 probes (from approximately 12,500 probesets) for which there was a single mis-match between the HGU133Plus2 probe and the rhesus consensus sequence in each of positions 1 to 25 were identified via database queries. These probes were used as MM probes in the MM to PM comparison that followed. Step 5: The matchprobespackage in Bioconductor was used to search for the rhesus probe sequences that corresponded to the human probes identified in Step 4 [14]. The probes identified in this way were used as PM probes in the MM to PM comparison. Thematchprobespackage was also used to identify a set of 36,578 probes (from approximately 22,000 probesets) that were identical on the human and rhesus microarrays for use as controls.
Statistical Analysis
The log-scaled ratios of PM and MMisignals, i.e., log2(PM/MMi) where iis the posi-tion of the single-base-pair mismatch, were used to represent the differences of the sig-nal intensities between PM and MMiprobes. In other words, log2(PM/MMi) represents
the discrimination of PM and MM at the ith position [11]. For each tissue (or cell line), log2(PM/MMi) was calculated as the mean value from the two replicates. The average of log2(PM/MMi) over each tissue (or cell line) was obtained by applying a one-way ANOVA to each probe with the variables of Tissue(five levels, representing the five sources of RNA described in the “Microarray Data”section) and Chip (two levels, representing PM and MMi).
To examine the effect of different types of mismatches at different mismatch posi-tions, the estimates of log2(PM/MMi) from the last step were categorized according to mismatch type and mismatch position. Mismatch type was named so that the first let-ter denotes the base in PM and the second letlet-ter denotes the base in MM. The 25 mismatch positions were binned into 3 groups: the left group had mismatches in posi-tions 1 to 8, denoted as the 5’end of a probe; the center group had mismatches in positions 9 to 17 and the right group had mismatches in positions 18 to 25, denoted as the 3’end of a probe. The statistical significance was assessed with Student’s t-test.
Results
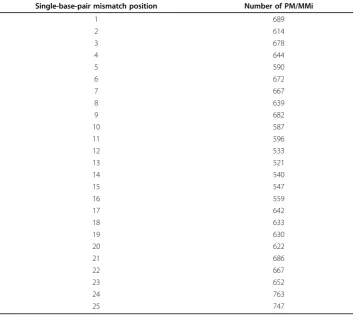
We searched for pairs of probes that differed by a single nucleotide on the human U133Plus2 array and the rhesus macaque GeneChip. 15,800 such probe pairs were found. Table 1 shows the frequency of probes with mismatches at different positions. At least 500 probe pairs were found for each of the 25 positions. In general, there were fewer mismatch probes in the center positions than in the 5’and 3’ends. Position 13 had the fewest number of mismatch probes.
Table 1 Frequency of probe pairs for each mismatch position.
Single-base-pair mismatch position Number of PM/MMi
1 689
2 614
3 678
4 644
5 590
6 672
7 667
8 639
9 682
10 587
11 596
12 533
13 521
14 540
15 547
16 559
17 642
18 633
19 630
20 622
21 686
22 667
23 652
24 763
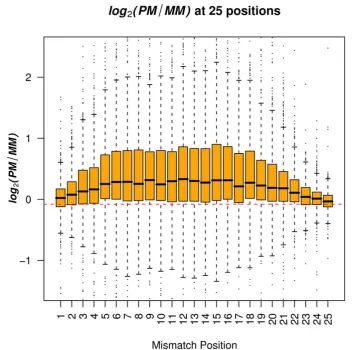
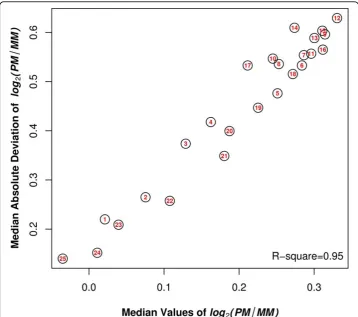
The average difference between PM and MM depended on the position of the mis-match on the probe. Both the average and variability (represented by the interquantile range) of log2(PM/MMi) increased from both ends of the probes (positions 1 and 25) towards the center, and became relatively steady between positions 7 - 16 (Figure 2). The peak value of the average of log2(PM/MMi) was reached wheniwas equal to 12. For example, there was a 24% decrease in the value of PM/MM when the position changed from 12 to 1, and a 29% decrease in the value of PM/MM when the position changed from 12 to 25. In addition, we observed a strong linear association between the average and the variability of log2(PM/MMi)(R2 = 0.95) (Figure 3).
Because the PM signals and MM signals were collected from different arrays, it is possible that the difference between the signals resulted in part from different hybridi-zation conditions on the two types of array. To test this, we compared signals from probes that matched perfectly between the human array and the macaque array. As expected, the average differences were very small as compared to values obtained from log2(PM/MMi) across 25 probe positions (Figure 2). The p values from Student’s t-tests comparing log2(PM/MMi) with the signal differences of identical probe pairs between human and monkey microarrays were extremely small (<10-6).
Figure 2Distribution of log2(PM/MMi) across 25 single-base-pair mismatch positions. The red
dashed line represents the mean value of log2(PM/MMi) when there was no mismatch, i.e., the common
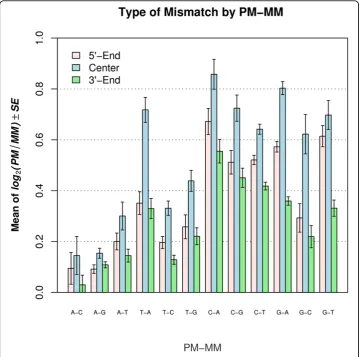
We found that mismatch type also had a strong effect on signal intensity. The great-est effects were observed with C ® A (i.e., C on PM and A on MM; correspondingly G on target), G® A and C®G. The least effects were observed with A ® C, A® G and A ® T (Figure 4). In general, mismatching in a C-G base pair resulted in greater loss of intensity than when mismatching occurred in an A-T base pair.
To determine whether different types of nucleotide mismatches differ significantly across mismatch positions, the mean level of log2(PM/MM) was calculated and graphed for different categories according to mismatch type and mismatch position classification (Figure 4). Note that the subscript from MMi was removed because the mismatch positions were binned into groups. The signal intensity difference between PM and MM was represented by the average of log2(PM/MM). This difference was always greater for the center group (positions 9 - 17) than either the 5’end (positions 1 - 8) or the 3’ end (positions 18 - 25). On average, the discrimination between PM and MM for the center group was 13% higher than for the 5’ end group and 17% higher than for the 3’end group. In addition, the value of log2(PM/MM) in the 5’end was greater, with the exception of C-A, than the 3’end. The differences between the center group and the other two groups were statistically significant in most cases
Figure 3Average of log2(PM/MMi) versus the variability of log2(PM/MMi) across 25 mismatch positions. The values of the median and the median absolute deviation (MAD) of log2(PM/MMi),
Figure 4Mean level of log2(PM/MMi) for 3 groups of mismatch positions for each mismatch type.
The x-axis denotes the 12 mismatch types. The first nucleotide represents the rhesus probe (PM) and the second nucletotide represents the human probe (MM).
Table 2 Student’s t-tests between 3 groups of mismatch positions for each mismatch type.
Mismatch type Center vs. 5’-end Center vs. 3’-end 5’-end vs. 3’-end Frequency
A-C 0.00187 0.000128 0.525* 673
A-G 6.29E-05 6.78E-10 0.0423 2567
A-T 2.78E-08 8.31E-10 0.747* 553
T-A 0.0821* 0.00499 0.328* 506
T-C 0.00733 0.047 0.461* 2920
T-G 0.553* 0.185* 0.422* 435
C-A 0.187* 2.54E-09 1.89E-06 778
C-G 0.000115 3.10E-06 0.377* 627
C-T 1.47E-14 2.13E-46 1.66E-12 2874
G-A 2.17E-06 8.23E-19 6.08E-05 2624
G-C 0.00103 2.76E-05 0.339* 687
G-T 0.0126 5.62E-05 0.103* 556
(Table 2). Only 3 out of 24 comparisons had p values larger than 0.05 (Table 3). How-ever, there were 8 of 12 comparisons with p value larger than 0.05 when the 5’end was compared to the 3’end (Table 2).
Discussion
We took advantage of the differences between the human and the rhesus macaque genomes to evaluate the effects of mismatches between targets and probes on signal intensity in expression arrays using the largest dataset studied thus far. In a previous study, the positional effect of single base mismatches collected data from 935 pairs of perfect match and mismatch probes were examined [11]. Our study utilized data from 15,800 pairs of perfect match and mismatch probes.
Nonrandom Number of Mismatch Probes by Position
We expected to find approximately the same number of mismatches between human probes and rhesus sequences at all 25 mismatch positions. However, there was a gen-eral tendency for fewer mismatch probes at central positions than at the 5’ and 3’ ends. Interestingly, we found the fewest mismatches between human probes and mon-key sequence at position 13. The explanation for this result is not obvious. One possi-bility is that the human probes were selected by Affymetrix to have fewer mismatches in central regions due to human SNPs. This preference for relatively conserved regions may have resulted in fewer probes with mismatches to rhesus sequence in this central region.
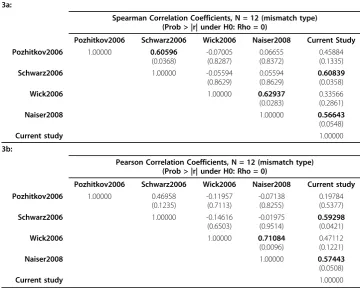
Table 3 Similarities across different studies in terms of the effect of mismatch type.
3a:
Spearman Correlation Coefficients, N = 12 (mismatch type) (Prob > |r| under H0: Rho = 0)
Pozhitkov2006 Schwarz2006 Wick2006 Naiser2008 Current Study Pozhitkov2006 1.00000 0.60596
(0.0368) -0.07005 (0.8287) 0.06655 (0.8372) 0.45884 (0.1335)
Schwarz2006 1.00000 -0.05594
(0.8629)
0.05594 (0.8629)
0.60839
(0.0358)
Wick2006 1.00000 0.62937
(0.0283)
0.33566 (0.2861)
Naiser2008 1.00000 0.56643
(0.0548)
Current study 1.00000
3b:
Pearson Correlation Coefficients, N = 12 (mismatch type) (Prob > |r| under H0: Rho = 0)
Pozhitkov2006 Schwarz2006 Wick2006 Naiser2008 Current study Pozhitkov2006 1.00000 0.46958
(0.1235) -0.11957 (0.7113) -0.07138 (0.8255) 0.19784 (0.5377)
Schwarz2006 1.00000 -0.14616
(0.6503)
-0.01975 (0.9514)
0.59298
(0.0421)
Wick2006 1.00000 0.71084
(0.0096)
0.47112 (0.1221)
Naiser2008 1.00000 0.57443
(0.0508)
Current study 1.00000
Mismatch Positional Effects
We found a mismatch at the center of a probe resulted in a greater loss in signal intensity than a mismatch at the ends of the probe. Various studies reported similar results [5-7,11]. This may be due to the zippering effect, as discussed by Binder [15] and Deutsch et al [16]. The probability of“open”base-pairings may be minimal in the center of an oligonucleotide, on average, and thus the discriminating effect of the cen-tral bases may be maximal.
We also observed a slight asymmetry between the ends of a probe: the effects of mis-matches at the 5’ end of a probe were greater than those at the 3’ end. This may be due to the fact that the probes on the Affymetrix microarrays are anchored to the silica surface at the 3’end of the probe. Thus, our result is consistent with Wick et al.’s finding that mismatches at the loose end are more discriminating than mismatches at the attached end.
Our results also suggested that the stronger the mismatch effect, the more variable the effect. In Figure 3, we showed that the value of log2(PM/MMi) is closely correlated with the median absolute deviation value of log2(PM/MMi). This may be because when the mismatch is strongly disruptive of the binding interaction on the probe, the adja-cent nucleotides will have to accommodate the disruption. Thus, certain combinations of nucleotides may be more accommodating than others, leading to more variation in the free energy of binding for the more disruptive mismatch types.
Mismatch Type Effects
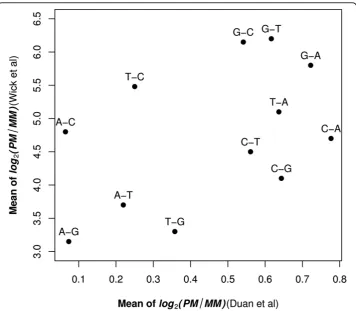
The role of the probe mismatch type on signal intensity has been previously investi-gated [6,7,9-11]. Among these studies, Wick et al’s report (2006) and our analysis used the same statistic - log2(PM/MM) - to measure the discriminating ability of PM and MM. The biggest difference between our results and Wick et al’s was the magnitude of PM/MM (Figure 5). On average, Wick et al’s reported a 20-fold greater effect than was observed in the current study. This likely reflects the fact that the length of the probe was 18 oligonucleotides in Wick et al’s report and 25 oligonucleotides in our study because different arrays were used in the two studies.
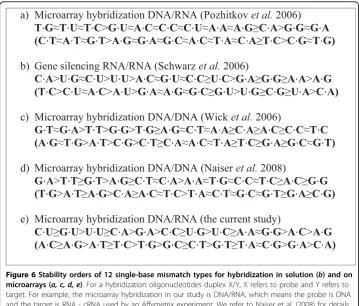
We expanded the cross-study comparison of the effect of mismatch type [6] by including the current study (Figure 6). In addition, we quantified the similarities across different studies in terms of the effect of mismatch type (Table 3). We did not include the results of Sugimoto et al (2000) for two reasons: 1. their results were mainly sum-marized from the analyses of certain trinucleotide stabilities; 2. there was no C-C mis-match type in their study, which would result in a missing value for our comparison. There are several interesting results from this cross-study comparison.
mismatch types, our study agreed very well with Naiser et al’s (2008). When a mis-match occurred to the C-G base pair, a greater loss in signal intensity was observed (Figure 6). However, each of our studies had an outlier, defined as a mismatch type whose real positions are different from expected according to the rules of Watson-Crick base-pairing. Specifically, positions 1 to 6 on the stability list should belong to the mismatch types whose mismatch occurs to the A-T base pair, and positions 7-12 should belong to the mismatch types whose mismatch occurs to the C-G base pair. Naiser et al (2008) reported an A-G mismatch values at a higher position - position 4 - on the stability list than expected, which should have been placed at positions lar-ger than the 6th. Results from the current study indicated a A-A mismatch values at a lower position - position 9 - on the stability list than expected, which should have been placed at positions smaller or equal to the 6th. The difference between two stu-dies may be due to the differences in the detailed hybridization conditions and the dif-ferent microarray platforms used in the two studies — Naiser et al (2008) designed their own technology for fabricating the chip of microarray while we used the standard Affymetrix GeneChip.
Because both Wick et al (2006) and our study used the same metric - log2(PM/MM) -to measure the discriminating ability - opposite -to duplex stability. We want -to further elaborate the comparison between two studies. Our results were in partial agreement with Wick et al. (Pearson’s correlation: 0.47) (Figure 5). We found that, in general,
samples with mismatches with probes where the sample is either an A or T had smaller decreases in signal intensity than when the sample contained a G or C which was mis-matched with the probe as would be expected from Watson-Crick base-pairing. Wick et al. found that a sample with a C that mismatched the probe had a much greater decrease in signal intensity as compared to a sample with a G that mismatched the probe (the dif-ference in the central region is about three-fold). In contrast, we found no major differ-ence in the amount of the decrease in signal intensity when the mismatch was between a C in the sample or a G in the sample and the probe (they only differ by about 2% in the central region) (Figure 4). It is not clear what caused the discrepancies between our study and Wick et al.’s study. Wick et al.’s results are in good agreement with values of solution studies with nearest neighbor model [17]. However, it has been reported that the stacking free energies on Affymetrix arrays are different from that in solution [4,18]. But there was also study showing a good agreement between the solution nearest-neigh-bor(NN) affinities and that on Affymetrix arrays [19]. Further experimentation might resolve these differences.
In general, it appears that mismatch type is more sensitive to different experimental methods than mismatch position. Microarrays produced in different ways may have
a) Microarray hybridization DNA/RNA (Pozhitkov
et al.
2006)
T G
≈
T U
≈
T C
>
G U
≈
A C
≈
C C
≈
C U
≈
A A
≈
A G
≥
C A
>
G G
≈
G A
(C T
≈
A T
≈
G T
>
A G
≈
G A
≈
G C
≈
A C
≈
T A
≈
C A
≥
T C
>
C G
≈
T G)
b) Gene silencing RNA/RNA (Schwarz
et al.
2006)
C A
>
U G
≈
C U
>
U U
>
A C
≈
G U
≈
C C
≥
U C
>
G A
≥
G G
≥
A A
>
A G
(T C
>
C U
≈
A C
>
A U
>
G A
≈
A G
≈
G C
≥
G U
>
U G
≥
C G
≥
U A
>
C A)
c) Microarray hybridization DNA/DNA (Wick
et al.
2006)
G T
≈
G A
>
T T
>
G G
>
T G
≥
A G
≈
C T
≈
A A
≥
C A
≥
A C
≥
C C
≈
T C
(A G
≈
T G
>
A T
>
C G
>
C T
≥
C A
≈
A C
≈
T A
≥
T C
≥
G A
≥
G C
≈
G T)
d) Microarray hybridization DNA/DNA (Naiser
et al.
2008)
G A
>
T T
≥
G T
>
A G
≥
C T
≈
C A
>
A A
≈
T G
≈
C C
≈
T C
≥
A C
≥
G G
(T G
>
A T
≥
A G
>
C A
≥
A C
≈
T C
>
T A
≈
C T
≈
G C
≈
G T
≥
G A
≥
C G)
e) Microarray hybridization DNA/RNA (the current study)
C U
≥
G U
>
U U
≥
C A
>
G A
>
C C
≥
U G
>
U C
≥
A A
≈
G G
>
A C
>
A G
(A C
≥
A G
>
A T
≥
T C
>
T G
>
G C
≥
C T
>
G T
≥
T A
≈
C G
>
G A
>
C A)
Figure 6Stability orders of 12 single-base mismatch types for hybridization in solution (b) and on microarrays (a, c, d, e). For a hybridization oligonucleotides duplex X/Y, X refers to probe and Y refers to target. For example, the microarray hybridization in our study is DNA/RNA, which means the probe is DNA and the target is RNA - cRNA used by an Affymetrix experiment. We refer to Naiser et al. (2008) for details. Specifically, both Wick et al (2006) and our study used log2(PM/MM) as the measure of discriminating
ability, which has an opposite order compared to stability. Thus, the larger log2(PM/MM) value corresponds
different spatial features that complicate specific types of mismatched base pairing. This may be because mismatch type depends on many different experimental factors, e.g., solid substrate or solution, DNA or RNA (either probe or target) and the length of probe.
Practical Implementation of Our Analyses to Microarray Design
Our results may be useful for improving future versions of microarray platform design, especially those which involve the single-base mismatches such as the Affymetrix Gen-eChip. On the one hand, these results showed that mismatch position effect is rela-tively insensitive to experimental methods, which supports Affymetrix’s decision to choose the 13th position when designing PM/MM probe pairs, (although our results showed that the position 12thmay cause a slightly bigger loss of signal intensity in mis-matches) (Figure 2 &3). On the other hand, the results from different studies showed that mismatch type is more sensitive to experimental methods, implying that Affyme-trix may improve the array’s design by incorporating these results. For instance, Affy-metrix typically uses a number of probe pairs to represent a probeset, e.g., 11 probe pairs for a gene on Human Genome U133 Plus 2.0 Array. Each probe pairs contains a mismatch probe which alters its 13thposition compared to a perfect matched probe. These 11 mismatched bases may not necessarily be the same mismatch type. In fact, they very likely belong to different mismatch types. We found that when the experi-mental method changes, the effects of mismatch type may also change, indicating there may be some unpredictable uncertainty when summarizing the intensities of these 11 probe pairs. Our results may help Affymetrix minimize this type of uncer-tainty by incorporating the mismatch type effect when designing probe pairs. A simple resolution is to select the same mismatch type for all 11 probe pairs.
Correspondingly, our results may also be useful for improving array data processing algorithms, particularly those considering single base effects, such as GC-RMA [20] and PDNN [4].
Conclusion
We evaluated the effects of single-base mismatches on Affymetrix microarrays in a large dataset. We found that a mismatch at the center of a probe incurs a greater loss in signal intensity than the mismatches at the ends of the probe. There was a slight asymmetry between the ends of a probe: effects of mismatches at the 3’end of a probe were greater than those at the 5’end. These results were similar to previous research. The results from studies on mismatch type, including ours, were only weak correlated. Our study agreed very well with a recent study when the comparison was widened to the group effect of purine or pyrimidine mismatch type. Our results, together with that of previous studies, provide a comprehensive assessment of the effects of single-base mismatches on microarrays to date and may be useful for improving future versions of microarray platform design and the corresponding data analysis algorithms.
Funding
Acknowledgements
We thank the ONPRC microarray core for processing the microarrays. We also thank the reviewers of this manuscript for their helfpul suggestions.
Author details
1Center for Statistical Sciences, Brown University, Providence, RI, USA.2College of Information Science & Technology,
University of Nebraska at Omaha, Omaha, NE, USA.3Division of Neuroscience, Oregon National Primate Research
Center, Oregon Health & Science University, Beaverton, OR, USA.4Department of Bioinformatics and Computational Biology, University of Texas MD Anderson Cancer Center, Houston, TX, USA.5Department of Genetics, Cell Biology and
Anatomy, University of Nebraska Medical Center, Omaha, NE, USA.
Authors’contributions
FD designed the method, analyzed the data and drafted the manuscript. MAP helped the data analyses and contributed to the writing of the paper. ERS supervised data collection and contributed to the writing of the paper. LZ contributed to the writing of the paper. RBN organized the project, supervised data collection and contributed to the writing of the paper. All authors have read and approved the final manuscript.
Competing interests
The authors declare that they have no competing interests.
Received: 11 November 2009 Accepted: 29 April 2010 Published: 29 April 2010
References
1. Auer H, Newsom DL, Kornacker K:Expression profiling using Affymetrix GeneChip microarrays.Methods Mol Biol
2009,509:35-46.
2. Lockhart DJ, Dong H, Byrne MC, Follettie MT, Gallo MV, Chee MS, Mittmann M, Wang C, Kobayashi M, Horton H, Brown EL:Expression monitoring by hybridization to high-density oligonucleotide arrays.Nat Biotechnol1996, 14:1675-80.
3. Naef F, Magnasco MO:Solving the riddle of the bright mismatches: labeling and effective binding in oligonucleotide arrays.Phys Rev E Stat Nonlin Soft Matter Phys2003,68:011906.
4. Zhang L, Miles MF, Aldape KD:A model of molecular interactions on short oligonucleotide microarrays.Nat
Biotechnol2003,21:818-21.
5. Cui X, Xu J, Asghar R, Condamine P, Svensson JT, Wanamaker S, Stein N, Roose M, Close TJ:Detecting single-feature polymorphisms using oligonucleotide arrays and robustified projection pursuit.Bioinformatics2005,21:3852-8. 6. Naiser T, Ehler O, Kayser J, Mai T, Michel W, Ott A:Impact of point-mutations on the hybridization affinity of
surface-bound DNA/DNA and RNA/DNA oligonucleotide-duplexes: comparison of single base mismatches and base bulges.BMC Biotechnol2008,8:48.
7. Pozhitkov A, Noble PA, Domazet-Loso T, Nolte AW, Sonnenberg R, Staehler P, Beier M, Tautz D:Tests of rRNA hybridization to microarrays suggest that hybridization characteristics of oligonucleotide probes for species discrimination cannot be predicted.Nucleic Acids Res2006,34:e66.
8. Rostoks N, Borevitz JO, Hedley PE, Russell J, Mudie S, Morris J, Cardle L, Marshall DF, Waugh R:Single-feature polymorphism discovery in the barley transcriptome.Genome Biol2005,6:R54.
9. Schwarz DS, Ding H, Kennington L, Moore JT, Schelter J, Burchard J, Linsley PS, Aronin N, Xu Z, Zamore PD:Designing siRNA that distinguish between genes that differ by a single nucleotide.PLoS Genet2006,2:e140.
10. Sugimoto N, Nakano M, Nakano S:Thermodynamics-structure relationship of single mismatches in RNA/DNA duplexes.Biochemistry2000,39:11270-81.
11. Wick LM, Rouillard JM, Whittam TS, Gulari E, Tiedje JM, Hashsham SA:On-chip non-equilibrium dissociation curves and dissociation rate constants as methods to assess specificity of oligonucleotide probes.Nucleic Acids Res2006, 34:e26.
12. Duan F, Spindel ER, Li YH, Norgren RB Jr:Intercenter reliability and validity of the rhesus macaque GeneChip.BMC
Genomics2007,8:61.
13. Barrett T, Suzek TO, Troup DB, Wilhite SE, Ngau WC, Ledoux P, Rudnev D, Lash AE, Fujibuchi W, Edgar R:NCBI GEO: mining millions of expression profiles–database and tools.Nucleic Acids Res2005,33:D562-6.
14. Huber W, Gentleman R:matchprobes: a Bioconductor package for the sequence-matching of microarray probe elements.Bioinformatics2004,20:1651-2.
15. Binder H:Thermodynamics of competitive surface adsorption on DNA microarrays.Journal of Physics-Condensed
Matter2006,18:S491-S523.
16. Deutsch JM, Liang S, Narayan O:Modeling of microarray data with zippering.Arxiv preprint q-bio/04060392008,1. 17. SantaLucia J Jr:A unified view of polymer, dumbbell, and oligonucleotide DNA nearest-neighbor thermodynamics.
Proc Natl Acad Sci USA1998,95:1460-5.
18. Zhang L, Hurek T, Reinhold-Hurek B:Position of the fluorescent label is a crucial factor determining signal intensity in microarray hybridizations.Nucleic Acids Res2005,33:e166.
19. Binder H, Kirsten T, Hofacker IL, Stadler PF, Loeffler M:Interactions in oligonucleotide hybrid duplexes on microarrays.Journal of Physical Chemistry B2004,108:18015-18025.
20. Wu ZJ, Irizarry RA, Gentleman R, Martinez-Murillo F, Spencer F:A model-based background adjustment for oligonucleotide expression arrays.Journal of the American Statistical Association2004,99:909-917.
doi:10.1186/1756-0381-3-2
Cite this article as:Duanet al.:Large scale analysis of positional effects of single-base mismatches on microarray