Evaluation of Mobile Ad Hoc Network with
Reactive and Proactive Routing Protocols and
Mobility Models
Rohit Kumar
Department of Computer Sc. & Engineering Chandigarh University, Gharuan
Mohali, Punjab
Abstract - Wireless mobile nodes forms dynamically a temporary network without the support of any substantial infrastructure and central manager. Routing protocols in mobile ad hoc network helps mobile to send and receive packets. AODV, DSR (Reactive), and OLSR, DSDV, TORA (Proactive) protocols based on various mobility models [3] such as RPGM, CMM and RWP and to evaluate performance of 5 types of routing protocols (AODV, DSR, OLSR, DSDV and TORA) based on packet delivery ratio, average end to end delay, routing overhead and throughput. We will analyze and compare the performance of reactive and proactive routing protocols under different mobility models using NS-2 simulator in the area of 700 x 700 m2.
I. INTRODUCTION
We will use NS simulator for simulating different routing protocols [1, 2]. NS simulator uses a visual tool called NAM. NAM is a Tcl/TK based animation tool for viewing network simulation traces and real world packet trace data. I am using the topology of 700x700 m2 with 25, 50, 75,100 nodes we are increasing only total number of nodes with keeping the total area constant i.e. 700x700 m2, speed 20 ± 3 m/s , pause time 15 ± 3 s, packet size 512 B, simulation time is 300s and Traffic Node 10, 20 , 40, 60 respectively with 25, 50, 75,100 nodes in the simulation. The effect of mobility on the Packet Delivery Ratio, Average End-to-End delay, Normalized Routing Load and Throughput of the mobile ad-hoc network.
II. PACKET DELIVERY RATIO (PDR)
Packet delivery Ratio (PDR): this is the ratio of total number of packets successfully received by the destination nodes to the number of packets sent by the source nodes throughout the simulation. It also describes the loss rate that of the packets, which in turn affects the maximum throughput that the network can support. PDR is calculated with the help of following formula [3][4][5].
PDR= (Packets Received / Packets Sent)*100
III. AVERAGE END TO END DELAY:
Average end-to-end delay (AED): this is defined as the average delay in transmission of a packet between two nodes and a higher value of end-to-end delay means that the network is congested and hence the routing protocol does not perform well [6][7][8].
IV. NORMALIZED ROUTING LOAD:
This is calculated as the ratio between the numbers of routing Packets transmitted to the number of packets actually received (thus accounting for any dropped packets). The higher the NRL, the higher the overhead of routing packets and consequently the lower the efficiency of the protocol. It is defined as Number of routing packets “transmitted” per data packet “delivered” at destination. Each hop-wise transmission of a routing is counted as one transmission. It is the sum of all control packet sent by all node in network to discover and maintain route [8][9].
Throughput= (number of delivered packet * packet size)/total duration of simulation
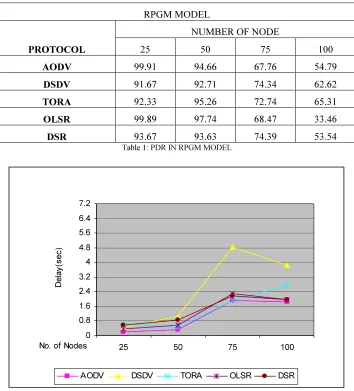
RPGM MODEL
PROTOCOL
NUMBER OF NODE
25 50 75 100
AODV 99.91 94.66 67.76 54.79
DSDV 91.67 92.71 74.34 62.62
TORA 92.33 95.26 72.74 65.31
OLSR 99.89 97.74 68.47 33.46
DSR 93.67 93.63 74.39 53.54
Table 1: PDR IN RPGM MODEL
0 0.8 1.6 2.4 3.2 4 4.8 5.6 6.4 7.2
25 50 75 100
No. of Nodes
D
e
la
y
(s
e
c
)
AODV DSDV TORA OLSR DSR
Figure 1 : PDR IN RPGM MODEL
VI. PERFORMANCE EVOLUTION OF PROTOCOLS WITH PDR IN RPGMMODEL
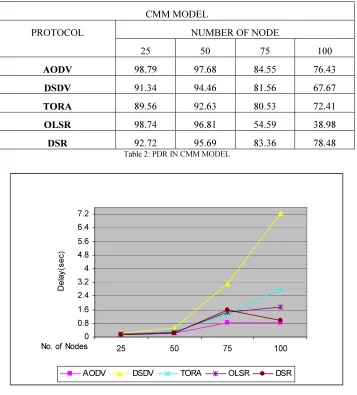
CMM MODEL
PROTOCOL NUMBER OF NODE
25 50 75 100
AODV 98.79 97.68 84.55 76.43
DSDV 91.34 94.46 81.56 67.67
TORA 89.56 92.63 80.53 72.41
OLSR 98.74 96.81 54.59 38.98
DSR 92.72 95.69 83.36 78.48
Table 2: PDR IN CMM MODEL
0 0.8 1.6 2.4 3.2 4 4.8 5.6 6.4 7.2
25 50 75 100
No. of Nodes
D
e
la
y
(s
e
c
)
AODV DSDV TORA OLSR DSR
Figure 2: PDR IN CMM MODEL
VII. PERFORMANCE EVOLUTION OF PROTOCOLS WITH PDR IN CMMMODEL
According to the graph the result shows that DSDV gives the best performance in CMM Model. After that TORA gives better performance than the other protocols in CMM Model [18, 19, 20, 21, and 22].
RWP MODEL
PROTOCOLS
NUMBER OF NODE
25 50 75 100
AODV 97.71 86.42 73.85 64.43
DSDV 81.91 47.82 47.72 14.73
TORA 79.92 34.81 27.87 10.77
OLSR 98.84 30.48 28.38 7.75
DSR 85.76 48.99 19.89 18.45
0 0.8 1.6 2.4 3.2 4 4.8 5.6 6.4 7.2
25 50 75 100
No. of Nodes
D
e
la
y
(s
e
c
)
AODV DSDV TORA OLSR DSR
Figure 3: PDR IN RWP MODEL
VIII.PERFORMANCE EVOLUTION OF PROTOCOLS WITH PDR IN RWPMODEL
As we are getting the result from graph the best performance is given by the DSDV protocol after that TORA gives better performance than the others protocols because as the no. of nodes increase their performance decreases [23,24].
RPGM MODEL
PROTOCOL
NUMBER OF NODE
25 50 75 100
AODV 1.06 1.11 1.85 2.23
DSDV 1.78 1.78 3.93 6.66
TORA 1.83 1.84 3.99 7.23
OLSR 1.53 1.85 2.35 6.82
DSR 1.17 1.21 6.56 9.76
0 5 10 15 20 25 30 35 40 45
25 50 75 100
No. of Nodes
N
R
L
AODV DSDV TORA OLSR DSR
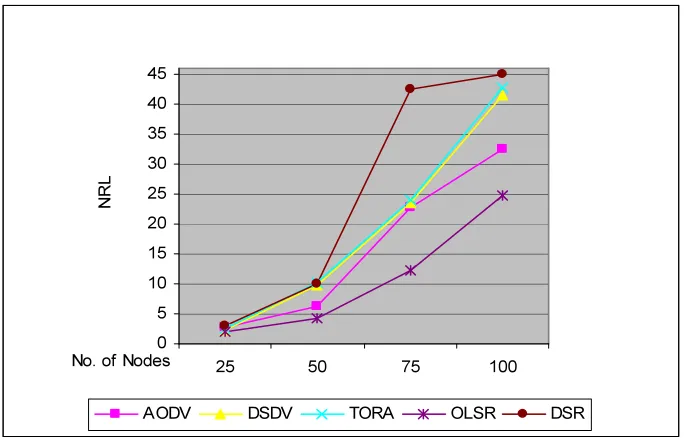
Figure 4: Normalized Routing Load In RPGM Model
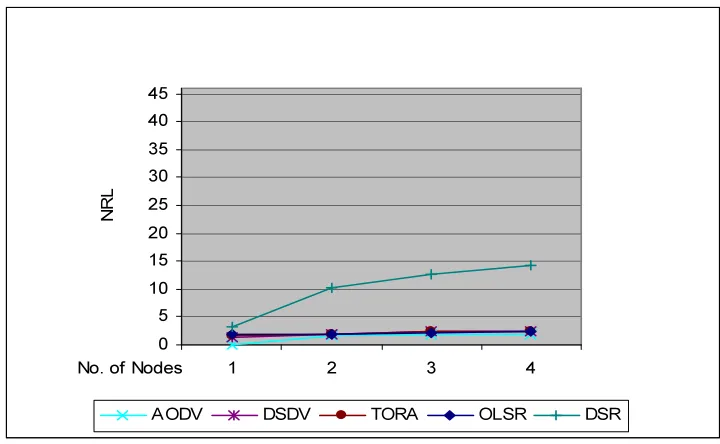
IX. PERFORMANCE EVOLUTION OF PROTOCOLS WITH NORMALIZED ROUTING LOAD IN RPGMMODEL As the result from the above graph As the no. of node increase the NRL is also increased. The maximum NRL is given by the DSR protocol but we are the minimum NRL by OLSR protocol in RPGM Model.
CMM MODEL
PROTOCOL
NUMBER OF NODE
25 50 75 100
AODV 0.08 1.68 1.89 1.99
DSDV 1.46 1.79 2.38 2.37
TORA 1.51 1.84 2.44 2.54
OLSR 1.81 1.79 2.26 2.38
DSR 3.12 10.12 12.58 14.28
0 5 10 15 20 25 30 35 40 45
1 2 3 4
No. of Nodes
N
R
L
AODV DSDV TORA OLSR DSR
Figure 5: Normalized Routing Load In CMM Model
X. PERFORMANCE EVOLUTION OF PROTOCOLS WITH NORMALIZED ROUTING LOAD IN CMMMODEL: In CMM Model the DSR protocols has maximum NRL. But the others protocol has similar performance to each other.
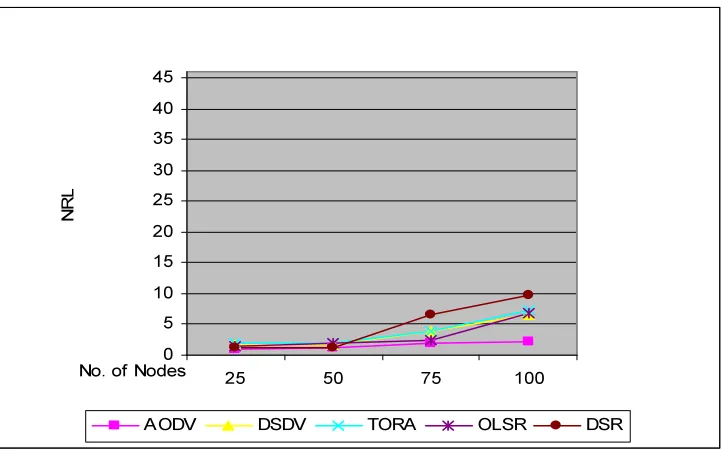
RWP MODEL
PROTOCOLS
NUMBER OF NODE
25 50 75 100
AODV 2.67 6.22 22.76 32.38
DSDV 2.34 9.87 23.46 41.44
TORA 2.46 10.24 24.07 42.82
OLSR 1.98 4.3 12.34 24.75
DSR 3.12 10.12 42.58 44.98
0 5 10 15 20 25 30 35 40 45
25 50 75 100
No. of Nodes
N
R
L
AODV DSDV TORA OLSR DSR
Figure 6: Normalized Routing Load In RWP Model
XI. PERFORMANCE EVOLUTION OF PROTOCOLS WITH NORMALIZED ROUTING LOAD IN RWPMODEL In RWP Model DSR protocols gives maximum NRL. And AODV has minimum NRL and other protocols have similar NRL to each other protocols.
RPGM MODEL
PROTOCOL
NUMBER OF NODE
25 50 75 100
AODV 76.85 74.53 52.93 44.18
DSDV 59.14 63.5 54.26 37.49
TORA 47.83 52.5 31.76 28.15
OLSR 76.83 76.96 53.91 26.98
DSR 60.04 64.57 54.29 31.68
0 20 40 60 80 100
25 50 75 100
No of Nodes
T
h
ro
u
g
h
p
u
t
AODV DSDV TORA OLSR DSR
Figure 7: Throughput In RPGM Model
XII.PERFORMANCE EVOLUTION OF PROTOCOLS WITH THROUGHPUT IN RPGMMODEL
In RPGM Model every protocols has maximum throughput but as the No. of Node increase the throughput decrease. In Short we can say AODV is best in case of PRGM Model and TORA is worst protocols.
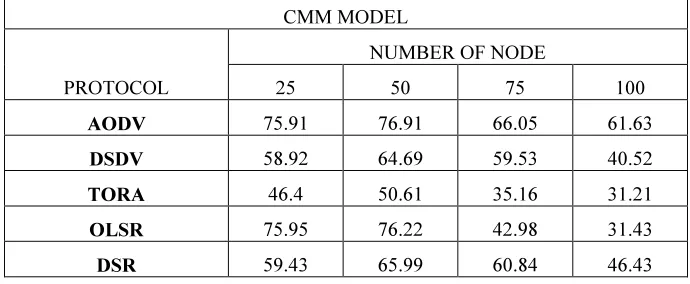
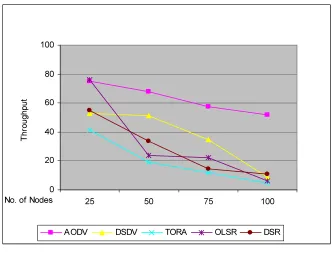
CMM MODEL
PROTOCOL
NUMBER OF NODE
25 50 75 100
AODV 75.91 76.91 66.05 61.63
DSDV 58.92 64.69 59.53 40.52
TORA 46.4 50.61 35.16 31.21
OLSR 75.95 76.22 42.98 31.43
DSR 59.43 65.99 60.84 46.43
0 20 40 60 80 100
25 50 75 100
No. of Nodes
T
h
ro
u
g
h
p
u
t
AODV DSDV TORA OLSR DSR
Figure 8: Throughput in CMM Model
XIII.PERFORMANCE EVOLUTION OF PROTOCOLS WITH THROUGHPUT IN CMMMODEL
In case of CMM model the AODV and OLSR protocols has maximum throughput when the number of node is less but as the No. of node the only AODV gives better performance than the others protocols but TORA has worst performance.
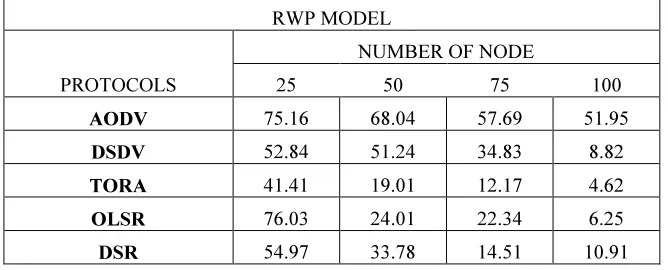
RWP MODEL
PROTOCOLS
NUMBER OF NODE
25 50 75 100
AODV 75.16 68.04 57.69 51.95
DSDV 52.84 51.24 34.83 8.82
TORA 41.41 19.01 12.17 4.62
OLSR 76.03 24.01 22.34 6.25
DSR 54.97 33.78 14.51 10.91
0 20 40 60 80 100
25 50 75 100
No. of Nodes
T
h
ro
u
g
h
p
u
t
AODV DSDV TORA OLSR DSR
Figure 9: Throughput in RWP Model
XIV. PERFORMANCE EVOLUTION OF PROTOCOLS WITH PDRTHROUGHPUT IN RWPMODEL
In case of RWP Model AODV protocol has better performance than the others protocols but as the number of nodes it performance decreases. But TORA gives worst throughput even the No. of node is 25 or 100.
RPGM MODEL
PROTOCOL
NUMBER OF NODE
25 50 75 100
AODV 0.21 0.32 1.91 1.86
DSDV 0.43 1.06 4.82 3.84
TORA 0.64 0.47 1.94 2.76
OLSR 0.36 0.57 2.28 1.98
DSR 0.58 0.84 2.16 1.97
0 0.8 1.6 2.4 3.2 4 4.8 5.6 6.4 7.2
25 50 75 100
No. of Nodes
D
e
la
y
(s
e
c
)
AODV DSDV TORA OLSR DSR
Figure 10: Average End To End Delay In RPGM Model
XV. PERFORMANCE EVOLUTION OF PROTOCOLS WITH PDRAVERAGE END TO END DELAY IN RPGMMODEL In case of RPGM Model the as the No. of node is less every protocols has minimum delay but as the No. of node increase the AODV protocol has minimum delay but DSDV protocols has the maximum delay. TORA has a sharp delay as the No. of node increased.
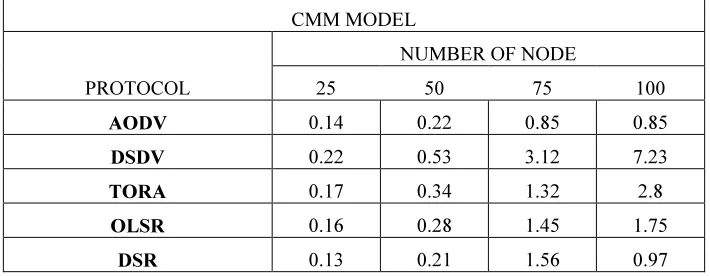
CMM MODEL
PROTOCOL
NUMBER OF NODE
25 50 75 100
AODV 0.14 0.22 0.85 0.85
DSDV 0.22 0.53 3.12 7.23
TORA 0.17 0.34 1.32 2.8
OLSR 0.16 0.28 1.45 1.75
DSR 0.13 0.21 1.56 0.97
0 0.8 1.6 2.4 3.2 4 4.8 5.6 6.4 7.2
25 50 75 100
No. of Nodes
D
e
la
y
(s
e
c
)
AODV DSDV TORA OLSR DSR
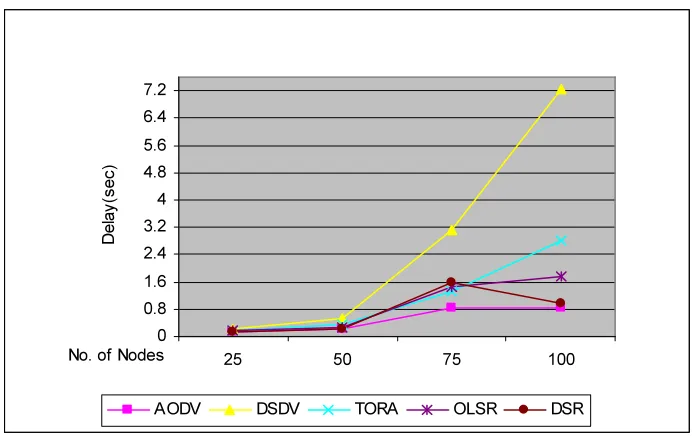
Figure 11: Average End To End Delay In CMM Model
XVI. PERFORMANCE EVOLUTION OF PROTOCOLS WITH PDRAVERAGE END TO END DELAY IN CMMMODEL Like RPGM Model every protocols has minimum delay but when the number of node increase AODV has minimum delay. But DSDV has a sharp delay ratio as the number of nodes increased.
RWP MODEL
PROTOCOLS
NUMBER OF NODE
25 50 75 100
AODV 0.21 1.37 2.08 2.27
DSDV 0.23 2.49 3.95 6.49
TORA 0.58 2.44 2.78 3.04
OLSR 0.59 2.46 3.43 5.83
DSR 0.37 1.57 2.28 2.57
0 0.8 1.6 2.4 3.2 4 4.8 5.6 6.4 7.2
25 50 75 100
No. of Nodes
D e la y (s e c )
AODV DSDV TORA OLSR DSR
Figure 12: Average End To End Delay In RWP Model
XVII. PERFORMANCE EVOLUTION OF PROTOCOLS WITH PDRAVERAGE END TO END DELAY IN RWPMODEL Like RPGM and CMM model in every protocol has minimum delay .But as the number of node increased the delay is also increased. Like other models AODV has minimum delay in RWP Model. And DSDV has maximum delay which gives worst performance in all models.
XVIII. CONCLUSION
After study and analyzing the behavior of Five MANETs routing protocols i.e. AODV, DSDV, DSR, OLSR, TORA under the three mobility models (RPGM,CMM,RWP) And then compare the performance of protocols using NS-2 simulator in the area of 700 x 700 m2 which clearly indicate the significant impact on node mobility pattern has on routing performance, these routing protocols were compared in the manner of Packet delivery ratio (PDR), Average End to End delay (delay), Normalized routing load(NRL) and Throughput when subjected to change in numbers of nodes. Our simulation results show that Reactive protocols is much better than proactive in the manners of packet delivery (PDR), A End-to-End delay(Delay), Normalized routing load(NRD) and throughput . In this paper we look increase the number of nodes has impact on all protocols under these mobility models i.e the degradation varies for different protocols and mobility models. In this research our results is made into how well AODV, DSDV, DSR, OLSR and TORA work to different network conditions in MANET. The delay of OLSR is less and in the DSR is worst. Throughput is high in case of AODV. In DSR delay is greater than the AODV and OLSR. In the terms of packet dropper the DSDV perform better and consistently well with increase number of nodes while the AODV is worst. On the other hand DSR perform better when the numbers of nodes are less but it will fails when the numbers of nodes increase but DSR showed high end to end delay due to formation of temporary loops within the network . TORA is very poor and not reliable for the MANETs. In future, we can evaluate the performance of these five routing protocols under three mobility models by varying it to the speed, pause time.
REFERENCES
[1] R. Kumar et al., SPF: Segmented Processor Framework for Energy Efficient Proactive Routing Based Applications in MANET, Proceedings of IEEE Conference RAECS, pp. 1-6.
[2] Rohit K. Bhullar et al., Cross-Platform Application Development for Smartphones: Approaches and Implications, Proceedings of IEEE Conference, pp. 2571-2577.
[3] Rohit Kumar et. al., Specialized hardware Architecture for Smartphones, Intl. Journal of Engineering Research and Applications, ISSN: 2248-9622, pp.76-80.
[4] Rohit Kumar et al., Smartphones hardware Architectures and Their Issues, International Journal of Engineering Research and Applications, ISSN: 2248-9622, pp.76-80.
[5] Deepinder Kaur. et al., Energy Named Entity Recognition, Extraction and Classification using Conditional Random Field with Kernel Approach, IJEAR, ISSN: 0973-4562,Vol. 10, Issue:15, pp. 38193-38198.
[10] Y.-C. Tseng et al., Power Saving Protocol for IEEE 802.11 based Multi-hop MANET, IEEE , pp. 37-60, (2001).
[11] Shiv K. Verma et al., Hybrid Image Fusion Algorithm using Laplace pyramid and PCA Method” ACM Conference March, pp. 1-6. [12] T.-Y. Hsieh et al., An Architecture for Power-saving Communication in Wireless Mobile Ad-hoc Network Based on Location and Position
Information, Micro-processors and Micro-systems, pp. 457-465, (2004).
[13] Elizabeth M. Belding-Royer et al., Distance Vector (AODV) Routing, IETF Internet draft, draft perkinsmanet aodvbis-OO.txt., pp. 225-234, (2003).
[14] Jean-Pierre Ebert et al., Power Saving Mechanisms in Emerging Standards for Wireless LANs: MAC Layer Perspective, IEEE Personal Communications volume 4, pp.40-48, (1998).
[15] M.E. Steenstrup et al., Distance-Vector Routing, Routing in Comm. Networks, Prentice-Hall, pp. 83-98 (1995).
[16] S. Sisodia et al., Performance Evaluation of a Table Driven and On Demand Routing protocol in Energy Constrained MANETs, Proceedings of IEEE Conference ICCCI, pp. 76-80.
[17] K. Prabhu et. al., Performance Analysis of Modified OLSR Protocol for MANET using ESPR Algorithm, Proceedings of IEEE Conference ICICES, pp.1-5.
[18] L. pawar et. al., Optimized Route Selection On The Basis Of Discontinuity And Energy Consumption In Delay Tolerant Networks, Springer : Advances in Intelligent Systems and Computing, ISSN: 2194-5357, In Press.
[19] Rohit kumar Bhullar et al. Novel Stress Calculation in Parallel Processor Systems Using Buddy Approach with Enhanced Short Term CPU Scheduling, Tailor and Fransis, CRC press, In Press.
[20] M. Kaur et al Stochastic Approach for Energy-Efficient Clustering in WSN”, Global Journal of Computer Science and Technology, Vol. 14, Issue 7, pp. 1-8.
[21] Rohit K. Bhullar et al., “Novel Stress Calculation in Segmented Processor Systems Using Buddy Approach”, Journal of intelligent and fuzzy systems” IOS press, ISSN: 1064-1246, In Press.
[22] Rohit kumar Bhullar et al, “Test Your Programming Quotient for C”, Param Hans Publisher New Delhi, ISBN: 978-1-329-80946-8, Book. [23] Rohit Kumar et. al, “Pen Drive With OS Controlled Inbuilt Permanent Data Storage Partition”, Patent 2111/DEL/2015.