T E C H N I C A L N O T E
Open Access
The OU-ISIR Gait Database comprising the
Large Population Dataset with Age and
performance evaluation of age estimation
Chi Xu
1,2, Yasushi Makihara
2*, Gakuto Ogi
2, Xiang Li
1,2, Yasushi Yagi
2and Jianfeng Lu
1Abstract
In this paper, we describe the world’s largest gait database, the “OU-ISIR Gait Database, Large Population Dataset with Age (OULP-Age)” and its application to a statistically reliable performance evaluation of gait-based age estimation. Whereas existing gait databases include only 4016 subjects at most, we constructed an extremely large-scale gait database that includes 63,846 subjects (31,093 males and 32,753 females) with ages ranging from 2 to 90 years old. Benchmark algorithms of gait-based age estimation were then implemented to evaluate statistically significant performance differences. Additionally, the dependence of gait-based age estimation performance on gender and age group, in addition to the number of training subjects, was investigated to provide several insights for future research on the topic.
Keywords: Gait database, Large population, Gait-based age estimation, Performance evaluation
1 Introduction
Gait is one of the most popular behavioral biometrics and has advantages over other physiological biometric cues (e.g., DNA, fingerprints, irises, and faces) in terms that it is difficult to imitate and obscure. Additionally, it can be authenticated at a large distance from a camera (e.g., closed-circuit television (CCTV) installed in pub-lic) because it works even with relatively low-resolution images [1] without subject cooperation. Gait recognition has therefore attracted much attention in many applica-tions for surveillance and forensics [2–4].
Whereas extensive studies on human gait [1, 5–10] mainly focus on person authentication and identifica-tion, that is, hard biometrics, the recognition of other attributes, such as gender and age, that is, soft biometrics [11], is also important because they could help to both enhance surveillance capabilities [12, 13] and develop potential applications, such as automatic customer count-ing by age group and gender for marketcount-ing research [11].
*Correspondence: [email protected]
2The Institute of Scientific and Industrial Research, Osaka University, 8-1 Mihogaoka, Ibaraki, 567-0046 Osaka, Japan
Full list of author information is available at the end of the article
Gait-based soft biometrics also involve a wide research area, such as gender classification [14–21], age group classification [22–25], age estimation [11, 26–28], and eth-nicity classification [26, 29]. Among them, gait-based age estimation is one of the challenging topics; however, it has high application potential (e.g., automatic access control to prevent people of an unpermitted age from access-ing certain sites and specific human-computer interaction applications).
Compared with face-based age estimation [30–40], there are far fewer studies [11, 26–28] on gait-based age estimation. One of the reasons for this is that existing gait databases [5, 41–44] have been insufficient in terms of the number of subjects, in addition to age variation and balance, which are essential aspects for the statistically reliable evaluation of gait-based age estimation [11]. The only exception is the OU-ISIR Large Population (OULP) dataset [45], which includes 4,016 subjects with ages rang-ing from 1 to 94 years old. The OULP dataset, however, still suffers from a shortage of subjects, especially for ages over 50 years old, which may significantly affect the performance of age estimation.
To overcome these defects, we constructed an extremely large-scale gait dataset, the OU-ISIR Gait Database, Large Population Dataset with Age (OULP-Age), which includes
more than 60,000 subjects, with a competitive range of ages and fewer age biases than the OULP dataset. To the best of our knowledge, this is the largest gait dataset in the world (i.e., more than 10 times the number of sub-jects contained in the OULP dataset), which allows us to evaluate the performance of age estimation in a more statistically reliable manner and demonstrate the effects of gender and age group. We demonstrated our dataset’s validity through experiments with gait-based age estima-tion benchmark algorithms and investigated the depen-dences of age estimation performance on gender and age group, in addition to the number of training subjects. Note that, in this paper, we do not aim to propose a techni-cally novel gait-based age estimation method, but aim to provide a gait database and suitable set of performance evaluation results that contribute to the video-based gait analysis research community.
The outline of the paper is as follows. In Section 2, we review existing gait databases and related work on gait-based age estimation. In Section 3, we describe the construction of our dataset. We briefly introduce the gait-based age estimation benchmarks in Section 4, and present various performance evaluations using our dataset in Section 5. Finally, we conclude this paper in Section 6 and discuss future work on the subject.
2 Related work
2.1 Gait databases
Existing major databases are summarized in Table 1, with brief descriptions given below.
The SOTON databases are composed of a small pop-ulation dataset [41], large poppop-ulation dataset [46], and SOTON Temporal [42]. The SOTON small database is used to explore gait recognition under covariates such as views, shoes, clothing, carriage, and walking speed.
The SOTON large database was the first gait database to contain over 100 subjects, walking on a track indoors and outdoors, and on a treadmill, who were observed from two views. SOTON Temporal [42] contains the largest variations with respect to time elapse, which is up to one year. The SOTON databases enable the investigation of the effects of various covariates on gait recognition per-formance; however, age information is not included, and hence cannot be used for the study of gait-based age estimation.
The USF dataset [5] is one of the most frequently used gait databases and is composed of 122 subjects (85 males and 37 females) with ages ranging from 19 to 59 years old, who walked outdoors under a variety of covariates, including view, surface, shoes, bags, and time elapse. This database is suitable for the evaluation of which covariate significantly impacts gait recognition performance [47] and can be used for the analysis of gait-based age esti-mation. However, the limited number of subjects, and significant biases in terms of gender and age, may make the evaluation of age estimation inadequate.
CASIA dataset A [48] is the initial dataset of the CASIA databases and contains a small number of subjects with view variations. By contrast, CASIA dataset B [43] is widely used because it includes multiviews, different clothing, and carrying status. CASIA dataset C [49] con-sists of the largest number of subjects among the CASIA databases, and the subjects were captured in an outdoor night scenario, with walking speed and carriage variations. The CASIA databases, however, cannot be used to con-duct experiments on age estimation because of the lack of age information.
OU-ISIR Treadmill datasets A [50] and B [51] con-tain the largest speed variations (i.e., from 2 to 10 km/h at 1 km/h interval), and clothing variations (i.e., 32 combinations), and therefore are suitable for evaluating
Table 1Existing major gait databases
Database #Subjects Age Covariates Total video time length [h]
SOTON Small database [41] 12 N Y –
SOTON Large database [46] 115 N Y –
SOTON Temporal [42] 25 N Y –
USF dataset [5] 122 Y Y –
CASIA dataset A [48] 20 N Y –
CASIA dataset B [43] 124 N Y –
CASIA dataset C [49] 153 N Y –
OU-ISIR Treadmill dataset A [50] 34 N Y 0.9
OU-ISIR Treadmill dataset B [51] 68 N Y 4.6
OU-ISIR Treadmill dataset C [24] 200 Y Y 8.3
OU-ISIR Treadmill dataset D [52] 185 N Y 0.6
speed-invariant and clothing-invariant gait recognition. The OU-ISIR Treadmill dataset C [24] includes 200 sub-jects (100 males and 100 females) from 25 views, with ages ranging from 4 to 75 years old, and it can be used for both view-invariant gait recognition and age estimation. OU-ISIR Treadmill dataset D [52] is composed of 185 subjects with various degrees of gait fluctuations (i.e., differences in the same phase across periods). The OULP dataset [45] contains the largest number of subjects (i.e., 4016) among all existing databases, with ages ranging from 1 to 94 years old, and it also has a well-balanced gender ratio. Covariates were excluded for the estimation of the upper limit of the performance of gait recognition, in addition to gait-based age estimation with relatively high statistical reliability.
As observed from the above, a few gait databases can be used for the evaluation of gait-based age estimation, and are inadequate in terms of the number of subjects, in addition to gender and age balances, when compared with existing face databases (e.g., MORPH database [53]), which may introduce bias into the evaluation results [45]. Therefore, one of the important contributions of this study is to construct a significantly large-scale gait database with a wide age variation and good balance of genders and age groups to allow the performance evalu-ation of gait-based age estimevalu-ation in a more statistically reliable manner.
2.2 Gait-based age estimation
In the field of gait-based age group classification, Davis [22] classified children (3–5 years old) and adults (30–52 years old), and Begg et al. [23] classified young people (28.4 years old on average and 6.4 years standard
deviation) and the elderly (69.2 years old on average and 5.1 years standard deviation). In [24], four age groups, that is, children (under 15 years old), adult males, adult females, and the elderly (over 65 years old) were clas-sified. Chuen et al. [25] classified children and adults using the OULP dataset [45], in addition to investigating the correlation between gait features (e.g., stride length, body length, and head-to-body ratio) among children and adults.
For gait-based age estimation, Makihara et al. [11] introduced a baseline algorithm using Gaussian process regression (GPR) [30], which has been applied by a state-of-the-art face-based age estimation [32], and further used a GPR with an active set method [54] to reduce the computational time for online demonstration in [55]. Lu et al. [27] proposed a multilabel-guided subspace (MLG) to better characterize and correlate the age and gender information of subjects, and in [28], they pro-posed an ordinary preserving manifold analysis approach to seek a low-dimensional discriminative subspace for age estimation tasks.
More details of the aforementioned benchmark algo-rithms can be found in Section 4, and experiments were conducted with the benchmarks to demonstrate the valid-ity of our database in Section 5.
3 OU-ISIR Gait Database, Large Population Dataset with Age
3.1 Gait measurement system
An overview of our gait measurement system is shown in Fig. 1, which was introduced in detail in [55]. Each participant walked along the course from left to right at his/her own preferred speed without any carriage, which
allows us to investigate the upper bound of gait-based age estimation performance.
A USB camera (PointGrey, FMVU-13S2C-CS) was placed at 90° azimuth angle to the walking course, so as to capture images from a side view that obviously reflect the appearance differences among different ages in a human’s silhouette (e.g., middle-age spread and stoop in elderly can be clearly observed from a side view). In addition, because the capturing time is short (i.e., 2.5 s) and the distance from a camera to the walk-ing course is not so near (i.e., approx. 4-m distance), a viewing angle change within each image sequence is relatively small. Moreover, because photo-electronic sen-sors were installed to determine the start time for cap-ture, viewing angle differences among image sequences is small enough. Consequently, the viewing angles are almost constant within each image sequence and among image sequences, and thus we think there is no neces-sity to compensate the viewing angle difference for captured images.
As a result, a 2.5-s walking image sequence was captured for each subject, with an image size of 640×480 pixels and frame rate of 30 fps. Additionally, a green chroma-key background was arranged along the walking course to enable clear silhouette extraction.
3.2 Data collection and statistics
The dataset was collected in conjunction with an attrac-tive demonstration of gait personality measurement in an experience-based long-run exhibition at a science museum (i.e., Miraikan). Each participant was asked to declare his/her informed consent to allow the use of the collected data for research purposes and provide gender and age information as the ground truth for performance evaluation.
After acquiring the gait video sequences, the size-normalized and registered silhouette sequences [7] were obtained subsequent to the background subtraction-based graph-cut segmentation [56]. Once the gait period was detected [7], the gait energy image (GEI) [6], which is a gait feature widely used in the gait recognition commu-nity, was extracted as the gait feature for the performance evaluation of gait-based age estimation.
Consequently, we constructed the world’s largest gait dataset including 63,846 subjects (31,093 males and 32,753 females) with ages ranging from 2 to 90 years old. The overall time length of video data contained in this dataset is approximately 44.3 h, more than five times longer than the amount of existing public large-scale databases. We call this dataset the “OU-ISIR Gait Database, Large Population Dataset with Age” (OULP-Age)1. The detailed distribution of subjects’ gender and age groups in five-year intervals is shown in Fig. 2, and example images of subjects in our dataset are shown in
Fig. 2Distribution of subjects’ gender and age in the OULP-Age dataset
Fig. 3. Compared with existing gait databases, our dataset has the following four main advantages.
1. Extremely large population: The number of subjects is more than 10 times that contained in publicly available large-scale gait databases, which
significantly improves the statistical reliability of the performance evaluation of gait-based age estimation. Moreover, some potential approaches (e.g., deep learning-based approaches) to gait-based age estimation are expected to be achieved only after using this dataset, because the deep learning-based approaches usually requires a sufficiently large amount of training samples, although this paper evaluated only the existing techniques which do not rely on deep learning.
2. Entire generation: The age range is from 2 to 90 years old, with each age group in 5-year intervals from 0 to 70 years old containing more than 500 subjects. Furthermore, it is worth mentioning that our dataset includes a sufficient number of children at all stages of growth, in addition to a considerable number of elderly people with a wide age variation, whereas most existing gait databases mainly consist of young and middle-aged subjects. These properties not only provide more statistically reliable results for
performance evaluation, but also enable the investigation of the dependences of age estimation performance on age group, which is beneficial to the training of a more reliable regression model.
3. Gender balance: The ratio of males to females is close to one. This gender balance allows us to evaluate the gender impact on age estimation performance, in addition to constructing gender-specific gait aging models or regression models for future research [11]. 4. Silhouette quality and information correctness: Our
Fig. 3Example images of subjects in the OULP-Age dataset
only to ensure image quality, but also to exclude variations in walking conditions to enable a pure investigation of gait-based age estimation. Additionally, the gender and age information inputted by participants serves as the ground truth for performance evaluation. The participants might have, however, mis-inputted their gender and age information (e.g., an adult with his/her inputted age of 3 years old, a male subject with his provided gender of female) or joined this exhibition with other person’s information (e.g., a child joined it with his/her parent’s gender and age information). We therefore asked our annotators to visually compare original images and provided gender and age information and to find out subjects with obviously incorrect age and/or gender information. We conducted this manual check twice by different annotators and eliminated subjects from the database whose ages and/or genders were annotated as incorrect ones in the first and/or the second check. As such, we minimized the effects of inaccurate age and gender information on the performance of gait-based age estimation as much as possible.
4 Benchmarks
4.1 Gaussian process regression
Gaussian process regression (GPR) [11, 55] estimates the posterior probability distribution of the observed age that corresponds to the testing gait feature based on the train-ing set, where the posterior probability distribution is defined as a Gaussian distribution. Additionally, the inner product between two feature vectors is defined as a radial basis function (RBF) kernel to handle nonlinearity. Con-sidering the computational time, we adopt a GPR with an active set method used in [55], where the training set used is limited to theKnearest neighbors (KNNs) of that test-ing sample. In this study, the observation noise variance for estimating the posterior probability distribution was set to 0.25, and the number of nearest neighbors (NNs)
K = 10, 100, 1000 were exploited in the performance evaluation.
4.2 Support vector regression
The support vector regression (SVR) [57], a robust regres-sor for function estimation based on support vectors, has been employed by state-of-the-art face-based age estima-tion [37]. Its basic concept is to determine a funcestima-tion that has at most deviation from the actually obtained target (i.e., ground truth age) for training gait features and is simultaneously as smooth as possible, which makes the SVR less sensitive to outliers. In this study, linear and Gaussian kernels were used and the hyperparameters were set as default values in MATLAB functions. More specifically, we set the following: penalty coefficientC =
18.53 for the Gaussian kernel andC=1 for the linear ker-nel, and parameter fordeviation =1.85. Additionally, we set the kernel scale factor for Gaussian kernel function to 32.88.
4.3 Multilabel-guided subspace
The multilabel-guided subspace (MLG) [27] is a projec-tion to better characterize and correlate the gender and age information of a person for age estimation, which is motivated by the fact that gait appearance varies between males and females, even within the same age group. Addi-tionally, as a human’s age assumes only nonnegative val-ues, a label encoding scheme is devised to convert the age value into a binary sequence, so as to apply the subsequent multilabel KNN classification [58] instead of conventional regression methods. Principal component analysis (PCA) is first applied to reduce the feature dimension, and in this paper, we made PCA retain 99% of the variance. The dimension of the MLG subspace was set to be the same as the feature dimension after PCA projection.
4.4 Ordinary preserving manifold analysis
similar label values (i.e., small age difference) are projected to be as close as possible, and those with dissimilar label values (i.e., large age difference) are projected to be as far as possible, simultaneously. Multiple linear regression models are further adopted to solve the regression prob-lem in the low-dimensional manifold space. Two ordinary preserving manifold analysis approaches proposed in [28], ordinary preserving linear discriminant analysis (OPLDA) and ordinary preserving margin Fisher analysis (OPMFA), were both evaluated in this study. Similar to MLG, PCA was first applied and preserved 99% of the variance. The hyperparameters were all set to be the same as those in [28].
5 Performance evaluation
5.1 Protocol
We randomly divided the entire dataset into two disjoint subsets with the same size (i.e., 31,923 subjects), that is, a training set and testing set, where the training set contains 15,596 males and 16,327 females, whereas the testing set contains 15,497 males and 16,426 females2, with a similar distribution as that of the entire dataset for both subsets.
We evaluated the performance of gait-based age estima-tion using a mean absolute error (MAE) and cumulative score [11, 28, 55]. Given the estimated ageaˆti and ground truth age ati for the i-th test sample, the MAE M is defined as
M= 1
Nt Nt
i=1
aˆti−ati, (1)
whereNtis the number of test samples. Additionally, the cumulative score for they-year absolute error tolerance
CS(y)is defined as
CS(y)= N t(y)
Nt , (2)
where Nt(y)is the number of samples with an absolute
error withinyyears.
5.2 Performance of benchmarks
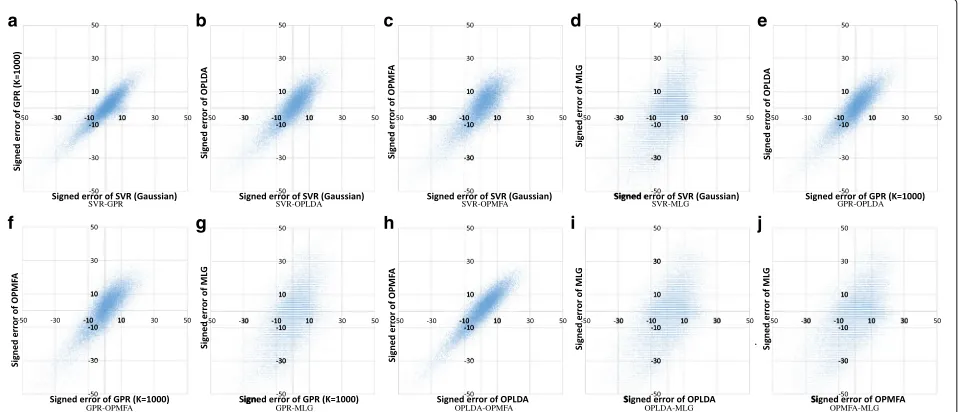
In this section, we compare the performance of the bench-marks described in Section 4. The MAE and cumulative scores are shown in Table 2 and Fig. 4, respectively. Addi-tionally, the scatter plots of the ground truth ages and corresponding estimated ages from five benchmarks3are provided in Fig. 5.
We found that the accuracy of GPR increased with an increase of K because a larger K includes more train-ing samples, but is simultaneously computationally more expensive. The SVR with the Gaussian kernel performed better than that with the linear kernel because the lin-ear regression cannot model the complex aging process well [37]. Additionally, although MLG had the largest
Table 2MAE of the benchmarks
Algorithm MAE (year)
GPR (K=10) 8.83
GPR (K=100) 7.94
GPR (K=1000) 7.30
SVR (linear) 8.73
SVR (Gaussian) 7.66
MLG 10.98
OPLDA 8.45
OPMFA 9.08
Bold and italic bold indicate the best and second-best performance. This font convention is used to indicate performance throughout this paper
cumulative scores within the 5-year absolute errors, it still obtained the worst MAE among all the benchmarks. As a result, the GPR with K = 1000 achieved the best MAE and also the best cumulative score (e.g., the absolute errors of 74.2% and 88.5% of subjects are less than 10 and 15 years, respectively), whereas the SVR with the Gaussian kernel yielded the second-best performance.
The results shown by the scatter plots are consistent with the MAE and cumulative scores, which can be easily understood from the distribution of the plots. Essentially, the subjects with a small ground truth age (e.g., less than 20 years old) tend to be more overestimated, whereas the subjects with a large ground truth age (e.g., more than 50 years old) tend to be more underestimated, where females are more likely to have larger underestimate errors than males. These characteristics are common for all the benchmarks except for MLG, which converts the age value into a binary sequence and classifies each binary digit independently using all the training samples, regard-less of the connection between the binary digits, which
a
d
e
b
c
Fig. 5Scatter plots of ground truth ages and corresponding estimated ages from the benchmarks. Female and male samples are depicted in red and blue, respectively. The black diagonal line indicates where the estimated age equals the ground truth age.aGPR(K=1000),bSVR (Gaussian), cMLG,dOPLDA,eOPMFA
leads to the localization of the estimated age values. On the other hand, the impact of gender difference and age group difference demonstrates the possibility of consider-ing gender-specific and age group-specific age estimation to improve performance, which are further discussed in Sections 5.4.2 and 5.4.3. Moreover, because some sub-jects are estimated as having negative age values, which is inconsistent with our knowledge of human ages, it will be necessary to include a reasonable constraint on estimated age values in future studies (i.e., truncated to nonnegative values).
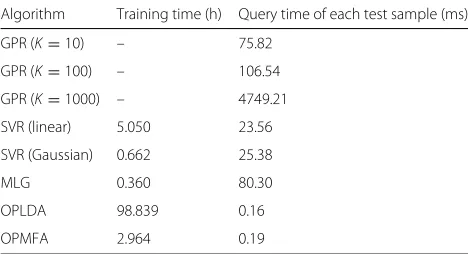
As an important aspect in real-world applications, the computational times of the benchmarks were further compared by running MATLAB code on a PC with an Intel Core i7 4.00 GHz processor and 32 GB RAM. The training times of the manifold subspace and regression model, in addition to the query time of each test sample, are listed in Table 3. Based on these results, the OPLDA took much more time than the other benchmarks in the training stage because the computational time complexity
is ON2 for computing the within-class scatter and between-class scatter matrices, where number of train-ing samplesN was over 30,000 in our implementation. Regarding the query time of each test sample, only GPR (K = 1000) exceeded 1 s because the increase of K
results in the cubic increase of the computational time for the inverse matrix, and hence it is necessary to choose a
Table 3Computational time of benchmarks
Algorithm Training time (h) Query time of each test sample (ms)
GPR (K=10) – 75.82
GPR (K=100) – 106.54
GPR (K=1000) – 4749.21
SVR (linear) 5.050 23.56
SVR (Gaussian) 0.662 25.38
MLG 0.360 80.30
OPLDA 98.839 0.16
suitable K to balance accuracy and computational effi-ciency for GPR [55].
5.3 Correlation among benchmarks
Although some kind of upper limit on the performance of gait-based age estimation using benchmarks was demon-strated in the previous section, it is still meaningful to investigate the correlation between benchmarks for fur-ther performance improvement using a fusion scheme. Therefore, we analyzed the relations between signed errors of two benchmarks with a full combination, as shown in Fig. 6.
The results illustrated that the errors of MLG have a relatively weak correlation with all the other bench-marks because it uses the label encoding scheme and multilabel KNN classification [58] instead of conventional regression methods used in other benchmarks. Addition-ally, the errors of GPR-SVR and OPLDA-OPMFA have a relatively strong correlation because the former pair are both example-based regression approaches and the latter pair are both ordinary preserving manifold learning-based approaches. On the other hand, although the error relation between each pair of benchmarks is correlated to some extent, dispersal exists at a certain level, which indicates that there is still room for the performance improvement of age estimation by fusing these bench-marks, and therefore, an exploration of such fusion is a future research avenue for gait-based age estimation.
5.4 Effects of gender and age group
In this section, we investigate the difference in gait-based age estimation performance between genders and age
groups. Our dataset is suitable for this task because of its large population and wide distribution of age, in addition to the gender balance, as mentioned in Section 3.2. SVR with the Gaussian kernel was adopted for the evaluation because it achieves a good trade-off between accuracy and computational time, as reported in Section 5.2.
5.4.1 Effects of training subjects’ distribution
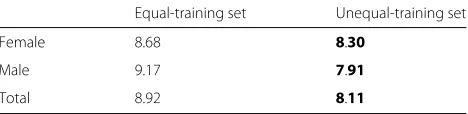
First, we focus on the difference in age estimation per-formance between the different distributions of training subjects. For this purpose, we prepared two training sub-sets with the same size (i.e., 10,029 subjects) but different distributions, and the testing set remained the same as that introduced in Section 5.1. More specifically, the first training subset, referred to as the equal-training set, is regarded as an equal distribution in terms of gender and age group, where 400 subjects were randomly selected for each gender and age group in 5-year intervals from 0 to 50 years old, whereas all the subjects over 50 years old introduced in the entire training set in Section 5.14 were used. The second training subset, referred to as the unequal-training set, is considered to have a sim-ilar distribution as the testing set in terms of gender and age group and consists of subjects randomly chosen from the entire training set, with the same size as the equal-training set.
The MAE of each gender and total MAE over all sub-jects in the testing set with for two training subsets are summarized in Table 4. According to the results, the unequal-training set achieved better performance than the equal-training set because it has similar distribu-tions to the testing set. Another interesting finding is that
a
f
b
g
c
h
d
i
e
j
Table 4MAE (year) of each gender and total MAE over all subjects in the testing set
Equal-training set Unequal-training set
Female 8.68 8.30
Male 9.17 7.91
Total 8.92 8.11
Bold and italic bold indicate the best and second-best performance. This font convention is used to indicate performance throughout this paper
the performance is better for females than males in the equal-training set, whereas the converse results are reflected in the unequal-training set. This is because the unequal-training set is assumed to contain more appearance variations (e.g., variations in clothes and hair style) than the equal-training set considering the num-ber of females, which affects the training of the regression model.
Additionally, the MAE and mean signed error (MSE) of each gender and age group in 5-year intervals, which are counted based on the ground truth age and estimated age, respectively, are shown in Figs. 7 and 8, respectively. Based on the results, the MAE of the ground truth age groups less than 35 years old from the unequal-training set are smaller than that from the equal-training set, whereas the MAE of age groups larger than 40 years old from the untraining set are larger than that from the equal-training set, which can be understood according to the different distributions of training subjects.
Regarding the MSE shown in Fig. 8, the equal-training set has a wider range of estimated ages, in addition to bal-anced errors for most estimated age groups. Moreover, the MSE of the equal-training set presents a clear trend with respect to the age groups, which provides the possibility of performance improvement. By contrast, the age groups
less than 5 years old in the unequal-training set have larger MSEs than the other age groups, which also indicates that there is room to improve performance.
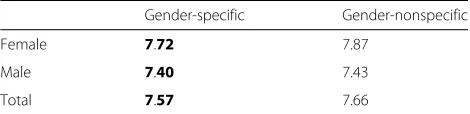
5.4.2 Gender-specific age estimation
To demonstrate the difference between genders in age estimation performance, we conducted experiments on gender-specific age estimation, that is, training the regres-sion model and estimating the age of test samples for females and males separately. The same dataset setting as Section 5.2 was used; thus, we can compare the results with SVR (Gaussian) reported in Section 5.2, that is, gender-nonspecific age estimation.
The MAEs listed in Table 5 demonstrate that the gender-specific strategy slightly improved performance; however, the difference is insignificant. Additionally, the MAE of females is larger than that of males for both gender-specific and gender-nonspecific age estimation, which is because the range of appearance variations in females that mainly originate from variations in clothes, hair style, and shoes is greater than that in males.
5.4.3 Age group-specific age estimation
In this section, we focus on the difference in age esti-mation performance among different age groups. Similar to the analysis on gender difference, we divided all the ages into five age groups to evaluate the performance of age group-specific age estimation. More specifically, age groups were set in 15-year intervals from 0 to 60 years old, and the ages over 60 years old were set as one group because of the small number of subjects. In addition to the results of age group-specific and age group-nonspecific (i.e., train the regression model using all ages and com-pute the MAEs only for test samples included in each group) age estimation, we also calculated the MAE of the chance-level under a uniform distribution (i.e., assume a
a
b
a
b
Fig. 8MSE (year) of each gender and age group for two training subsets. Age groups are counted based on estimated age.aMale,bFemale
uniform distribution of ages and use the mean age value as the estimated age for each group) and chance-level under a training distribution (i.e., adopt the mean age of the training set as the estimated age for each group) for com-parison. We still used the same dataset settings as those in Section 5.2.
The MAEs of each age group are reported in Table 6. The age group-specific strategy significantly improved the performance of age estimation, especially for the group less than 15 years old, which achieved a quite successful MAE of approximately 1 year because this group contains considerable gait changes during the growth of children. Regarding the group of 31–45 years old, which is a difficult case because the gait fluctuation among ages is smaller than the other groups because of the quite slight difference in physical state, although the performance of age group-specific age estimation is not as good as the group from 0 to 15 years old, it still suppressed the MAE to be lower than half of that for age group-nonspecific age estimation. Therefore, it is reasonable to believe that age estimation performance could be improved by first conducting age group classification and then estimating the age depend-ing on the classified age group, which is a potential future research direction.
5.5 Sensitivity of training subjects’ number
In this section, we demonstrate the sensitivity of the num-ber of training subjects. We prepared six sizes of training set for comparison, that is, 1000; 2000; 5000; 10,000;
Table 5Comparison for the MAE (year) of gender-specific and gender-nonspecific age estimation
Gender-specific Gender-nonspecific
Female 7.72 7.87
Male 7.40 7.43
Total 7.57 7.66
Bold and italic bold indicate the best and second-best performance. This font convention is used to indicate performance throughout this paper
20,000; and the maximum number (31,923) of subjects, with the first five training subsets all randomly chosen from the maximum training set. Again, the evaluation was based on SVR with the Gaussian kernel.
The MAE of the testing set first decreased rapidly with an increase in the number of training subjects, and then declined relatively slower. As a result, the maximum size of the training set achieved the minimum MAE, which can be observed in Fig. 9. Consequently, a large-scale training set is necessary to obtain more statistically reliable results, in addition to training a more reliable regression model.
5.6 Statistical reliability of database
To validate the statistical reliability in terms of perfor-mance evaluation of gait-based age estimation using this dataset, we compared the performance with the exist-ing largest gait database, i.e., OULP dataset, by apply-ing SVR with the Gaussian kernel. More specifically, we repeated the experiments with 10 different pairs of train-ing and testtrain-ing subsets that were randomly chosen from the whole dataset with an equal size (i.e., 31,923 subjects for our dataset) and computed the mean and standard deviation of the obtained MAEs. Due to the different setup of camera viewing angle in OULP dataset, we exe-cuted the repeating random selection scheme for a subset from OULP dataset with the observation angle of 85°
Table 6MAE (year) of each age group Age group Age
group-nonspecific
Age group-specific
Chance-level under a uniform distribution
Chance-level under a training distribution
0–15 5.94 1.18 4.00 2.46
16–30 5.68 3.10 3.73 3.36
31–45 7.50 3.52 3.73 3.75
46–60 14.42 3.30 3.73 3.45
Over 60 28.59 4.15 - 4.47
Fig. 9MAE (year) of the testing set using different numbers of training subjects. Training sets composed of 1000; 2000; 5000; 10,000; 20,000, and 31,923 subjects were prepared for comparison. The horizontal axis is shown on the log scale
(i.e., OULP-C1V1-B-85 [45]), that has almost the same viewing angle as ours (i.e., 90°). The OULP-C1V1-B-85 totally contains 3923 subjects, and therefore 10 pairs of training (1962 subjects) and testing (1961 subjects) subsets were prepared to compare the results with our dataset.
As seen from the Table 7, while OULP-C1V1-B-85 yielded 0.140 (years) standard deviation of the MAEs, the proposed dataset got a sufficiently smaller standard deviation of the MAEs as 0.059 (year), which illustrates the high statistical reliability of the dataset in the aspect of performance evaluation of gait-based age estimation. In addition, the smaller averaged MAE compared with the OULP dataset again demonstrates the necessity of large-scale training set for obtaining better age estimation performance, which is consistent with the observation in Section 5.5.
5.7 Failure case analysis
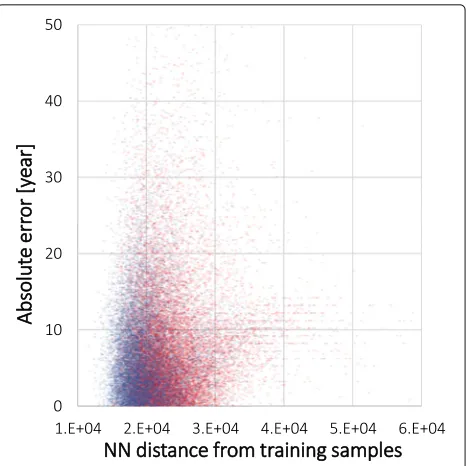
Because SVR is a type of example-based regression approach, we first present Fig. 10 to investigate the rela-tion between the absolute error and the NN distance from the training samples for each test sample, that is, we want to determine whether a rare test sample that is far from any training samples suffers from large errors. Essentially, a small NN distance is more likely to result in a small estimation error, yet outliers exist; thus, we analyze these failure cases in this section.
Table 7Comparison of the proposed dataset and OULP dataset in terms of the mean and standard deviation of the MAE (year)
OULP-C1V1-B-85 Proposed dataset
Mean 8.80 7.65
Standard deviation 0.140 0.059
Bold and italic bold indicate the best and second-best performance. This font convention is used to indicate performance throughout this paper
Fig. 10Relation between the absolute error and NN distance from the training samples for each test sample. Female and male samples are depicted in red and blue, respectively
The failures can be divided into two types: (1) fail-ures with small NN distances from the training samples and (2) failures with large NN distances from the train-ing samples. We first present some typical failed examples that fell into the first type in Fig. 11a. These failures mainly resulted from differences in gait features between their chronological age and physiological age. For exam-ple, the underestimated elderly and middle-aged subjects may look very slim or appear to have no apparent stoop in their gaits, whereas spread and stoop are very common for most elderly and middle-aged adults, and therefore, their gaits are closer to those of young people or even children, and vice versa. On the other hand, these fail-ure cases imply another interesting research topic, which is that the age estimated by gait indicates the physical strength and fitness of humans, to some extent, which may be applied in the field of health examination and exercise science [11].
a
b
Fig. 11Typical failure (absolute error larger than 20 years) examples. Digits in black represent the ground truth age. For the testing sample, bracketed digits represent the estimated age, whereas red indicates an overestimate and blue indicates an underestimate. For the NN training sample, gray digits indicate the NN distance from the above testing sample.aFailures with small NN distances (less than 2.5E+04) from the training samples,bFailures with large NN distances (more than 4.0E+04) from the training samples
6 Conclusion
In this paper, we described the construction of a gait database comprising a large population dataset with age and presented a statistically reliable performance eval-uation of gait-based age estimation. The proposed gait dataset includes 63,846 subjects, which is more than 10 times greater than the number contained in existing pub-lic large-scale databases. Additionally, our dataset has an advantage over existing databases in terms of age variation (ranging from 2 to 90 years old), gender bal-ance, and the silhouette quality and information correct-ness guaranteed by manual confirmation. The statistically reliable performance of gait-based age estimation was evaluated using benchmark algorithms on our dataset. Moreover, the effects of gender and age group, in addi-tion to the number and distribuaddi-tion of training sub-jects, on age estimation performance were analyzed, with the results providing several insights for future research, such as the performance difference between genders
and performance improvement by age group-specific age estimation.
One important future work is the enhancement of this dataset, especially for the elderly, whose number of sub-jects is still insufficient compared with that of other gen-erations. Moreover, the performance improvement of the benchmarks by incorporating other state-of-the-art fea-tures and regression methods, in addition to the develop-ment of a better approach, also need to be investigated in the future. Additionally, our dataset is suitable for research on gait-based gender and age group classification, which are meaningful preprocesses for gender and age group-specific age estimation to further improve performance, and these will be addressed in future studies.
Endnotes
1This database is available at http://www.am.sanken.
2The lists of subject IDs for the training and testing sets
are available, together with the dataset.
3Only GPR with K = 1000, SVR with the Gaussian kernel, MLG, OPLDA, and OPMFA are plotted.
4Considering that the number of subjects over 50 years
old is much fewer than those less than 50 years old, we used all the subjects over 50 years old in the entire training set to maintain the age group balance as much as possible.
Abbreviations
CCTV: Closed-circuit television; GEI: Gait energy image; GM: Gabor magnitude; GP: Gabor phase; GPR: Gaussian process regression; KNN: K nearest neighbor; MAE: Mean absolute error; MLG: Multilabel-guided subspace; MSE: Mean signed error; NN: Nearest neighbor; OPLDA: Ordinary preserving linear discriminant analysis; OPMFA: Ordinary preserving margin fisher analysis; OULP: OU-ISIR Large Population dataset; OULP-Age: OU-ISIR Gait Database, Large Population Dataset with Age; PCA: Principal component analysis; RBF: Radial basis function; SVR: Support vector regression
Acknowledgements
This work was supported by JSPS Grants-in-Aid for Scientific Research (A) JP15H01693, JSPS Grants-in-Aid for Scientific Research (B) 16H02848, the Jiangsu Provincial Science and Technology Support Program (No. BE2014714), 111 Project (No. B13022), and Priority Academic Program Development of Jiangsu Higher Education Institutions. We thank Maxine Garcia, Ph.D., from Edanz Group (www.edanzediting.com/ac) for editing a draft of this manuscript.
Authors’ contributions
CX executed the experiments and data analysis and wrote the initial draft of the manuscript. YM managed the advisor position for the paper’s
presentation, data collection, experiment design, and data analysis, in addition to manuscript revision. GO collected data and generated gait features. XL participated in the implementation of experiments. YY supervised the work, in addition to providing technical support and conceptual advice. JL participated in the design of the study. All authors read and approved the final manuscript.
Competing interests
The authors declare that they have no competing interests.
Publisher’s Note
Springer Nature remains neutral with regard to jurisdictional claims in published maps and institutional affiliations.
Author details
1School of Computer Science and Engineering, Nanjing University of Science
and Technology, 200 Xiaolingwei, 210094 Nanjing, China.2The Institute of
Scientific and Industrial Research, Osaka University, 8-1 Mihogaoka, Ibaraki, 567-0046 Osaka, Japan.
Received: 22 August 2017 Accepted: 28 November 2017
References
1. Nixon MS, Tan TN, Chellappa R (2005) Human identification based on gait. Int. Series on Biometrics. Springer, US
2. Bouchrika I, Goffredo M, Carter J, Nixon M (2011) On using gait in forensic biometrics. J Forensic Sci 56(4):882–889
3. Iwama H, Muramatsu D, Makihara Y, Yagi Y (2013) Gait verification system for criminal investigation. IPSJ Trans Comput Vis Appl 5:163–175 4. Lynnerup N, Larsen PK (2014) Gait as evidence. IET Biometrics 3(2):47–54.
doi:10.1049/iet-bmt.2013.0090
5. Sarkar S, Phillips JP, Liu Z, Vega IR, ther PG, Bowyer KW (2005) The humanid gait challenge problem: data sets, performance, and analysis. IEEE Trans Pattern Anal Mach Intell 27(2):162–177
6. Han J, Bhanu B (2006) Individual recognition using gait energy image. IEEE Trans Pattern Anal Mach Intell 28(2):316–322
7. Makihara Y, Sagawa R, Mukaigawa Y, Echigo T, Yagi Y (2006) Gait recognition using a view transformation model in the frequency domain.
In: Proc. of the 9th European Conference on Computer Vision. Springer Berlin Heidelberg, Graz. pp 151–163
8. Wang C, Zhang J, Wang L, Pu J, Yuan X (2012) Human identification using temporal information preserving gait template. IEEE Trans Pattern Anal Mach Intell 34(11):2164–2176
9. Lam THW, Cheung KH, Liu JNK (2011) Gait flow image: a silhouette-based gait representation for human identification. Pattern Recog 44:973–987 10. Xu C, Makihara Y, Li X, Yagi Y, Lu J (2017). In: Lai SH, Lepetit V, Nishino K, Sato Y (eds). Speed invariance vs. stability: cross-speed gait recognition using single-support gait energy image. Springer, Cham. pp 52–67 11. Makihara Y, Okumura M, Iwama H, Yagi Y (2011) Gait-based age
estimation using a whole-generation gait database. In: Proc. of the Int. Joint Conf. on Biometrics (IJCB2011). IEEE, Washington D.C. pp 1–6 12. Abreu MCDC, Fairhurst M (2011) Enhancing identity prediction using a
novel approach to combining hard- and soft-biometric information. IEEE Trans Syst Man Cybern Part C (Appl Rev) 41(5):599–607
13. Dantcheva A, Velardo C, D’Angelo A, Dugelay JL (2011) Bag of soft biometrics for person identification. Multimedia Tools Appl 51(2):739–777 14. Kozlowski LT, Cutting JE (1977) Recognizing the sex of a walker from a
dynamic point-light display. Percept Psychophys 21(6):575–580 15. Yoo J, Hwang D, Nixon MS (2006) Gender classification in human gait
using support vector machine. In: Advanced Concepts For Intelligent Vision Systems. Springer Berlin Heidelberg, Antwerp. pp 138–145 16. Huang G, Wang Y (2007) Gender classification based on fusion of
multi-view gait sequences. In: Proc. of the 8th Asian Conf. on Computer Vision, vol 1. Springer Berlin Heidelberg, Tokyo. pp 462–471
17. Li X, Maybank SJ, Yan S, Tao D, Xu D (2008) Gait components and their application to gender recognition. Trans Syst Man Cybern C 38(2):145–155 18. Lee L, Grimson W (2002) Gait analysis for recognition and classification. In: Proc. of the 5th IEEE Conf. on Face and Gesture Recognition, vol 1. IEEE, Washington. pp 155–161
19. Yu S, Tan T, Huang K, Jia K, Wu X (2009) A study on gait-based gender classification. IEEE Trans Image Process 18(8):1905–1910
20. Hu M, Wang Y, Zhang Z, Wang Y (2010) Combining spatial and temporal information for gait based gender classification. In: Proc. of the 20th Int. Conf. on Pattern Recognition. IEEE, Istanbul. pp 3679–3682
21. Martin-Felez R, Mollineda RA, Sanchez JS (2010) A gender recognition experiment on the casia gait database dealing with its imbalanced nature. In: Proc. of Int. Conf. on Computer Vision Theory and Applications 2010, vol 2. INSTICC Press, Angers. p 6
22. Davis JW (2001) Visual categorization of children and adult walking styles. In: Proc. of the Int. Conf. on Audio- and Video-based Biometric Person Authentication. Springer Berlin Heidelberg, Halmstad. pp 295–300 23. Begg RK (2005) Support vector machines for automated gait
classification. IEEE Trans Biomed Eng 52(5):828–838
24. Mannami H, Makihara Y, Yagi Y (2010) Gait analysis of gender and age using a large-scale multi-view gait database. In: Proc. of the 10th Asian Conf. on Computer Vision. Springer Berlin Heidelberg, Queenstown. pp 975–986
25. Chuen BKY, Connie T, Song OT, Goh M (2015) A preliminary study of gait-based age estimation techniques. In: 2015 Asia-Pacific Signal and Information Processing Association Annual Summit and Conference (APSIPA). IEEE, Hong Kong. pp 800–806
26. Lu J, Tan YP (2010) Ordinary preserving manifold analysis for human age estimation. In: IEEE Computer Society and IEEE Biometrics Council Workshop on Biometrics 2010. IEEE, San Francisco. pp 1–6 27. Lu J, Tan YP (2010) Gait-based human age estimation. IEEE Trans Inf
Forensics Secur 5(4):761–770
28. Lu J, Tan YP (2013) Ordinary preserving manifold analysis for human age and head pose estimation. IEEE Trans Human-Machine Syst 43(2):249–258 29. Zhang D, Wang Y, Bhanu B (2010) Ethnicity classification based on gait
using multi-view fusion. In: IEEE Computer Society and IEEE Biometrics Council Workshop on Biometrics 2010. IEEE, San Francisco. pp 1–6 30. Carl Edward Rasmussen CKIW (2005) Gaussian processes for machine
learning. The MIT Press, US
31. Snelson E, Rasmussen CE, Ghahramani Z (2004) Warped gaussian processes. In: NIPS16. MIT Press, Vancouver
33. Lanitis A, Taylor CJ, Cootes TF (2002) Toward automatic simulation of aging effects on face images. IEEE Trans Pattern Anal Mach Intell 24(4):442–455
34. Yan S, Zhou X, Liu M, Hasegawa-Johnson M, Huang TS (2008) Regression from patch-kernel. In: Proc. of the 21st IEEE Conf. on Computer Vision and Pattern Recognition. IEEE, Anchorage. pp 1–8
35. Guo G, Mu G, Fu Y, Huang TS (2009) Human age estimation using bio-inspired features. In: Proc. of the 22nd IEEE Conf. on Computer Vision and Pattern Recognition. IEEE, Miami. pp 112–119
36. Fu Y, Huang TS (2008) Human age estimation with regression on discriminative aging manifold. IEEE Trans Multimed 10(4):578–584 37. Guo G, Fu Y, Dyer CR, Huang TS (2008) Image-based human age
estimation by manifold learning and locally adjusted robust regression. IEEE Trans Image Process 17(7):1178–1188
38. Xiao B, Yang X, Xu Y, Zha H (2009) Learning distance metric for regression by semidefinite programming with application to human age estimation. In: Prof. of the 17th ACM Int. Conf. on Multimedia. ACM, Beijing. pp 451–460
39. Geng X, Zhou ZH, Smith-Miles K (2007) Automatic age estimation based on facial aging patterns. IEEE Trans Pattern Recog Mach Intell 29(12):2234–2240
40. Geng X, Smith-Miles K (2009) Facial age estimation by multilinear subspace analysis. In: IEEE Int. Conf. on Acoustics, Speech and Signal Processing, 2009. IEEE, Taipei. pp 865–868
41. Nixon MS, Carter JN, Shutler J, Grant M (2001) Experimental plan for automatic gait recognition. Technical report, Southampton
42. Matovski DS, Nixon MS, Mahmoodi S, Carter JN (2010) The effect of time on the performance of gait biometrics. In: Proc. of the 4th IEEE Int. Conf. on Biometrics: Theory Applications and Systems. IEEE, Washington D.C. pp 1–6
43. Yu S, Tan D, Tan T (2006) A framework for evaluating the effect of view angle, clothing and carrying condition on gait recognition. In: Proc. of the 18th Int. Conf. on Pattern Recognition, vol 4. IEEE, Hong Kong. pp 441–444
44. Makihara Y, Mannami H, Tsuji A, Hossain MA, Sugiura K, Mori A, Yagi Y (2012) The OU-ISIR Gait Database comprising the treadmill dataset. IPSJ Trans Comput Vis Appl 4:53–62
45. Iwama H, Okumura M, Makihara Y, Yagi Y (2012) The OU-ISIR Gait Database comprising the large population dataset and performance evaluation of gait recognition. IEEE Trans Inf Forensics Secur 7(5):1511–1521 46. Shutler JD, Grant MG, Nixon MS, Carter JN (2002) On a large
sequence-based human gait database. In: Proc. of the 4th Int. Conf. on Recent Advances in Soft Computing. Springer Berlin Heidelberg, Nottingham. pp 66–71
47. Makihara Y, Matovski DS, Nixon MS, Carter JN, Yagi Y, Webster JG (1999) Gait Recognition: Databases, Representations, and Applications. In: Wiley Encyclopedia of Electrical and Electronics Engineering. John Wiley & Sons, Inc. doi:10.1002/047134608X.W8261
48. Wang L, Ning H, Hu W, Tan T (2002) Gait recognition based on procrustes shape analysis. In: Proceedings. 2002 International Conference on Image Processing, vol 3. EEE, Rochester. pp 433–436
49. Tan D, Huang K, Yu S, Tan T (2006) Efficient night gait recognition based on template matching. In: Proc. of the 18th International Conference on Pattern Recognition, vol 3. IEEE, Hong Kong. pp 1000–1003
50. Makihara Y, Tsuji A, Yagi Y (2010) Silhouette transformation based on walking speed for gait identification. In: Proc. of the 23rd IEEE Conf. on Computer Vision and Pattern Recognition. IEEE, San Francisco 51. Hossain MA, Makihara Y, Wang J, Yagi Y (2010) Clothing-invariant gait
identification using part-based clothing categorization and adaptive weight control. Pattern Recog 43(6):2281–2291
52. Mori A, Makihara Y, Yagi Y (2010) Gait recognition using period-based phase synchronization for low frame-rate videos. In: Proc. of the 20th International Conference on Pattern Recognition. IEEE, Istanbul. pp 2194–2197
53. Ricanek K, Tesafaye T (2006) Morph: a longitudinal image database of normal adult age-progression. In: Proc. of IEEE 7th Int. Conf. on Automatic Face and Gesture Recognition. IEEE, Southampton. pp 341–345 54. Wada T, Matsumura Y, Maeda S, Shibuya H (2013) Gaussian process
regression with dynamic active set and its application to anomaly detection. In: Proc. of the 9th International Conference on Data Mining 2013, Las Vegas
55. Makihara Y, Kimura T, Okura F, Mitsugami I, Niwa M, Aoki C, Suzuki A, Muramatsu D, Yagi Y (2016) Gait collector: an automatic gait data collection system in conjunction with an experience-based long-run exhibition. In: 2016 International Conference on Biometrics (ICB). IEEE, Halmstad. pp 1–8
56. Makihara Y, Yagi Y (2008) Silhouette extraction based on iterative spatio-temporal local color transformation and graph-cut segmentation. In: Proc. of the 19th International Conference on Pattern Recognition, Tampa 57. Smola AJ, Schölkopf B (2004) A tutorial on support vector regression. Stat
Comput 14(3):199–222