PATTERN CLASSIFICATION TECHNIQUES FOR THE CLASSIFICATION OF CUTANEOUS MANIFESTATIONS OF SYSTEMIC LUPUS ERYTHEMATOSUS
S. Samundeswari1,2*, V. Ramalingam1, B. Latha2 and S. Palanivel1
1Department of Computer Science and Engineering, Annamalai University, Annamalai Nagar - 608002,
Tamil Nadu, India. 2Department of Computer Science and Engineering, Sri Sai Ram Engineering
College, Chennai – 600044, Tamil Nadu, India. Email: *[email protected]
Article received 01.12.2017, Revised 8.5.2018, Accepted 18.5.2018
ABSTRACT
Systemic Lupus Erythematosus-lupus (SLE-Lupus) is the prototype of multiorgan autoimmune rheumatic disorders with life threatening systemic manifestations and there is no gold standard test for the diagnosis of SLE. Pattern classification techniques are used to classify the images of SLE and their performances are evaluated. A total of images of 400 patients (200 SLE and 200 normal) are collected from various hospitals available in Tamilnadu state of India, for this experimental study. Features are extracted from these images based on color histogram and texture. Two different classifiers are considered in this study, namely, multilayer perceptron and support vector machines. Experimental results show that the multilayer perceptron model provides higher accuracy of 86.25% than other model, support vector machine for SLE identification.
Keywords: Systemic lupus erythematosus (SLE), cutaneous manifestation, Classification, histogram and texture features, multilayer perceptron (MLP), support vector machines (SVM)
INTRODUCTION
Systemic lupus erythematosus (SLE) is a syst-emic autoimmune disease such that one’s own immune system itself affects the body tissues.It affects young women in their 20’s to 30’s, predo-minantly affecting in their child bearing age, how-ever it can also occur in children and elderly. Most of the lupus patients have cutaneous mani-festations. Lupus skin manifestations are classif-ied into lupus-specific lesions (e.g., malar rash) and non-specific skin lesions (e.g., alopecia) [Gilliam et al., 1982]. Lupus-specific is classified into three major subtypes: systemic or acute cuta-neous lupus erythematosus (ACLE), subacute cutaneous lupus erythematosus (SCLE) and chro-nic cutaneous lupus erythematosus (CCLE) [Font et al., 1990]. Culture, Environment and genetics make variance in incidence and disease severity among various racial and ethnic groups [Mc Cauliffe et al., 2001]. The diversity in the skin lesions ranges from malar rash, discoid lupus to alopecia, oral ulcer, bullous lesions etc. [Laman et al, 1994]
The American College of Rheumatology (AC-R) published 11 criteria as a classification tool for identifying the SLE in patients [Tan et al., 1982]. Cutaneous lesions make up to four of the 11 revised ACR criteria of SLE. Lupus-specific skin lesions can be easily diagnosed whereas lupus non-specific skin lesions are associated with failure of multiple organs and hence continuous monitoring of patients is required [Zeevi et al., 2001]. Thus, a rheumatologist should individually evaluate the patients based on the clinical and
diagnostic criteria for effective diagnosis and treatment.
for disease diagnosis by extracting significant features which are more discriminate for classi-fication.
MATERIALS AND METHODS
Data set and preprocessing: Patients who satis-fied ACR classification criteria for SLE are cho-sen and their respective images are collected from various hospitals in Tamilnadu. A sample of 200 SLE images and 200 normal images are taken into this experimental study. A total of 400 image samples are taken to classify the images into SLE (affected) and Non-SLE (normal). Samples of cutaneous manifestations of SLE images are shown in figure 1. The first step in analyzing the image is pre-processing. Here the unwanted disto-rtions in the image are removed in order to imp-rove the efficiency of our framework. A nonlinear digital filtering technique called Median filter is applied to remove the noise. The median filter simply replaces each and every pixel by the med-ian of all neighborhood pixels and is given in equation (1).
(1)
Where w represents neighborhood pixels, [m, n]
represents the center location of the image.
Fig. 1: cutaneous manifestation of SLE patients
Methodology: The objective of the paper is to extract the histogram and texture features from various images in HSV color space and to comp-are and analyze the performance of the two classi-fiers MLP and SVM for the extracted features of images. The proposed work architecture to class-ify the images is illustrated in figure 2. The pro-posed cutaneous SLE images classification frame-work consists of three stages: (i) Pre-processing using median filtering technique to remove the noise from the image. (ii) Feature extraction pro-cess which is used to extract the histogram-based features and texture-based features in the HSV color space for the images (iii) classifiers, MLP and SVM are used to classify the images into SLE and Non-SLE. The performance of the two classi-fiers is evaluated using performance measures such as accuracy, sensitivity and specificity along with receiver operating characteristic curve (RO-C) by means of area under the ROC curve (AU(RO-C).
Fig. 2: Proposed work architecture to classify the images.
Feature Extraction: Feature extraction is the process of extracting a set of informative features
from the image which is important for analysis
and classification. In the proposed work, histo-gram-based features and the texture features are used to define the feature descriptors. A total of
39 features for HSV color space are extracted
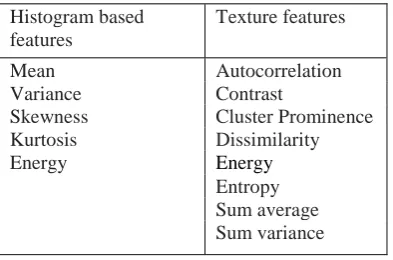
from the cutaneous SLE images and provided as an input to the classifiers. These 39 features con-sist of 3x13 features (5 Histogram features and 8 texture features) for each channel of a color space. The features extracted from HSV are shown in Table 1.
Table 1: Features extracted for classification of images
Histogram based features: Color features pro-vide highly informative regions for image analysis and understanding. The characteristics of the hist-ogram are closely related to the characteristics of the image such as brightness and contrast within a region of histogram distribution of the image is computed. The first order statistical texture feat-ures are extracted from SLE images for each cha-nnel of HSV. The features of mean, variance, ske-wness, kurtosis, and energy are calculated based on the probability distribution of the histogram intensity levels. For each channel of HSV color space, these 5 features are extracted.
Texture based features: Texture is a very impor-tant characteristic for analyzing the images. The
Histogram based features
Texture features
Mean Autocorrelation
Variance Contrast
Skewness Cluster Prominence
Kurtosis Dissimilarity
Energy Energy
second order statistical texture features are extracted using Gray-Level Co-occurrence Matrix (GLCM) method. The GLCM function extracts the texture features by calculating the spatial rela-tionship with the pair of pixels with specific val-ues, creating a co-occurance matrix. From this matrix, the statistical texture measures are extrac-ted. In order to extract the color texture features, the color images are decomposed into three chan-nels obtaining three different images. The texture features are extracted for each channel of HSV color space. 8 features namely, contrast, autoco-rrelation, dissimilarity, cluster prominence, ene-rgy, entropy, sum average and sum variance are evaluated.
Classification Techniques: Classifiers, Multila-yer Perceptron and Support Vector Machine are used to classify the images using the features extracted from it.
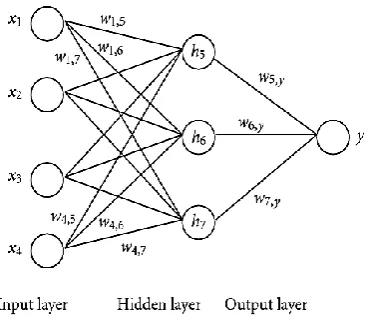
Multilayer Perceptron: Multilayer perception (MLP) is a technique that is used to map the input information into desirable results. AMLP consists of three layers, input layer, hidden layer and out-put layer, every single layer is totally linked with the next layer. The architecture of multilayer per-ceptron is shown in figure 3. Nodes in the hidden and the output layer are processing elements that contains a non-linear activation function. Each unit carries out the weighted number of their inputs and passes into activation level (uni-polar sigmoid function) to generate their output. A multilayer perceptron may include multiple int-ermediate layers [Samundeswari et al., 2017]. In the proposed approach, the MLP architecture contains 39 nodes in the input layer, only one hidden layer of 20 nodes and 2 nodes in the output layer. The approach uses the feed forward topology.
Fig. 3: Architecture of Multilayer percepron
Support Vector Machine: SVM is one of the classification algorithms, shown good performa- nce in different varieties of classification tasks. SVM is used to classify both linear and nonlinear data [Shrikant Burje et al., 2016]. SVM maps the input data to a high dimensional feature space and a maximum margin hyperplane is const-ructed.
RESULTS AND DISCUSSION
In this work, images of patients are collected for analyzing and evaluating the performance of the classifiers for identifying the lupus. Features are extracted from the images based on color histogram and GLCM in HSV color space. Feat-ure extraction is done using MATLAB software. The classifiers, MLP and SVM (with polynomial kernel) are trained to produce the required output for the given input features. The training and testing are done using 10-fold cross validation. The WEKA tool is used for the classification. The performance indicators, precision, recall, specifi-city and accuracy are used to evaluate to classify the images into SLE (affected) and Non-SLE (normal) to find the performance given by the said classifiers.
Precision
=
TP
/ (
TP
+
FP
)
(2)
Recall
=
TP
/ (
TP
+
FN
)
(3)
Specificity
=
TN
/ (
TN
+
FP
)
(4)(
) / (
)
Accuracy
=
TP TN
+
TP TN
+
+
FP
+
FN
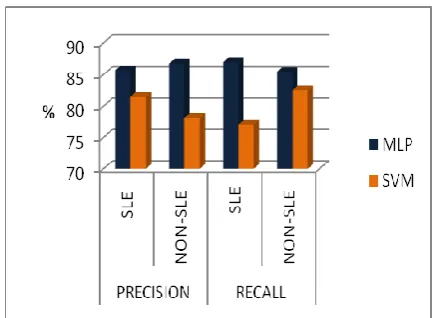
(5)Where TP (True Positive) represents the number of SLE images correctly classified, FP (False Pos-itive) represents the number of SLE images that are misclassified, FN (False Negative) represents the number of Non-SLE images that are miscla-ssified, and TN (True Negative) represents the number of Non-SLE images correctly classified. Performance Evaluation: Table 2 represents the precision and recall values of the classifiers. Figure 4 is graphical representation of Table 2.
One can infer from the figure 4 that MLP outperformed over the other classifier SVM (with Polynomial Kernel).
Table 2: Classifiers with Precision and Recall values CLASSIFIERS PRECISION RECALL
SLE (%)
NON-SLE (%)
SLE (%)
NON-SLE (%)
MLP 85.7 86.8 87.0 85.5
Fig. 4: Classifiers vs. Precision and Recall
The classifiers versus various performance measu-res (sensitivity, specificity and accuracy) are sho-wn in Table 3. From Table 3, one can observe that again MLP outperforms over SVM in all the per-formance measures, namely, sensitivity by 10%, specificity by 3% and accuracy by 7.5%
Figure 5 is the graphical representation of Table 3. From figure 5, one can observe that the MLP provides better classification by means of sensitivity, specificity and accuracy values over SVM. A receiver operating characteristic curve (ROC) is a graphical representation of True Posi-tive Rate (TPR) and False PosiPosi-tive Rate (FPR). The area under the curve (AUC) is a measure such that the classifier correctly classifies the patients with and without SLE.
Table 3: Classifiers versus various performance measures
Classifiers Sensitivity (%)
Specificity (%)
Accuracy value (%) MLP 87.00 85.50 86.25 SVM 77.00 82.50 79.75
Fig. 5: Performance measures (sensitivity, specificity and accuracy) by various classifiers
The ROC curve of MLP is nearer to the left border of the ROC space compared to the ROC curve of SVM. When the ROC curve is closer to the left border of the ROC space, then the classifier gives good accuracy rate. From the figure 6, one can infer that MLP yields better accuracy rate than SVM.
(a) (b)
Fig. 6: Receiver Operating Characteristics Curve for (a) MLP (b) SVM
Table 4 gives AUC values of MLP and SVM classifiers for the classification of images.
Table 4: AUC of ROC by various classifiers
CLASSIFIERS SLE
MLP 0.933
SVM 0.798
Table 4 shows that AUC value of MLP is much higher than SVM. It indicates that MLP classifier yields better classification in classifying images into SLE and Non-SLE than SVM classifier.
CONCLUSION
Cutaneous manifestations provide vital
Non-SLE. MLP shows better performance than the other classifier SVM, yielding maximum accu-racy of 86.25%. If sensitivity, specificity and acc-uracy are considered together, one can conclude that MLP is the better choice than SVM with polynomial kernel.
ACKNOWLEDGEMENT
I thank my supervisor Dr. V. Ramalingam, Professor and Dr. S. Palanivel, Professor, Depart-ment of Computer Science and Engineering, Annamalai University for their guidance and valu-able suggestions throughout the work. I also thank Dr. B. Latha, Head of the Department, Department of Computer Science and Engineering, Sri Sai Ram Engineering College for her continuous sup-port in my work.
CONFLICTS OF INTERESTS All authors have none to declare
REFERENCES
Chen, S., W. Chengdong, D. Chen, W. Tan, Scene classification based on gray level-gradient co-occurrence matrix in the neighbourhood of interest points. IEEE Int. conference on
Intelligent Computing and Intelligent
Systems (ICIS) Pp. 482-485 (2009).
Font, J., Bosch X, Ingelmo M, Herrero C, Bielsa I, Mascaró JM., Acquired icthyosis in a patient with SLED. Arch Dermatology 126: 829 (1990)
Gilliam, JN., Sontheimer RD., Skin manifestati- ons of SLE. Clin Rheum Dis. 8: 207-18 (1982)
Han, J., and K. K. Ma, Fuzzy Color Histogram and Its Use in Color Image Retrieval, IEEE Transactions on Image Processing 11(8): 944-952 (2002).
Hassoun, M.H., Fundamentals of Artificial Neural Networks, Cambridge, MA: MIT Press, (1999).
Kowsigam, M., A. Christy Jebamalar, S. Shobika, R. Roshini, A. Saravanan, Heart disease pre-diction by analysing various parameters using Fuzzy logic. Pak. J. Biotechnol. 14(2): 157-161(2017)
Laman, S.D. and T.T. Provost, Cutaneous mani-festation of SLE. Rheum Dis Clin North Am. 20: 195 (1994).
McCauliffe, D.P., Cutaneous lupus erythemato-
sus. Semin.Cutan.Med.Surg.20:14-26 (2001)
Nanni, L., S. Brahnam, S. Ghidoni, E. Menegatti and T. Barrier, Different Approaches for Ext-racting Information from the Co-Occurrence
Matrix. PLoS One 8(12): e83554 (2013)
Rao, A., R.K. Srihari and Z. Zhang, Spatial Color Histogram for Content Based Image Retrie-val, 11th IJCEM International Journal of Computational Engineering & Management, 13 IEEE International Conference on Tools with Artificial Intelligence 18(3): 183-186 (1999).
Ross F. Walker, Paul T. Jackway and Dennis Longstaff, Genetic algorithm optimization of
adaptive multi-scale GLCM features. Int. J.
Patt. Recogn. Artif. Intell. 17(01): 17-39
(2003).
Samundeswari, S., V. Ramalingam, B. Latha and S. Palanivel, Decision support system for systemic lupus erythematosus using machine
learning techniques. International Journal of
Pharmacy and Technology (2017)
Saravanan, D., Database security incursion recog-nition technique using neural network. Pak.J. Biotechnol. 13(Sp. 2): 130-134 (2016) Shrikant Burje, Sourabh Rungta and Anupam
Shukla, Multiple tumor and infection detect-ion in MRI brain image using SVM classi-fier. Pak. J. Biotechnol. 13(Sp. 2): 101-105 (2016)
Tan, EM., Cohen AS, Fries JF, et al., The 1982 revised criteria for the classification of systemic lupus erythematosus, Arthritis Rheum. 25: 1271-7 (1982).
Zeevi, R., D. Vojvodi, B. Risti, M.D. Pavlović, D. Stefanović and D. Karadaglić, Skin lesions: An indicator of disease activity in SLE? Lupus. 10: 364–367 (2001).