Development and Evolution of a Primary Care–Based
Diabetes Disease Management Program
Robb Malone, PharmD, CDE, CPP; Betsy Bryant Shilliday, PharmD, CDE, CPP; Timothy J. Ives, PharmD, MPH; and Michael Pignone, MD, MPH
H
igh-quality diabetes care can reduce diabetes-related compli-cations and improve quality of life. Evidence from randomized trials, including the U.K. Prospective Diabetes Study and the Diabetes Control and Complications Trial, have shown that tight glucose control can decrease microvascular complications.1,2The Steno 2 trial demonstrated that a multi-factorial approach that includes behav-ioral modification and intensive therapy targeting hyperglycemia, hypertension, and dyslipidemia is effective in reducing progression of microvascular complica-tions among high-risk patients with type 2 diabetes and microalbuminuria.3Other evidence supports the use of aspirin and statins in middle-aged and older patients with diabetes to prevent heart disease.4Translating this evidence into prac-tice has proven to be difficult. National data suggest that a large proportion of patients with diabetes continue to receive suboptimal care and have suboptimal outcomes. Only 7% of adults with dia-betes in National Health and Nutrition Examination Survey from 1999 to 2000 attained a hemoglobin A1c(A1C) < 7%, blood pressure < 130/80 mmHg, and total cholesterol < 200 mg/dl.5Attempts to deliver excellent care face a wide vari-ety of barriers at the patient, provider, and system level. For example, compet-ing demands exist for providers’ time: patients often have needs they feel are more pressing and demand their providers’ attention, whereas providers feel other pressure ranging from time constraints to health maintenance needs.
One potential strategy for overcom-ing the barriers to high-quality care is to
implement structured care programs in clinical settings. Effective structured care programs, sometimes referred to as dis-ease management programs, create an “organized system of care that is tailored to multiple problems of chronic illness,” versus the traditional model of care that is designed to address acute illness.6A recent meta-analysis to assess the impact of these programs on glycemic control in type 2 diabetes found that they were effective, with the greatest efficacy occurring in programs that expanded the role of nonphysician providers to make interventions, particularly medication adjustment.7
In this article, we describe the devel-opment of a primary care–based struc-tured diabetes care program in our aca-demic internal medicine practice. We feel our experience may be helpful to others who are attempting to improve the care of their patients with diabetes.
Our program (now known as the University of North Carolina [UNC] Enhanced Care Diabetes Program) was developed and implemented within the UNC Chapel Hill general internal medi-cine practice. This practice serves a wide socioeconomic range of patients and is staffed by 70 medical residents and > 20 attending faculty, all of whom practice on a part-time basis varying from 1 to 7 half-days per week. In the following sec-tions, we will describe the evolution of the structure, processes, and outcomes of the program, along with some practical lessons learned.
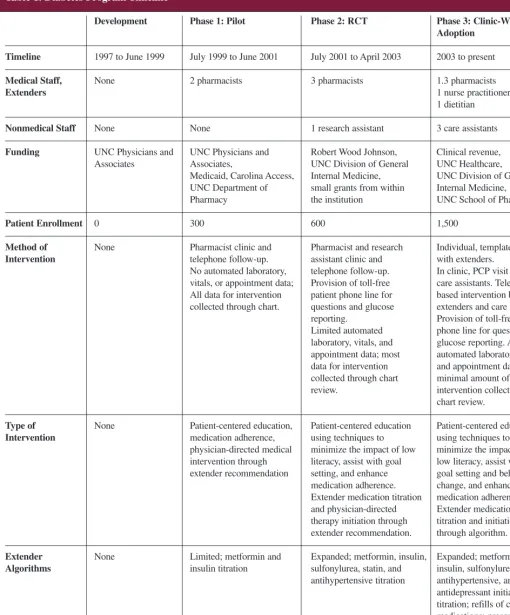
The timeline for our program’s development is shown in Table 1. Before our program’s existence, the clinic cared for diabetes in an ad hoc manner, with
each provider doing his or her best to implement excellent care. The practice used a hybrid information system: an electronic medical record for laboratory results and paper charts for other infor-mation. There was no registry of individ-uals with diabetes, nor did the clinic have ancillary staff for patient education or self-management training.
Beginning in 1998, we have pro-ceeded through three phases of develop-ment. The initial phase involved the development, pilot testing, and revision of the program of structured care. In phase 2, we tested the efficacy of the revised program in a randomized trial. After demonstrating the program’s effi-cacy, phase 3 translated the program throughout the entire practice of > 1,500 patients with diabetes.
Funding for our program during the developmental years was tenuous. Initial funding came from within the health care system. This funding cycle lasted for 1 year. The remainder of funding for the pilot came from the UNC Hospital Department of Pharmacy, UNC Physi-cians and Associates, and North Carolina Medicaid, Carolina Access. The random-ized trial was funded by the Robert Wood Johnson Clinical Scholars Pro-gram, UNC Division of General Internal Medicine, and numerous small grants from within the institution. The program is now funded by the UNC Division of General Internal Medicine, UNC Health-care, UNC School of Pharmacy, and clinical revenue.
Phase 1. Developing and Pilot-Testing the Program
Table 1. Diabetes Program Timeline
Development Phase 1: Pilot Phase 2: RCT Phase 3: Clinic-Wide Adoption
Timeline 1997 to June 1999 July 1999 to June 2001 July 2001 to April 2003 2003 to present
Medical Staff, None 2 pharmacists 3 pharmacists 1.3 pharmacists
Extenders 1 nurse practitioner 1 dietitian
Nonmedical Staff None None 1 research assistant 3 care assistants
Funding UNC Physicians and UNC Physicians and Robert Wood Johnson, Clinical revenue, Associates Associates, UNC Division of General UNC Healthcare,
Medicaid, Carolina Access, Internal Medicine, UNC Division of General UNC Department of small grants from within Internal Medicine,
Pharmacy the institution UNC School of Pharmacy
Patient Enrollment 0 300 600 1,500
Method of None Pharmacist clinic and Pharmacist and research Individual, templated visits
Intervention telephone follow-up. assistant clinic and with extenders.
No automated laboratory, telephone follow-up. In clinic, PCP visit follow-up vitals, or appointment data; Provision of toll-free care assistants. Telephone-All data for intervention patient phone line for based intervention by collected through chart. questions and glucose extenders and care assistants.
reporting. Provision of toll-free patient Limited automated phone line for questions and laboratory, vitals, and glucose reporting. Advanced appointment data; most automated laboratory, vitals, data for intervention and appointment data; collected through chart minimal amount of data for review. intervention collected through
chart review.
Type of None Patient-centered education, Patient-centered education Patient-centered education
Intervention medication adherence, using techniques to using techniques to physician-directed medical minimize the impact of low minimize the impact of intervention through literacy, assist with goal low literacy, assist with extender recommendation setting, and enhance goal setting and behavior
medication adherence. change, and enhance Extender medication titration medication adherence. and physician-directed Extender medication therapy initiation through titration and initiation extender recommendation. through algorithm.
Extender None Limited; metformin and Expanded; metformin, insulin, Expanded; metformin,
Algorithms insulin titration sulfonylurea, statin, and insulin, sulfonylurea, statin, antihypertensive titration antihypertensive, and
tary care during patients’ visits with their primary care provider (PCP) and via telephone. These encounters focused on individualized education and inter-ventions that were adapted to patients’ needs, barriers, and literacy level. Prob-lem-solving exercises, goal setting, and medical intervention were key compo-nents of these encounters. There were no individual appointments with the pharmacists.
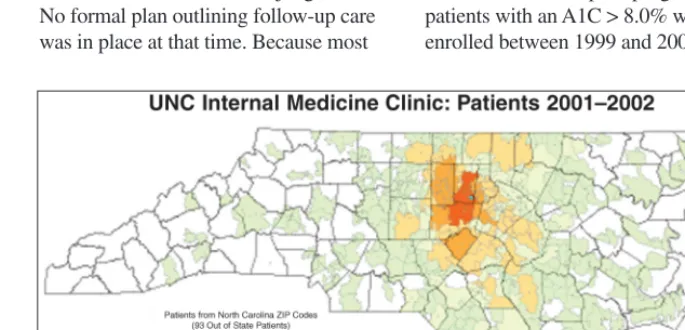
Care was proactive; pharmacists sought patients and recruited them from daily clinic schedules, engaged physi-cians, and placed calls to patients after their visits based on clinical judgment. No formal plan outlining follow-up care was in place at that time. Because most program began in 1998. Representatives
from UNC School of Medicine and the UNC Hospital Department of Pharmacy performed a medical record review that showed that 1,172 uninsured or
Medicaid patients with diabetes accrued $17 million in charges over an 8-month period. A large proportion of these patients were cared for in our practice. At that time, it was estimated that 1,600 of the 11,000 patients in the UNC Internal Medicine practice had a diagno-sis of diabetes. Approximately 66% of these patients were covered by Medicaid or Medicare or were uninsured. This information led to funding of a pilot program to improve care as a means of reducing morbidity and costs.
In the pilot phase, two clinical phar-macists with advanced training were hired to develop and implement an inter-vention. They worked with interested attending physicians and health services researchers to develop the pilot program. Before initiation of the program, a brief root cause analysis was performed (Table 2). A root cause analysis is a problem-solving approach aimed at identifying and intervening in the under-lying cause of a problem or situation ver-sus addressing obvious, intermediate symptoms of a problem.
Based on this analysis, the program was initially structured as follows: the pharmacist provided increased frequen-cy of clinical intervention by clinic-based and telephone contact, streamlin-ing patient access to expert care, increasing intensity of intervention through frequent provider consultation and feedback, focusing on treatment decisions based on best evidence, fre-quently disseminating program out-comes and summaries of data collected, and targeting patients at highest risk for poor outcomes.
A Microsoft Access database was created for the pilot (now referred as the Comprehensive Interactive Patient Health Evaluation Registry [CIPHER]). The system functioned as a registry, data repository, and reminder system. Two pharmacists provided
supplemen-patients live 30–60 miles away, phone calls were a primary focus of care to overcome this barrier (Figure 1). Initially no algorithms existed, and therapeutic interventions were made only through pharmacist recommendations and subse-quent PCP approval. During the pilot, algorithms for diabetes medication titra-tion were developed for glycemic con-trol. These algorithms were based on a combination of guidelines, best evi-dence, and group consensus. Initial algo-rithms included insulin and metformin, allowing pharmacists to titrate these agents.
To evaluate the pilot program, 137 patients with an A1C > 8.0% were enrolled between 1999 and 2000. The Table 2. Root Cause Analysis
Root Causes Actions
• Continuity of care is poor because • Make clinical pharmacists available to providers have limited clinical time. patients daily.
• Patients often miss follow-up . • Call patients to remind them of
appointments. appointments.
• Transportation barriers can hinder care. • Increase phone management. • Physicians lack time and skill to • Pharmacists provide individualized
provide proper diabetes education. education.
• Patients have low education and • Design interventions that do not rely
literacy. on literacy.
• Physicians contribute to clinical inertia • Evidence-based approach to therapy; by failing to escalate therapy. led to development of algorithms. • Tracking of patient outcomes is poor. • Designed computer system to allow
better tracking of patients.
tion,P< 0.0001) and improvements in diabetes-related knowledge and satisfac-tion were also noted.8Improvements in glycemic control were similar to those noted in the pilot phase. We attribute improvements in blood pressure control to more intensive care with aggressive use of evidence-based algorithms. On average, intervention patients were eval-uated 4 times per month versus 1.1 per month for control subjects. Fifty-four percent of intervention patient encoun-ters were via telephone, 26% were in clinic visits, and the other 20% consisted of mailings and medical history
reviews.9
Phase 3. Consensus Development and Clinic-wide Adoption
After the success of the randomized controlled trial, we focused on the chal-lenge of transforming the program from a research-based endeavor into a clinical entity. The results of the trial were pre-sented to the faculty and staff of the practice, and a decision was made to implement the program as the standard of care for all patients with diabetes in our practice.
To expand the program, several key changes were required, including increased staffing, further expansion of algorithms, improved information sys-tems, risk stratification, implementation of automated data transfer, planned fol-low-up, and quality reporting. Our patient population grew from almost 600 patients to 1,500 patients. All patients within our practice who were identified with dia-betes were automatically enrolled in our program. Algorithms were revised and expanded once more, with the addition of algorithms for vaccination administration and statin initiation.
Staffing changes included shifting research assistants to clinic-based educa-tors and care navigaeduca-tors, which we referred to as “care assistants.” These changes were made to derive clinical revenue from individual visits with our pharmacist practitioners, create efficien-cies by pairing appropriately trained staff to perform key interventions, and mean A1C at program enrollment was
10.8%. At 6 months follow-up, the mean reduction in A1C was 1.9% (95% CI 1.5–2.3,P< 0.0001).8The intervention was successful in improving glycemic control, the area for which the pharma-cists could make medication changes, but not for blood pressure control, for which no algorithm existed. After review and discussion with division faculty, consensus was that the program should be expanded to include a larger scope of practice for the pharmacists, including new algorithms for blood pressure con-trol, lipid concon-trol, and initiation of aspirin therapy.
Phase 2. Randomized Controlled Trial
The second phase of our program began in February 2001, when we began enrollment in a randomized, controlled trial to assess the efficacy of our expand-ed disease management program. The database system continued to function mainly as a registry, data repository, and reminder system. The program pharma-cists continued to focus on frequent intervention, both clinic and telephone based, for patients at highest risk.
The most significant changes beyond our algorithms was formalization of flow or follow-up and the addition of a trained, non–health care provider staff member to provide education and facili-tate therapeutic intervention. Algorithms for laboratory monitoring, diabetes durable medical equipment, and refills were added. We also added an algorithm to initiate aspirin therapy. These algo-rithms allowed clinical pharmacists to be more aggressive and addressed what we felt were weaknesses of our previous intervention.
We compared our disease manage-ment program to standard care received by a physician. A total of 194 patients were enrolled in the trial, and at 12 months the intervention group had sig-nificantly greater lowering of systolic blood pressure (29 mmHg; 95% CI
216 to 23) and A1C level (20.8%;
21.7 to 0%). Large increases in aspirin therapy (58% control vs. 91%
interven-improve our ability to care for a larger number of patients. Care assistants are entry-level medical assistants trained by the clinical pharmacist practitioners to address issues related to health behaviors and health education, such as using ver-bal versus written forms of communica-tion and teach-back techniques during education sessions. Care assistants inter-vened with patients in the clinic who were seeing their PCP and via telephone. Care assistants performed basic educa-tion, identified and attempted to resolve barriers, made routine referrals, and downloaded glucose meter readings for the clinicians to interpret. The program continued to be staffed by 1.3 full-time equivalent clinical pharmacist practition-ers and 3 care assistants.
We also made significant strides in improving our information system. After negotiation with a range of key stake-holders throughout our institution, we began to receive data transfers daily from our electronic medical record into the Access database. This data included vital signs, appointment information, and recent laboratory results. These data, in combination with information main-tained in our database, were used to develop detailed printed information sheets that were used on a daily basis to direct care, facilitate communication with the PCP, and give program providers information to use at the point of care.
The database was used to proactively identify patients who had scheduled appointments or who were not receiving appropriate follow-up care. To improve efficiency, we also stratified patients based on risk and developed follow-up plans based on this information (Table 3).
is a model experience that can be repli-cated in other practices.
REFERENCES
1The DCCT Research Group: The effect of
intensive treatment of diabetes on the develop-ment and progression of long-term complications in insulin dependent diabetes mellitus. N Engl J Med329:977–986, 1993
2The U.K. Prospective Diabetes Study Group:
Intensive blood-glucose control with sulphony-lureas or insulin compared with conventional treatment and risk of complications in patients with type 2 diabetes (UKPDS 33). Lancet 352:837–853, 1998
3Gaede P, Vedel P, Parving HH, Pedersen O:
Intensified multifactorial intervention in patients
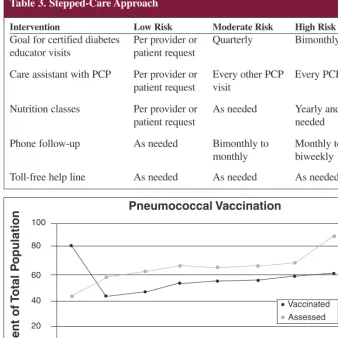
depression screening (Figure 2). Recent interventions include assessment of both ophthalmalogical and vaccination status of all patients, automated referral for dilated retinal exams, and nurse-driven administration of pneumococcal vaccination.
Conclusions
Structured care programs in clinical set-tings can overcome barriers to high quality care. We feel the primary care–based structured care program in our academic internal medicine practice
with type 2 diabetes mellitus and microalbumin-uria: the STENO type 2 randomized study.
Lancet353:617–622, 1999
4Heart Protection Study Group: MRC/BHF
Heart Protection Study of cholesterol lowering with simvastatin in 20,536 high-risk individuals: a randomized placebo controlled trial. Lancet 360:7–22, 2002
5Saydah SH, Franklin J, Cowie CC: Poor
con-trol of risk factors for vascular disease among adults with previously diagnosed diabetes. JAMA 291:335–342, 2004
6Bodenheimer T, Wagner EH, Grumbach K:
Improving primary care for patients with chronic illness. JAMA288:1775–1779, 2002
7Shojania KG, Ranji SR, McDonald KM,
Grimshaw JM, Sundaram V, Rushakoff RJ, Owens DK: Effects of quality improvement strategies for type 2 diabetes on glycemic control: a meta-analysis. JAMA296:427–440, 2006
8Rothman RL, Malone R, Bryant B, Shintani
AK, Crigler B, Dewalt DA, Dittus RS, Weinberg-er M, Pignone MP: A randomized trial of a pri-mary care-based disease management program to improve cardiovascular risk factors and glycated hemoglobin levels in patients with diabetes. Am J Med118:276–284, 2005
9Rothman RL, So SA, Shin J, Malone RM,
Bryant B, Dewalt DA, Pignone MP, Dittus RS: Labor characteristics and program costs of a suc-cessful diabetes disease management program. Am J Manag Care 12:277–283, 2006
Robb Malone, PharmD, CDE, CPP, is the assistant medical director of General Internal Medicine, an assistant professor of medicine, and an assistant clinical professor of pharmacy; Betsy Bryant Shilliday, PharmD, CDE, CPP, is an assistant professor of medicine and an assistant clinical professor of pharmacy; and Timothy J. Ives, PharmD, MPH, is an associate professor of pharmacy and a clinical associate professor of medi-cine in the University of North Carolina Department of Medicine, Division of General Internal Medicine and Clinical Epidemiology in Chapel Hill. Michael Pignone, MD, MPH, is an associate pro-fessor of medicine and associate chief of the Division of General Internal Medi-cine at the same institution. He is also
an associate editor of Clinical Diabetes.
Table 3. Stepped-Care Approach
Intervention Low Risk Moderate Risk High Risk
Goal for certified diabetes Per provider or Quarterly Bimonthly
educator visits patient request
Care assistant with PCP Per provider or Every other PCP Every PCP visit patient request visit
Nutrition classes Per provider or As needed Yearly and as
patient request needed
Phone follow-up As needed Bimonthly to Monthly to
monthly biweekly
Toll-free help line As needed As needed As needed
Figure 2. Example of a run chart from current intervention.
Jan-06 Feb-06 Mar-06 Apr-06 May-06 Jun 06 Jul-06 Aug-06 100
80
60
40
20
0
Pneumococcal Vaccination
P
er
cent
of
T
ot
al
P
opulat
ion