United Kingdom Vol. IV, Issue 5, May 2016
Licensed under Creative Common Page 468
http://ijecm.co.uk/
ISSN 2348 0386
MARKET DETERMINANTS OF EXPORT PERFORMANCE
AMONG SMES IN THE EXPORT SECTOR
Michael Allan
Lecturer, Department of Marketing, Central University, Ghana [email protected]
Abstract
In this paper, we screen for the market determinants of export performance among SMEs in the
export sector in Ghana. We use Exploratory Factor Analysis to screen for constructs of the
determinants and reduce the data to fewer variables using a quantitative research technique. A
sample size of 45 SMEs is used. Stepwise linear regression analysis is used to examine the
relationship between each determinant and export performance. The market determinants of
export performance are product features, price, market targeting, distribution and promotion.
These factors significantly predict export performance at 5% significance level (p < .05), with
98.8% of the total variation contributed. “Product features” is the most dominant determinant
relative to other factors, with a variability of 92% accounted by it. Consequently, SMEs in the
export sector need to improve the effectiveness of their marketing activities along the lines of
product/brand packaging, pricing, market targeting, distribution and promotion.
Keywords: Marketing, market determinants, export performance, export sector, SMEs
INTRODUCTION
Licensed under Creative Common Page 469 appropriate, suitable and sustainable marketing practices and principles. Leonidas et al. (2002, p. 55) argue that sustainable marketing practices and principles are those in harmony with the general market determinants of business performance.
Market determinants of business performance are simply the various marketing strategies and practices of the firm (Kotler and Armstrong, 2006; 2010). The expected characteristics of these determinants are their suitability and appropriateness in terms of the type of products and services and the dynamism in the taste and behaviour of target consumers (Kotler and Armstrong, 2010). These determinants are said to be implemented elements of the marketing mix, which involves product, pricing, promotion and distribution. Over the years, little attention has been given to how each of these determinants influences the performance of individual firms and sectors (Dueñas-Caparas, 2006; Brodrechtova, 2008), especially those making the largest impact on economic growth (Brodrechtova, 2008). In view of this argument, this study seeks to identify the market determinants of export performance among firms in Ghana.
Licensed under Creative Common Page 470 context of export business in Ghana. This paper creates an avenue for communicating empirical evidence about the need to boost export performance in Ghana by embarking on rigorous and formal marketing in the sector.
Objective of the Study
The study identifies the market determinants of export performance among SMEs in the export sector in Ghana. The paper unveils factors of marketing which SMEs in the export sector must consider in achieving desired business performance. The paper contributes to academic debate on the subject and enlarges the public’s knowledge on marketing determinants of export performance in a Ghanaian context. This study gives directions for conducting future research on the subject considering the fact that very few related studies exist on it.
LITERATURE REVIEW
Globally, export of goods and services is considered a major source of economic growth and employment. Hence economists would give priority to exports relative to imports because it favours balance of trade, exchange rate and gross domestic growth (GDP). There is however a school of thought that the expected impact of exports on exchange rate, balance of trade and the economy depends on the appropriateness of the marketing practice of export firms. Egyir et al. (2010) also argue that export is only possible when foreign buyers are willing to patronise goods and services of the local export firms. The willingness of foreign consumers to buy these services and goods depend on the marketing strategy of the local export firms. Naturally therefore, export businesses cannot sell if they are not able to secure foreign customer patronage by virtue of good marketing strategy. This argument forms the basis of the effect of market factors on export performance. Yet, other evidence exists.
Licensed under Creative Common Page 471 for exported goods and services. According to Kotler and Armstrong (2010), this marketing strategy is a combination of all marketing determinants of business growth.
The marketing determinants of export performance are mainly items of the marketing mix (Kotler and Amstrong, 2006; 2010). Leonidou et al. (2002) are among the few researchers to identify these determinants, which are market targeting, nature of product, price, distribution and promotion. Market targeting is composed of market concentration, market spreading and market segmentation. Product features (that is, nature of product) is a factor made up of product/brand design, quality, branding, packaging/labelling, customer service, warranty, newness/uniqueness of product, product mix and product adaptation. Price is the third market determinant composed of pricing method, pricing strategy, sales terms, credit policy, currency strategy and price adaptation. Distributors/agents, sales representatives/office, merchants, direct buying, dealer support, delivery time and distribution adaptation make up distribution. Finally, advertising, sales promotion, personal selling, trade fairs, personal visits and promotion adaptation make up promotion.
A personal survey of related studies (for example, Ayan and Percin, 2005; Adjei-Sasu and Agyir, 2010; Egyir et al., 2012; Boansi et al., 2014) shows that these determinants remain the same from one jurisdiction to another, though a few of them have been given different names in some studies. For instance ―market targeting‖ has been referred to in some studies as ―market orientation‖ and ―market approach‖. This difference does not dilute or nullify the effect of the marketing determinants of export performance. Clearly, the empirical evidence points to one direction in all identifiable studies: drivers of export performance. With reference to Table 1, this evidence is not limited to one country or geographical area. The gap this study seek to fill in this paper is to provide empirical evidence from a Ghanaian point of view since related studies for this country are scarce. Moreover, the few studies available in a Ghanaian context have been limited to specific sectors such as Agriculture and the Arts (Adjei-Sasu and Egyir, 2010; Egyir et al., 2012; Boansi et al., 2014).
Table 1: Major Related Studies by Country and Geographical Region Author(s) Year Country Geographical region Sector
Adjei-Sasu, F. & Egyir, I.S. 2010 Ghana Africa
Agriculture; Horticulture Ayan, T.Y. & Percin, S. 2005 Turkey Europe General Boansi, D.,
OdilonKounagbéLokonon, B.
Licensed under Creative Common Page 472 Brodrechtova, Y. 2008 Slovakia Europe Agriculture Carneiro, J., da Rocha, A. &
da Silva, S.F. 2011 Brazil South America
Manufacturing; multinationals
Dueñas-Caparas, M. T. S. 2006 Philippine Asia
Manufacturing; arts and production
Edwards, L. & Alves, P. 2005
South
Africa Africa General
Egyir, I.S., Mensah, E. C. &
Agyei-Sasu, F. 2010 Ghana Africa
Agriculture; Horticulture Moghaddam, F.M., Hamid, A.
B. B. A., Rasid, C.S.A. &
Darestani, H. 2011 Iran Asia General
Oyeniyi, O. 2009 Nigeria Africa General Leonidou, L.C., Katsikeas,
C.S. & Samiee, S. 2002 Cyprus Europe General
Based on the empirical evidences identified on the subject, it is expected that all determinants, referred to as factors, to significantly affect export performance. The argument is that export performance is significantly influenced by marketing determinants in Ghana. The null and alternative hypotheses are phrased as follows.
Hypotheses
H0: Not all identifiable market factors significantly influence market performance among SMEs in
Ghana’s export sector.
H1: All identifiable market factors significantly influence market performance among SMEs in
Ghana’s export sector.
METHODOLOGY
The study employed a quantitative research technique in view of the need to test the hypotheses using inferential statistical tools. The general population of the study was SMEs in the export sector of Ghana. Yet, specifically information was solicited from Accra-based SMEs that have been in the export business for at least 5 years and could be contacted for information. The SMEs in Accra were used owing to lack of prior information about SMEs outside Accra and to make access to participants easier. Also, participating SMEs were required to have been in the export business for at least 5 years to ensure that their responses were driven by substantial experience in the sector.
Licensed under Creative Common Page 473 A sample of 45 heads of the chosen SMEs (out of 95 in the target population) was used. This sample was determined using information from the Ghana Export Promotion Authority. The sample of participants was chosen using the balloting method of the simple random sampling technique. In essence, the sample size chosen was suitable to the resources available for the project and the total target population. In view of the appropriateness of the sampling theory of Krejcie and Morgan (1970), using the simple random sampling method makes the sample size sufficiently random and representative of the population.
Data was collected using a administered questionnaire. By using the self-administered questionnaire, response was made easier for participants since this type of instrument used had guidelines for respondents. Using the self-administered questionnaire also made it possible to collect data by hand delivery and e-mail, depending on which option a participant preferred. Export Performance and its determinants were measured using a scale and procedure by Leonidou et al. (2002). This scale and procedure was used because all recent related studies have used them to reach good and reliable findings. Moreover, the scale and procedure constitute an updated version of what existed. Although these scale and procedure were used, the study ensured that reliability and validity measures were taken. For instance, the questionnaire was submitted to a few research experts to review. After data collection, SPSS was used to test for the instrument’s reliability and obtained a Cronbach’s alpha of 0.921, which is an indicator of its strong reliability.
SPSS Version 21 is used for data analysis owing to the robustness of this new version. Exploratory Factor Analysis (EFA) is used to screen for items of the determinants and to reduce data to a size that could be handled without complications. The hypothesis of the study is tested using stepwise linear regression analysis to examine the effect of each determinant or factor on Export Performance.
ANALYSIS AND RESULTS
Licensed under Creative Common Page 474 Table 2: Shapiro-Wilk’s Test
Variable Statistic N p-value
Export performance 0.342 45 0.643
Targeting 0.121 45 0.872
Product features 0.322 45 0.543
Price 0.211 45 0.764
Distribution 0.209 45 0.783
Promotion 0.123 45 0.879
Table 2 shows results of the Shapiro-Wilk’s test of normality. The default null hypothesis of this test is that data associated with each variable in the table is normally or approximately normally distributed. To test this hypothesis, 5% significance level was used. At this level of significance, the null hypothesis is retained for each variable since p < .05 in each case. Thus the higher the p-value, the more normally distributed the data associated with the variable is. Therefore, all data employed in this study are normally distributed. This implies that a basis is established for reaching valid conclusions.
One key characteristic of the data used in this study is the fact that it is associated with many manifest variables at the level of ―Determinants‖. In the light of this feature of the data, the researcher deemed it important to shrink the data with respect to ―Determinants‖ variable to ease its analysis and to remove potentially trivial manifest variables from it. The Exploratory Factor Analysis (EFA) was used to achieve this goal (Tables 3 and 4).
Table 3: KMO & Bartlett’s Tests
KMO .892
Bartlett's Chi-square 132.33
Sig. .000
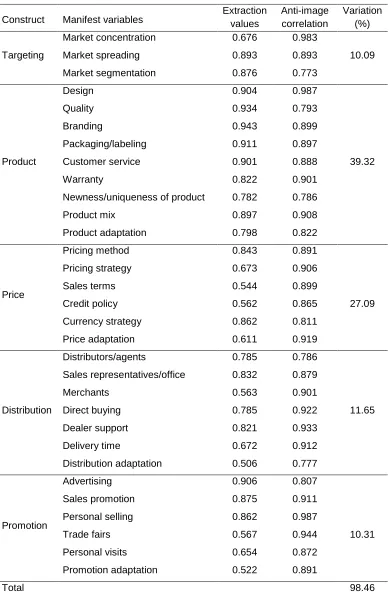
Licensed under Creative Common Page 475 Table 4: Factor Analysis Key Statistics
Construct Manifest variables Extraction values Anti-image correlation Variation (%)
Targeting
Market concentration 0.676 0.983
Market spreading 0.893 0.893 10.09 Market segmentation 0.876 0.773
Product
Design 0.904 0.987
Quality 0.934 0.793
Branding 0.943 0.899
Packaging/labeling 0.911 0.897
Customer service 0.901 0.888 39.32
Warranty 0.822 0.901
Newness/uniqueness of product 0.782 0.786
Product mix 0.897 0.908
Product adaptation 0.798 0.822
Price
Pricing method 0.843 0.891 Pricing strategy 0.673 0.906 Sales terms 0.544 0.899
Credit policy 0.562 0.865 27.09 Currency strategy 0.862 0.811
Price adaptation 0.611 0.919
Distribution
Distributors/agents 0.785 0.786 Sales representatives/office 0.832 0.879
Merchants 0.563 0.901
Direct buying 0.785 0.922 11.65 Dealer support 0.821 0.933
Delivery time 0.672 0.912 Distribution adaptation 0.506 0.777
Promotion
Advertising 0.906 0.807
Sales promotion 0.875 0.911 Personal selling 0.862 0.987
Trade fairs 0.567 0.944 10.31 Personal visits 0.654 0.872
Promotion adaptation 0.522 0.891
Licensed under Creative Common Page 476 Table 4 shows the latent variables to which ―Determinants‖ data has been reduced to. ―Determinants‖ is originally made up of 31 manifest variables. By using the EFA, these variables are reduced to 5 constructs or latent variables. The extraction values indicate how much a latent variable is related to by a manifest variable. The higher the extraction value the stronger the relationship between a construct and the manifest variable associated with it. The variation (%) is the amount of variability accounted by a factor relative to ―Determinants‖. In this regard, ―Product features‖ account for the highest variability of 39.3% in ―Determinants‖, followed by ―Price‖, whereas ―Targeting‖ accounts for the lowest amount of variability.
The EFA model is very strong because a total of 98.4% of the variation is accounted. The extent to which each construct of ―Determinants‖ predicts EP using a linear regression analysis is investigated below.
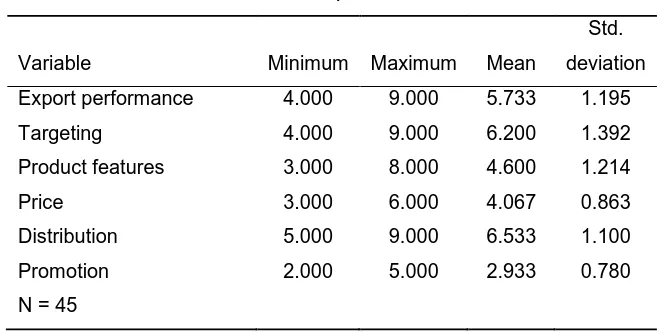
Table 5: Descriptive Statistics
Variable Minimum Maximum Mean
Std. deviation Export performance 4.000 9.000 5.733 1.195 Targeting 4.000 9.000 6.200 1.392 Product features 3.000 8.000 4.600 1.214 Price 3.000 6.000 4.067 0.863 Distribution 5.000 9.000 6.533 1.100 Promotion 2.000 5.000 2.933 0.780 N = 45
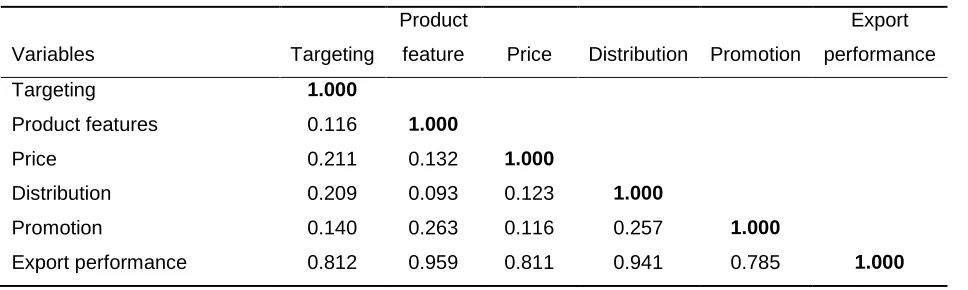
Licensed under Creative Common Page 477 Table 6: Correlation Matrix
Variables Targeting
Product
feature Price Distribution Promotion
Export performance
Targeting 1.000
Product features 0.116 1.000
Price 0.211 0.132 1.000
Distribution 0.209 0.093 0.123 1.000
Promotion 0.140 0.263 0.116 0.257 1.000
Export performance 0.812 0.959 0.811 0.941 0.785 1.000
Table 6 shows the correlation matrix of latent variables in Table 5. From the table, each construct is positively correlated to EP at 5% significance level. Yet, product features has the highest correlation to EP (r = .959), followed by distribution (r = .941). Generally, EP is highly correlated to each construct, a situation that justifies the fact that EP is determined by the five latent variables extracted in the EFA.
In the next analysis, the constructs that predict EP is examined. But before this is done, there is the need to be sure that the predictors are not excessively correlated. Results in Table 7 help to find out if this requirement is satisfied.
Table 7: Collinearity Diagnostics
Statistic Targeting
Product
features Price Distribution Promotion Tolerance 0.879 0.105 0.181 0.178 0.236 VIF 2.594 7.575 5.510 6.321 4.244
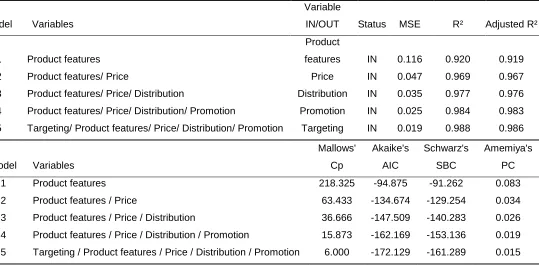
Licensed under Creative Common Page 478 Table 8: Extracted Predictors per Model
Model Variables
Variable
IN/OUT Status MSE R² Adjusted R²
1 Product features
Product
features IN 0.116 0.920 0.919 2 Product features/ Price Price IN 0.047 0.969 0.967 3 Product features/ Price/ Distribution Distribution IN 0.035 0.977 0.976 4 Product features/ Price/ Distribution/ Promotion Promotion IN 0.025 0.984 0.983 5 Targeting/ Product features/ Price/ Distribution/ Promotion Targeting IN 0.019 0.988 0.986
Model Variables
Mallows' Cp
Akaike's AIC
Schwarz's SBC
Amemiya's PC
1 Product features 218.325 -94.875 -91.262 0.083
2 Product features / Price 63.433 -134.674 -129.254 0.034 3 Product features / Price / Distribution 36.666 -147.509 -140.283 0.026 4 Product features / Price / Distribution / Promotion 15.873 -162.169 -153.136 0.019 5 Targeting / Product features / Price / Distribution / Promotion 6.000 -172.129 -161.289 0.015
Table 8 shows significant predictors of EP. From the table, the first predictor of EP is product features. In the second model, price is added as a significant predictor of EP. By observing the fifth model, one can see that all the constructs formed in the EFA are significant predictors of EP. This means that product features, price, distribution, promotion and targeting are the drivers of EP (i.e. Export performance). Table 9 shows the overall summary of the model.
Table 9: Model Summary Observations 45.000
Df 39.000
R² 0.988
Adjusted R² 0.986
Licensed under Creative Common Page 479 Table 10: ANOVA
Source Df
Sum of squares
Mean
squares F P value Model 5 62.048 12.410 643.624 .000 Error 39 0.752 0.019
Corrected
Total 44 62.800
Table 10 is an ANOVA test associated with the regression of EP from the five predictors. The goal of this test is to find out if the regression analysis has aided an improvement in the prediction of EP by the five constructs formed in the EFA. This enquiry is embarked on at 5% significance level. From the table, the ANOVA test is significant at the chosen significance level, F (5, 39) = 643.6, p = .000. This means that the linear regression analysis has empowered the study to predict EP. Table 11 shows the model parameters of the linear regression analysis.
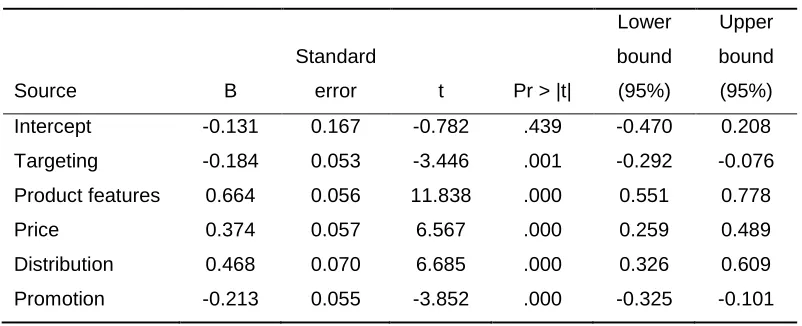
Table 11: Model Parameters
Source B
Standard
error t Pr > |t|
Lower bound (95%)
Upper bound (95%) Intercept -0.131 0.167 -0.782 .439 -0.470 0.208 Targeting -0.184 0.053 -3.446 .001 -0.292 -0.076 Product features 0.664 0.056 11.838 .000 0.551 0.778 Price 0.374 0.057 6.567 .000 0.259 0.489 Distribution 0.468 0.070 6.685 .000 0.326 0.609 Promotion -0.213 0.055 -3.852 .000 -0.325 -0.101
Licensed under Creative Common Page 480
DISCUSSION
The market determinants of export performance among SMEs in Ghana are product features, price, market targeting, distribution and promotion. This finding is not a new development as it has been reached in previous studies. Moreover, the evidence can be traced to various geographical areas such as Europe (Leonidou, et al. 2002; Ayan and Percin, 2005; Brodrechtova, 2008), Africa (Adjei-Sasu and Egyir, 2010; Boansi et al. 2014; Edwards and Alves, 2005; Egyir, et al., 2010; Oyeniyi, 2009) and Asia (Moghaddam et al., 2011; Dueñas-Caparas, 2005). Although the survey of related studies may not have exhausted all studies, it covers a good number of the world’s geographical regions. Generally, the spread of this result indicates that the effect of these factors on export performance is not limited to a particular country or jurisdiction. Our analysis show that all identifiable market factors significantly influence market performance among SMEs in Ghana’s export sector.
Our hypotheses for the research were stated as follows:
H0: Not all identifiable market factors significantly influence market performance among SMEs in
Ghana’s export sector.
H1: All identifiable market factors significantly influence market performance among SMEs in
Ghana’s export sector.
We accordingly reject H0 and accept H1.
In the Ghanaian context, the determinants have been confirmed from the studies of Adjei-Sasu and Egyir (2010), Boansi et al. (2014) and Egyir, et al. (2010), though SMEs in specific subsectors were used in these studies. With reference to Table 1, these Ghanaian studies were focused on export of horticulture products. Hence previous evidence were only limited to horticulture or Agricultural products. With this study, it is evident that these determinants apply to export of other products in the SMEs sector. Since the export sector in Ghana is largely made up of SMEs, it is obvious our result reflects an industry-wide situation.
Licensed under Creative Common Page 481
CONCLUSION AND RECOMMENDATIONS
The market determinants of export performance are identified in the study. The determinants found are product features, price, market targeting, distribution and promotion. These determinants are originally made up of 31 manifest variables. Yet, EFA reduces them to 5 constructs or latent variables. ―Product features‖ account for the highest variability of 39.3%, followed by ―Price‖, whereas ―Targeting‖ accounts for the lowest amount of variability. The EFA model is very strong because a total of 98.4% of the variation is accounted. Clearly, all items used to measure ―Determinants‖ of export performance are retained but are reduced to 5 latent variables to make data analysis easier.
Product features, price, market targeting, distribution and promotion significantly predict export performance at 5% significance level (p < .05), with 98.8% of the total variation contributed by all determinants. Thus no predictor is removed in the stepwise regression analysis. The first predictor in the stepwise regression analysis is ―Product features‖, with a variability of 92% accounted by it. If the five predictors account for a total variation of 98.8% and ―Product features‖ alone accounts for 92% of the variation, then ―Product features‖ could be seen as a dominant determinant of export performance relative to the other predictors. Invariably, ―Product features‖ makes the highest effect on export performance relative to the other determinants. Clearly, the findings provide support for the alternative hypothesis that all identifiable market determinants significantly influence market performance among SMEs in Ghana’s export sector. The null hypothesis (H0), that not all identifiable factors significantly
influence market performance among SMEs in Ghana’s export sector, is therefore rejected. Practically therefore, SMEs in the export sector need to improve the effectiveness of their marketing activities along the lines of product/brand packaging, pricing, market targeting, distribution and promotion. By so doing, they are likely to maximise their growth and financial sustainability. Since this study is one of the very few conducted on the subject from a Ghanaian context, researchers are encouraged to conduct more related studies. Future researches are also encouraged to introduce a comparative analysis of the subsectors (that is, agro products, arts, minerals, and so on) of the export sector in Ghana to identify how the effects of these determinants may differ from one sub-sector to another.
REFERENCES
Licensed under Creative Common Page 482 Ayan, T.Y. & Percin, S. (2005). A Structural Analysis of the Determinants of Export Performance: Evidence from Turkey, Innovative Marketing, 1 (2): 106-118.
Boansi, D., Odilon Kounagbé, Lokonon, B. & Appah, J. (2014). Determinants of Agricultural Export Trade: Case of Fresh Pineapple Exports from Ghana, British Journal of Economics, Management & Trade, 4 (11): 1736-1754.
Brodrechtova, Y. (2008). Determinants of export marketing strategies of forest products companies in the context of transition — The case of Slovakia, Forest Policy and Economics, 10: 450–459
Carneiro, J., da Rocha, A. & da Silva, S. F. (2011). Determinants of Export Performance: a Study of Large Brazilian Manufacturing Firms, Curitiba, 8 (2): 107-132.
Dueñas-Caparas, M. T. S. (2006). Determinants of Export Performance in the Philippine Manufacturing Sector, Discussion Paper Series, No. 2006 - 18, Philippine Institute for Development Studies, pp. 3-23. Edwards, L. & Alves, P. (2005). South Africa’s Export Performance: Determinants of Export supply, Africa Region Working Paper Series No. 95, pp. 11-50.
Egyir, I.S., Mensah, E.C. & Agyei-Sasu, F. (2012). Factors Influencing the Intensity of Export Success in Ghaha’s Horticultural Industry, International Journal of Business, Humanities and Technology, 2 (7): 115-120.
Gilaninia, S., Monsef, S. M. S, & Mosaddegh, L. (2013). Effective factors on export performance, Singaporean Journal of Business Economics, and Management Studies, 1 (11): 8-12.
Kotler, P. & Armstrong, G. (2010). Principles of Marketing, 13th Edition, Pearson.
Kotler P. & Armstrong, G. (2006). Principles of Marketing: An introduction. 10th International Edition. New Jersey.
Krejcie, R. V. & Morgan, D. W. (1970). Determining sample size for research activities, Educational and Psychological Measurement, 30: 607-610.
Lages, L. F. (2000). A Conceptual Framework of the Determinants of Export Performance, Reorganising Key Variables and Shifting Contingencies in Export Marketing, Journal of Global Marketing, 13 (2): pp.29-51.
Leonidou, L.C., Katsikeas, C.S. & Samiee, S. (2002). Marketing strategy determinants of export performance: a meta-analysis, Journal of Business Research, 55: 51– 67.
Moghaddam, F. M., Hamid, A. B. B. A., Rasid, C. S. A. & Darestani, H. (2011). The Influence of Export Marketing Strategy Determinants on Firm Export Performance: A Review of Empirical literatures between 1993-2010, International Journal of Fundamental Psychology & Social Sciences, 1 (2): 26-34.
Oyeniyi, O. (2009). Effect of Marketing Strategy on Export Performance: Evidence from Nigerian Export Companies / Annals of University of Bucharest, Economic and Administrative Series, Paper No. 3, pp. 249-261.
Protogerou, A., Caloghirou, Y. & Lioukas, S. (2011). Dynamic Capabilities and Their Indirect Impact on Firm Performance, DRUID Working Paper No. 08-11, pp. 2-38.
Rugami, J. M. & Aosa, E. (2013). Environmental dynamic capabilities and their effect on competitive advantage and firm performance, Prime Journal of Business Administration and Management (BAM), 3 (11): 1239-1243.
Sousa, C. M. P. (2004). Export Performance Measurement: An Evaluation of the Empirical Re-search in the Literature, Academy of Marketing Science Review, 9: 2-19.
Tuu, H. H. & Olsen, S. O. (2013). Marketing Barriers and Export Performance: A Strategy Categorization Approach in the Vietnamese Seafood Industry, Asian Journal of Business Research, 3 (1): 66-80.
Licensed under Creative Common Page 483
APPENDIX
Table 12. Manifest Variables of Study Constructs
Construct Sub-construct Manifest variables
Marketing determinants
Targeting
Market concentration Market spreading Market segmentation
Product
Design Quality Branding
Packaging/labeling Customer service Warranty
Newness/uniqueness of product Product mix
Product adaptation
Price
Pricing method Pricing strategy Sales terms Credit policy Currency strategy Price adaptation
Distribution
Distributors/agents
Sales representatives/office Merchants
Direct buying Dealer support Delivery time
Distribution adaptation
Promotion
Advertising Sales promotion Personal selling Trade fairs Personal visits
Promotion adaptations
Export performance
Sales
Export sales volume Export sales growth Export sales intensity
Profit Export profit levels Export profit contribution
Market share Export market share