Accelerating Process Improvement Using Agile Techniques
Deb Jacobs ISBN: 0-8493-3796-8
Advanced Server Virtualization: VMware and Microsoft Platforms in the Virtual Data Center
David Marshall, Wade A. Reynolds and Dave McCrory ISBN: 0-8493-3931-6
Antipatterns: Identification, Refactoring, and Management
Phillip A. Laplante and Colin J. Neill ISBN: 0-8493-2994-9
Applied Software Risk Management: A Guide for Software Project Managers
C. Ravindranath Pandian ISBN: 0849305241
The Art of Software Modeling
Benjamin A. Lieberman ISBN: 1-4200-4462-1
Building Software: A Practitioner’s Guide Nikhilesh Krishnamurthy and Amitabh Saran ISBN: 0-8493-7303-4
Business Process Management Systems
James F. Chang ISBN: 0-8493-2310-X
The Debugger’s Handbook
J.F. DiMarzio ISBN: 0-8493-8034-0
Effective Software Maintenance and Evolution: A Reuse-Based Approach
Stanislaw Jarzabek ISBN: 0-8493-3592-2
Embedded Linux System Design and Development
P. Raghavan, Amol Lad and Sriram Neelakandan ISBN: 0-8493-4058-6
Flexible Software Design: Systems Development for Changing Requirements
Bruce Johnson, Walter W. Woolfolk, Robert Miller and Cindy Johnson
ISBN: 0-8493-2650-8
Global Software Development Handbook
Raghvinder Sangwan, Matthew Bass, Neel Mullick, Daniel J. Paulish and Juergen Kazmeier
ISBN: 0-8493-9384-1
The Handbook of Mobile Middleware
Paolo Bellavista and Antonio Corradi ISBN: 0-8493-3833-6
Implementing Electronic Document and Record Management Systems
Azad Adam ISBN: 0-8493-8059-6
Process-Based Software Project Management
F. Alan Goodman ISBN: 0-8493-7304-2
Service Oriented Enterprises
Setrag Khoshafian ISBN: 0-8493-5360-2
Software Engineering Foundations: A Software Science Perspective
Yingxu Wang ISBN: 0-8493-1931-5
Software Engineering Quality Practices
Ronald Kirk Kandt ISBN: 0-8493-4633-9
Software Sizing, Estimation, and Risk Management
Daniel D. Galorath and Michael W. Evans ISBN: 0-8493-3593-0
Software Specification and Design: An Engineering Approach
John C. Munson ISBN: 0-8493-1992-7
Testing Code Security
Maura A. van der Linden ISBN: 0-8493-9251-9
Six Sigma Software Development, Second Edition
Christine B. Tayntor ISBN: 1-4200-4426-5
Successful Packaged Software Implementation
Christine B. Tayntor ISBN: 0-8493-3410-1
UML for Developing Knowledge Management Systems
Anthony J. Rhem ISBN: 0-8493-2723-7
X Internet: The Executable and Extendable Internet
Jessica Keyes ISBN: 0-8493-0418-0
Other Auerbach Publications in
Software Development, Software Engineering,
and Project Management
AUERBACH PUBLICATIONS
www.auerbach-publications.com
Manage
Software
Testing
Peter Farrell-Vinay
Boca Raton New York
Auerbach Publications Taylor & Francis Group
6000 Broken Sound Parkway NW, Suite 300 Boca Raton, FL 33487-2742
© 2008 by Taylor & Francis Group, LLC
Auerbach is an imprint of Taylor & Francis Group, an Informa business
No claim to original U.S. Government works
Printed in the United States of America on acid-free paper 10 9 8 7 6 5 4 3 2 1
International Standard Book Number-10: 0-8493-9383-3 (Hardcover) International Standard Book Number-13: 978-0-8493-9383-9 (Hardcover)
This book contains information obtained from authentic and highly regarded sources. Reprinted material is quoted with permission, and sources are indicated. A wide variety of references are listed. Reasonable efforts have been made to publish reliable data and information, but the author and the publisher cannot assume responsibility for the validity of all materials or for the consequences of their use.
No part of this book may be reprinted, reproduced, transmitted, or utilized in any form by any electronic, mechanical, or other means, now known or hereafter invented, including photocopying, microfilming, and recording, or in any informa-tion storage or retrieval system, without written permission from the publishers.
For permission to photocopy or use material electronically from this work, please access www.copyright.com (http:// www.copyright.com/) or contact the Copyright Clearance Center, Inc. (CCC) 222 Rosewood Drive, Danvers, MA 01923, 978-750-8400. CCC is a not-for-profit organization that provides licenses and registration for a variety of users. For orga-nizations that have been granted a photocopy license by the CCC, a separate system of payment has been arranged.
Trademark Notice: Product or corporate names may be trademarks or registered trademarks, and are used only for identification and explanation without intent to infringe.
Library of Congress Cataloging-in-Publication Data
Farrell-Vinay, Peter.
Manage software testing / Peter Farrell-Vinay. p. cm.
ISBN-13: 978-0-8493-9383-9 (alk. paper) ISBN-10: 0-8493-9383-3 (alk. paper)
1. Computer software--Testing. 2. Computer software--Evaluation. I. Title. QA76.76.T48F37 2008
005.3028’7--dc22 2007008293
Visit the Taylor & Francis Web site at http://www.taylorandfrancis.com and the Auerbach Web site at
Contents
List of Figures ... xi
List of Tables ... xvii
Preface ...xix
1
Introduction...11.1 Conclusions... 1
1.2 What Has This Got to Do With Software? ... 1
1.3 If It Isn’t Planned, It Won’t Happen ... 2
1.4 Let’s Not Test... 2
1.5 Something to Do When You Really Hit Opposition... 5
1.6 Conventions ... 7
1.7 Apologies ... 8
1.8 Some Basics... 8
1.9 The Players ... 11
1.10 Quality Assurance and Quality Control ... 14
1.11 Processes, Tools, Products, and Standards ... 15
2
The Big Questions You Need Answers To ...172.1 Why Do We Test?... 17
2.2 How Do We Test? ... 18
2.3 When Do We Start Testing? ... 18
2.4 When Do We Stop Testing? ... 20
2.5 What Do We Test it Against? ... 21
2.6 What Do We Test it With? ... 22
2.7 Are We Getting Better or Worse at Finding Bugs?... 22
2.8 How Do We Measure Our Test Coverage? ... 26
2.9 Are There Any More Embarrassing Questions? ... 28
3
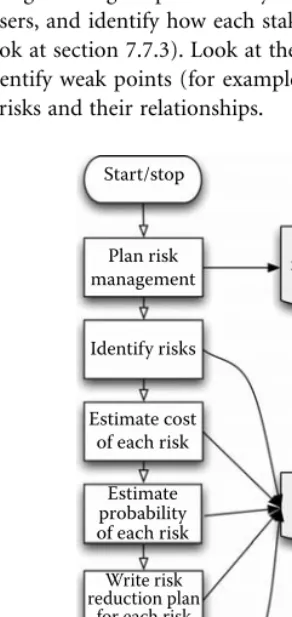
Risk Management ...293.1 How to Manage Risk ... 30
3.2 A Worked Example... 35
3.3 Hazard Analyses and Testing ... 37
4
Test Planning and Management ...394.1 Testing Principles ... 39
4.2 Laws ... 41
4.3 Test Management Principles ... 42
4.4 Life-Cycles and Four-Wheel-Drive Karmas... 43
4.5 Starting from Where You Are ... 56
vi Manage Software Testing
5
Testing and the Web ...655.1 How Websites Work ... 66
5.2 Website Risks and Problems ... 67
5.3 Web Test Planning ... 69
5.4 Web Performance... 71
5.5 Web Tests... 72
5.6 Monitoring Issues ... 82
6
The Overall Test Life-Cycle...836.1 Initiation Phase ... 83
6.2 Requirements Analysis Phase... 85
6.3 Architectural Definition Phase ... 87
6.4 Coding and Unit Testing... 88
6.5 Software/Hardware Integration ... 88
6.6 Test Readiness Review ... 89
6.7 System-Testing Phase... 89
6.8 Beta Testing ... 90
6.9 Certification- or Acceptance-Testing Phase ... 90
6.10 Documentation, Help, and Training Phase ... 91
6.11 Install, Coexist, Cutover, Support, and Evolution Phase ... 91
7
Testing Processes and Infrastructure...937.1 Initiation... 93
7.2 Keeping the Configuration Management System in Order... 94
7.3 Test Environment... 96
7.4 Test Automation... 97
7.5 Monitoring Test Progress ... 101
7.6 Bug Management Process and Tool ... 101
7.7 Operational Profiles... 109
7.8 Static Analyzers ... 115
7.9 Dynamic Analyzers ... 119
8
Test Documents ...1258.1 General ... 125
8.2 Requirements Specification... 125
8.3 Test Strategy Document ... 130
8.4 Interface Specification ... 132
8.5 Test Plan ... 133
8.6 Test Monitoring Document ... 142
8.7 Test Design Specification ... 148
8.8 Test Case Specification ... 149
8.9 Test Procedure Specification ... 151
8.10 Release Note ... 152
8.11 Test Log ... 153
8.12 Bug Report ... 154
8.13 Test Summary ... 156
8.14 Usability Test Summary ... 157
8.15 Acceptance Certificate ... 158
8.16 Security Risk Analysis Report ... 158
8.17 Risk Log... 160
8.18 Daily Test Report ... 160
8.19 Reporting Using TestDirector™ (now Quality CentER) ... 162
8.20 Choosing a Set of Test Documents ... 166
8.21 Quality Plan ... 167
9
The Test Team and Its Context...171Contents vii
9.2 Test Qualifications ... 175
9.3 Test Team Structures ... 175
9.4 Assessing the Test Team ... 176
9.5 Motivating the Test Team... 177
9.6 Career Progression... 177
9.7 Relations ... 178
9.8 The Politics of Testing ... 185
10
Outsourcing ...18710.1 Dangers of Outsourcing... 187
10.2 Process of Outsourcing ... 187
10.3 Backsourcing Considerations... 202
10.4 Testing Proprietary Software... 203
11
Test Techniques: Functional (Black-Box) ...20511.1 Equivalence Partitioning ... 205
11.2 Boundary-Value Analysis ... 205
11.3 Cause–Effect Graphing... 206
11.4 Random Data Selection... 207
11.5 Feature Test Process... 208
12
Test Techniques: Structural (White-Box) ...20912.1 Statement Coverage ... 209
12.2 Decision (Branch) Coverage ... 209
12.3 Condition Coverage... 210
12.4 Path Analysis ... 211
12.5 All-DU-Paths Coverage ... 213
12.6 Execution-Time and Resource-Use Analysis ... 213
12.7 Algorithm Analysis ... 213
12.8 Linear Code Sequence and Jump (LCSAJ) ... 214
12.9 Dynamic Analysis Techniques ... 215
12.10 Derivative Techniques ... 217
13
Test Techniques: Static Analysis...21913.1 Static Dataflow Analysis ... 220
13.2 Dataflow Bugs ... 221
13.3 Control-Flow Analysis ... 221
13.4 Function Value Analysis ... 222
13.5 Symbolic Execution ... 223
13.6 Mutation Testing... 222
13.7 Mutation Testing Problems... 223
13.8 Fault Injection... 224
13.9 Test Data Generators ... 228
13.10 Failure Mode Effects and Criticality Analysis... 229
14
Unit Test Process...23114.1 Managing Unit Testing ... 231
14.2 Purpose of Unit Testing ... 231
14.3 Identify the Test Baseline ... 232
14.4 Identify Unit Characteristics... 233
14.5 Unit Test Development ... 235
14.6 Why the System Test Group Should (Not) Unit Test ... 237
14.7 What We Have to Do to Unit Test ... 238
viii Manage Software Testing
15
System and Acceptance Testing ...24315.1 System Test Process (Figure 15.1) ... 243
15.2 Plan the System Tests ... 246
15.3 Design and Code the Tests... 250
15.4 System Test Coverage ... 254
15.5 Is It Worth All This Work?... 256
15.6 Test Support Software and Tools... 260
15.7 Regression Testing... 260
15.8 Localization Testing ... 261
15.9 System Integration and Operations Testing ... 262
15.10 Non-Functional Testing ... 262
15.11 Conduct a Test Readiness Review ... 272
15.12 Beta Testing Process... 273
15.13 Acceptance Testing... 274
15.14 Test a Build... 275
15.15 Monitor the Test Process... 277
15.16 Report ... 280
15.17 Agree That the Release is Ready ... 280
16
Performance and Stress Testing...28116.1 General ... 281
16.2 Service Level Agreements ... 281
16.3 Performance Testing: Tool Use ... 282
16.4 Performance Testing: Requirements... 283
16.5 What is the Baseline for Performance Tests? ... 283
16.6 Performance Testing: Process... 284
16.7 Stress Testing ... 285
16.8 Reliability Testing... 287
17
Usability Test Process ...28917.1 Why We Should Usability Test... 289
17.2 When Should We Usability Test?... 289
17.3 What is the Baseline for UI Tests?... 290
17.4 How to Usability Test ... 290
17.5 Readability Indices... 296
17.6 Task Analysis ... 297
17.7 Who Is Involved in Usability Testing?... 298
17.8 How Will We Know if We’ve Usability-Tested Successfully? ... 299
17.9 What It’ll Cost Us to Usability Test... 300
17.10 Why We Shouldn’t Usability Test ... 301
17.11 Usability-Testing Deliverables... 301
17.12 Usability Test Specification ... 302
17.13 Usability Test Warnings... 304
18
Metrics...30518.1 Functionality Metrics ... 305
18.2 Testability... 309
18.3 Performance Metrics ... 312
18.4 Resilience (Robustness) Metrics ... 316
18.5 Usability Metrics ... 320
18.6 Reliability... 324
18.7 Availability... 327
18.8 Maintainability Metrics ... 329
18.9 Process Metrics ... 331
18.10 Estimates of Bugs in the System... 338
18.11 Function Point Metric... 351
18.12 Test Case Estimation ... 354
Contents ix
18.14 Some Metrics from the “Real” World ... 360
18.15 Multiple Regression Analysis ... 361
A
Examples ...365A.1 Case Study: Getting Test Objectives Out of a Use Case ... 365
A.2 Case Study: Withdraw Cash Use Case ... 365
A.3 Case Study: Getting Test Objectives Out of Business Rules... 370
A.4 Case Study: Test Coverage... 373
A.5 Example: Requirements Traceability Using TestDirector™ ... 379
A.6 Example: How to Get a Report Out of TestDirector ... 379
A.7 Case Study: Performance Testing (Throughput) ... 386
A.8 Case Study: Performance Testing (Bottlenecks and Critical Variables)... 389
A.9 Example: End-of-System-Test Report ... 399
A.10 Example: Test Function Report ... 404
A.11 Case Study: Testing a Formal Requirements Specification (TransitCard Ticketing System)... 406
B
Checklists ...417B.1 Test Manager’s Terms of Reference ... 417
B.2 What Test Managers Do Checklist ... 420
B.3 Communication, Team Compatibility, and Motivation Checklist... 424
B.4 Bid Review Checklist ... 424
B.5 Requirements Analysis Checklist ... 424
B.6 Risk Management Checklist... 426
B.7 Test Planning Checklists... 427
B.8 Quality Review Checklist ... 429
B.9 Localization Checklist ... 429
B.10 Safety Testing Checklist... 430
B.11 Security Testing Checklist ... 433
B.12 Usability Checklist ... 437
B.13 Web Issues Checklist... 440
B.14 Performance Checklists ... 442
B.15 Coding and Unit Testing Review Checklist ... 446
B.16 Software–Software Integration Test Review Checklist ... 447
B.17 System Test Review Checklist ... 448
B.18 Operations Acceptance Checklist ... 448
B.19 Metrics Checklist ... 451
B.20 Very Wonderful New Approaches Checklist... 451
C
Category and Priority Classifications for Bug Reporting...453C.1 Purpose... 453
C.2 Classification by Category... 454
C.3 Classification by Severity Approach 1... 454
C.4 Classification by Severity Approach 2... 455
C.5 Beizer’s Taxonomy ... 455
C.6 Bug Severity Calculation Matrix ... 456
D
Tools ...457D.1 Automated Testing Tools... 457
D.2 Dynamic Analysis Tools ... 457
D.3 Executable UML Tools ... 458
D.4 Formal Methods’ Tools... 458
D.5 Localization Links... 458
D.6 Metrics Tools... 459
D.7 Performance-Testing Tools... 459
D.8 Risk Tools ... 460
x Manage Software Testing
D.11 Static Analysis Tools ... 461
D.12 Unit Testing ... 462
D.13 Web Tools ... 462
D.14 Web Usability Test Tools and Facilities ... 463
D.15 Web Security ... 463
D.16 Other Tools... 463
Glossary ...467
Abbreviations Used ... 467
Terms Used ... 470
References...513
Books and Papers ... 513
Related Standards ... 520
List of Figures
Figure 1.1 Found and fixed bug detection chart ...6
Figure 1.2 Overall bug detection profile...6
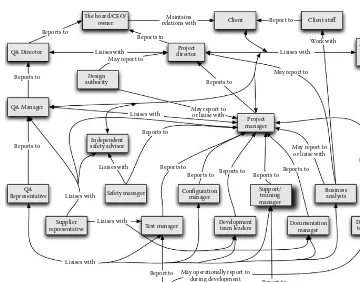
Figure 1.3 Project roles and relations ...14
Figure 2.1 Which is the buggiest feature?...25
Figure 3.1 A risk management process...30
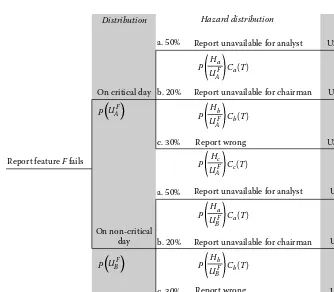
Figure 3.2 Hazard/consequence decision tree ...34
Figure 3.3 Hazard analysis process...38
Figure 4.1 The waterfall model ...43
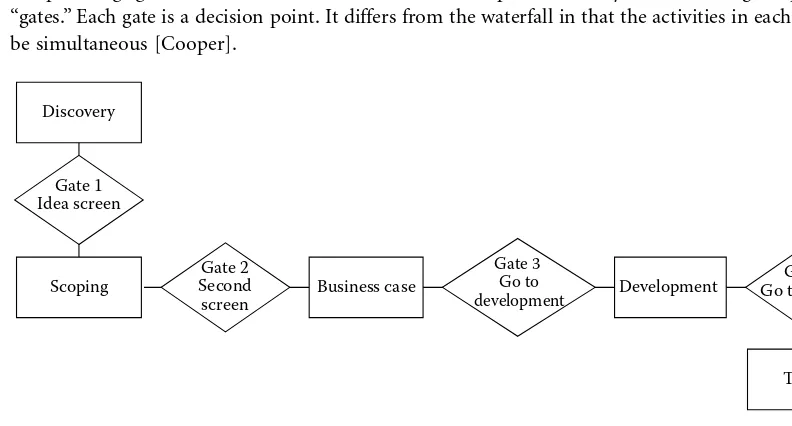
Figure 4.2 Cooper’s stage-gate process model ...44
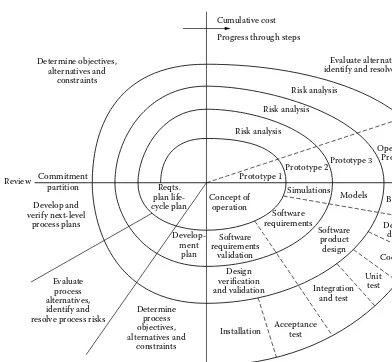
Figure 4.3 Boehm’s spiral life-cycle model ...46
Figure 4.4 UP phases and models ...49
Figure 4.5 Standard UML models and supporting diagrams ...50
Figure 4.6 The “Display Options” point of the “Withdraw Cash” use case...51
Figure 4.7 Executable UML (xUML) process model A ...52
Figure 4.8 Executable UML (xUML) process model B ...52
Figure 4.9 Executable UML (xUML) process model C ...53
Figure 4.10 Formal methods process model ...55
Figure 4.11 A bug detection curve of a project which is a long way from release ...62
Figure 4.12 Release readiness shown in terms of a bug curve...62
Figure 5.1 A typical web architecture ...66
Figure 5.2 Web interactions...66
Figure 5.3 Web test architecture...72
Figure 5.4 Payment processing...76
Figure 5.5 Simple reliability block diagram ...79
Figure 5.6 Probabilities of failure...80
Figure 6.1 A test process ...84
Figure 6.2 A PERT chart of the system definition phase ...85
Figure 6.3 An untestable requirement (just what contains what?) ...87
Figure 7.1 Item acceptance review process...94
Figure 7.2 Bug management process ...102
Figure 7.3 Cumulative bugs chart ...104
Figure 7.4 Chart showing cumulative bugs and fixes...105
xii Manage Software Testing
Figure 7.6 Chart showing cumulative bugs found, split out by priorities...105
Figure 7.7 Chart showing bugs found and bugs predicted...106
Figure 7.8 Proportions of system tests run on 5 features ...106
Figure 7.9 Proportion of units executed with and without bugs ...106
Figure 7.10 Quality gate effectiveness...108
Figure 7.11 Bug detection effectiveness ...109
Figure 7.12 Bug injection...109
Figure 7.13 Product use process model...111
Figure 7.14 Key input variable matrix ...113
Figure 7.15 Example of a test tool reference listing ...115
Figure 7.16 Example of a tool management summary ...116
Figure 7.17 Extract from a test path analysis listing showing an LCSAJ ...116
Figure 7.18 Faulty decision coverage evaluation...116
Figure 7.19 Structured program verification definition (ADA) ...117
Figure 7.20 Example of complexity analysis output...117
Figure 7.21 Example of a procedure call summary...118
Figure 7.22 Example of dataflow analysis error messages ...118
Figure 7.23 Example of parameter analysis output ...119
Figure 7.24 Example of the output of a cross-referencer...120
Figure 7.25 Example of statement coverage summary (TER 1)...121
Figure 7.26 Example of branch execution profile...121
Figure 7.27 Example of branch execution summary...121
Figure 7.28 Example of test path execution profile ...122
Figure 7.29 Example of test path execution summary...122
Figure 8.1 Example of a user manual ...126
Figure 8.2 Example of a requirements specification ...127
Figure 8.3 Example of where to insert new requirements ...127
Figure 8.4 Requirements specification table of contents...129
Figure 8.5 Alternative boilerplate test plan specification of suspension criteria (severity)...136
Figure 8.6 Alternative boilerplate test plan specification of suspension criteria (type) ...137
Figure 8.7 Boilerplate test plan specification of resumption criteria ...137
Figure 8.8 Boilerplate test plan specification of system test ending criteria ...137
Figure 8.9 Boilerplate test plan specification of handover meeting and release note contents ...139
Figure 8.10 The raster display controller block diagram ...139
Figure 8.11 A HOOD diagram for a raster display controller...140
Figure 8.12 An integration tree ...141
Figure 8.13 Key to the preceding figure ...142
Figure 8.14 Document status tab ...142
Figure 8.15 RFC list tab ...143
Figure 8.16 Test status tab ...143
Figure 8.17 Test events log tab ...144
Figure 8.18 Crash log tab...144
Figure 8.19 Weekly bug report count tab...144
Figure 8.20 Test execution status ...145
Figure 8.21 Overall bug detection profile...146
Figure 8.22 Open and closed critical bug reports...146
List of Figures xiii
Figure 8.24 Build quality profile expressed as a proportion...147
Figure 8.25 Feature stability profile ...148
Figure 8.26 Kiviat diagram of task/bug status per release ...157
Figure 8.27 Acceptance test certificate ...158
Figure 8.28 Bug detection chart ...161
Figure 8.29 Bug sources ...162
Figure 10.1 Identify outsource project process model A...189
Figure 10.2 Identify outsource project process model B...190
Figure 10.3 Find the supplier process model A ...191
Figure 10.4 Find the supplier process model B ...192
Figure 10.5 Find the supplier process model C ...193
Figure 10.6 Tell them what you want process model ...195
Figure 10.7 Make a release...198
Figure 10.8 Supplier creates and tests a build...200
Figure 10.9 Customer accepts a release ...201
Figure 10.10 Plan structure ...203
Figure 11.1 Data ranges ...205
Figure 11.2 Cause–effect graph constructs...206
Figure 11.3 Cause–effect graph example ...207
Figure 11.4 Cause–effect identification ...207
Figure 11.5 A cause-and-effect graph ...207
Figure 11.6 Example of a cause–effect decision chart...208
Figure 12.1 A simple program ...211
Figure 12.2 A program tree ...211
Figure 12.3 Logically infeasible paths ...212
Figure 12.4 A control control-flow diagram ...212
Figure 12.5 Example of instrumented code ...216
Figure 12.6 Example of expanded, instrumented code ...217
Figure 13.1 Static control-flowgraph ...220
Figure 13.2 Dynamic control-flowgraph ...220
Figure 13.3 ADA program listing...221
Figure 13.4 Code fragment...222
Figure 13.5 Code fragment rewritten ...222
Figure 13.6 Code before mutation...223
Figure 13.7 Code with a mutation check ...223
Figure 13.8 Bug propagation ...224
Figure 13.9 Assertion demonstrating a bug ...225
Figure 13.10 Confidence-level equation ...225
Figure 13.11 Fault-injection process ...227
Figure 13.12 A TAN function...229
Figure 13.13 Failure mode effects and criticality analysis form ...229
Figure 14.1 Classes and subclasses ...233
Figure 15.1 System test process ...244
Figure 15.2 A raw assertion in a requirements specification ...252
Figure 15.3 An analyzed assertion ...252
Figure 15.4 A not-very-useful test objective ...253
xiv Manage Software Testing
Figure 15.6 System test definition details ...254
Figure 15.7 System test operator actions...254
Figure 15.8 System test pass–fail criteria ...254
Figure 15.9 “Open” screen ...258
Figure 15.10 “Open” screen rendered on a spreadsheet...258
Figure 15.11 Feature/feature interaction example ...259
Figure 15.12 Feature/feature interaction matrix example...259
Figure 15.13 eCommerce architecture example...263
Figure 15.14 Task/objective matrix example ...272
Figure 15.15 Bugs found in three projects expressed as percentages ...279
Figure 16.1 Performance testing environment...283
Figure 16.2 Performance test process model...286
Figure 16.3 Relationship between response time and throughput...287
Figure 17.1 Exploration phase process ...291
Figure 17.2 Inception phase process ...293
Figure 17.3 Execution phase process ...295
Figure 17.4 Evaluation phase process ...296
Figure 18.1 Performance influence table: data entry...313
Figure 18.2 Performance influence table: determining the variable outcomes ...313
Figure 18.3 Performance influence table: determining the instance factors...314
Figure 18.4 Performance influence table: determining the primary variables ...315
Figure 18.5 Performance influence table: identifying the most important primary variable ...316
Figure 18.6 A system modeled as a Markov chain ...318
Figure 18.7 A system modeled as a Markov chain with probabilities...318
Figure 18.8 A system modeled as a Markov chain with probabilities after 4 iterations...319
Figure 18.9 The iterations converge the values...320
Figure 18.10 Example of a maintainability comparison of three applications; none of them is improving, although efforts are sporadically made ...329
Figure 18.11 Bugs found and fixed overall...332
Figure 18.12 Mean age of bugs ...333
Figure 18.13 Mean age of open bugs example chart...333
Figure 18.14 Code turmoil from August to November...336
Figure 18.15 Bug data showing the phase in which each is created and found...337
Figure 18.16 Bug data showing how the bug removal effectiveness of each phase is calculated...337
Figure 18.17 Bug detection effectiveness chart ...338
Figure 18.18 What happens to an out-of-control project 1...340
Figure 18.19 What happens to an out-of-control project 2...340
Figure 18.20 Bug prediction spreadsheet ...342
Figure 18.21 Adding the raw bug data ...348
Figure 18.22 Echoing and preparing the raw bug data ...348
Figure 18.23 Preparing the predicted and actual data ...349
Figure 18.24 The Weibull curve (also known as the probability density function) ...350
Figure 18.25 Bug severity distribution...350
Figure 18.26 Bug severity distribution source data ...351
Figure 18.27 Features and tests ...354
Figure 18.28 A typical unit ...355
List of Figures xv
Figure 18.30 Multiple regression: data input ...361
Figure 18.31 Multiple regression: calculations...362
Figure 18.32 Multiple regression: equations ...362
Figure 18.33 Multiple regression: substitution...363
Figure 18.34 Linear multiple correlation coefficients...363
Figure 18.35 Multiple determination coefficient of bugs...363
Figure A.1 Use-case diagram for the Withdraw Cash use case ...365
Figure A.2 Withdraw Cash activity diagram...366
Figure A.3 UML Sequence diagram example “Withdraw Cash” ...367
Figure A.4 UML Sequence diagram example “Handle Authentication Failures” ...368
Figure A.5 UML Sequence diagram example “Handle the Bank Refusing the Withdrawal”...369
Figure A.6 A business rule in a hierarchy ...371
Figure A.7 A simple set of use cases for Word ...374
Figure A.8 Example: Word “File” Pulldown…is transformed into: ...374
Figure A.9 Example: Word “File” Pulldown, specified…and the resulting screen:...375
Figure A.10 Example: Word “Project Gallery” screen…is also specified: ...375
Figure A.11 Example: Word “Project Gallery” screen, specified...375
Figure A.12 Word top-level menus and contents shown as a UML activity diagram...376
Figure A.13 State transition diagram showing user-initiated events within the Project Gallery screen ...376
Figure A.14 Example of a scenario/object cross-reference ...377
Figure A.15 TestDirector™ Test Schedule pane ...378
Figure A.16 Tests and Scenarios worksheet ...378
Figure A.17 TestDirector Test Steps pane...378
Figure A.18 Scenario prerequisites and end states ...379
Figure A.19 TestDirector™ Test Details pane ...379
Figure A.20 TestDirector™ Design Steps pane ...380
Figure A.21 TestDirector™ Test Schedule pane ...380
Figure A.22 TestDirector™ Test Runs pane ...380
Figure A.23 TestDirector™ (Test Plan tab) ...381
Figure A.24 TestDirector™ (Filter window) ...381
Figure A.25 TestDirector™ (Filter Condition window) ...381
Figure A.26 TestDirector™ (Save Filter window) ...382
Figure A.27 TestDirector™ (Reports pull-downs)...382
Figure A.28 TestDirector™ (Planning Reports window) ...382
Figure A.29 TestDirector™ (Subject Tree Report window) ...383
Figure A.30 TestDirector™ (Tests with Design Steps Report window) ...383
Figure A.31 TestDirector™ (Tests with Covered Requirements window) ...383
Figure A.32 TestDirector™ (Tests with Associated Defects window) ...384
Figure A.33 TestDirector™ (Report Configuration button) ...384
Figure A.34 TestDirector™ (Custom Fields button) ...384
Figure A.35 TestDirector™ (Custom Fields window) ...385
Figure A.36 TestDirector™ (Generate a Report button)...385
Figure A.37 TestDirector™ (Save All Pages of a Report pull-down) ...385
Figure A.38 TestDirector™ (Save window) ...385
Figure A.39 Scenario lists ...386
xvi Manage Software Testing
Figure A.41 Daily transaction profile ...387
Figure A.42 Performance test environment ...388
Figure A.43 Performance test report ...388
Figure A.44 Performance test report ...389
Figure A.45 BizRool architecture ...391
Figure A.46 BREng5 increase the number of variables...394
Figure A.47 Performance testing results...395
Figure A.48 BizRool performance glossary...396
Figure A.49 Test environment 1...397
Figure A.50 Test environment 2...397
Figure A.51 Test environment 3...397
Figure A.52 Bugs raised by severity ...400
Figure A.53 Bugs raised by features...400
Figure A.54 Bugs raised and closed overall...401
Figure A.55 Feature quality ...404
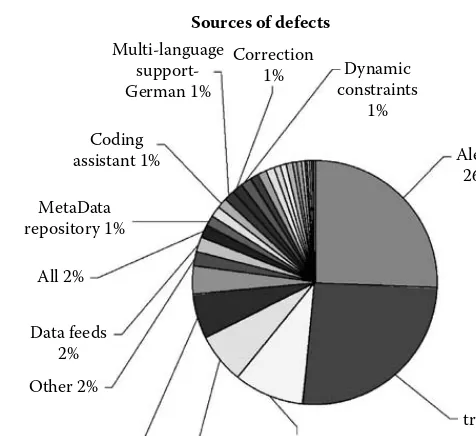
Figure A.56 Sources of bugs...404
Figure A.57 Release history ...405
Figure A.58 Release interval analysis ...405
Figure A.59 Bug-finding ability of test environments ...405
Figure A.60 Bug resolution ...406
Figure A.61 Ticketing subsystem documentation structure ...407
Figure A.62 TransitCard Charger...407
Figure A.63 2 Access controller and card reader unit system diagram...408
Figure A.64 2 Access controller and card reader unit functional diagram...408
Figure A.65 State machine view of the TransitCard...411
Figure B.1 FTA symbols ...433
List of Tables
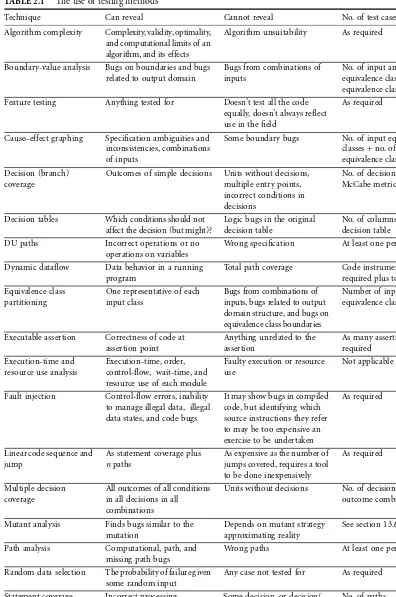
Table 2.1 The use of testing methods ...19
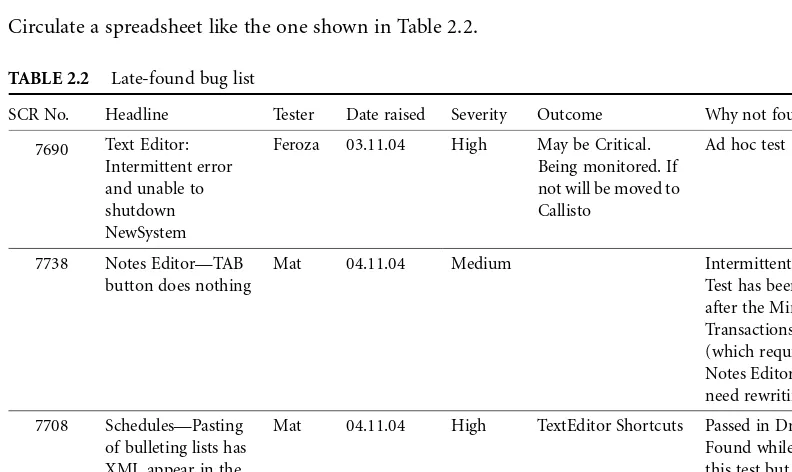
Table 2.2 Late-found bug list ...23
Table 2.3 Identifying whether testing or development is affecting quality ...25
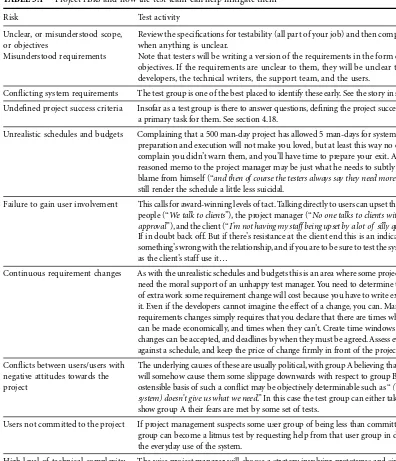
Table 3.1 Project risks and how the test team can help mitigate them...33
Table 3.2 Hazard/consequence...33
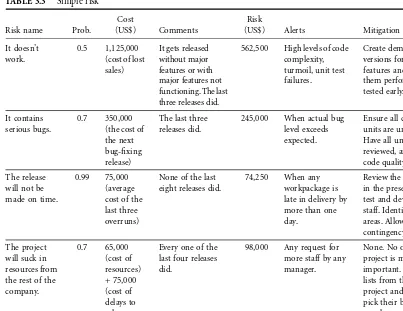
Table 3.3 Simple risk ...36
Table 3.4 Cost of risk mitigation...37
Table 4.1 Complaints made about a failing test function ...58
Table 5.1 Web test approaches...68
Table 7.1 Where the bugs spring from...108
Table 7.2 Where the bugs were caught ...109
Table 7.3 Where the bugs were created and caught...109
Table 7.4 Sample user profile...110
Table 7.5 Sample system-mode profile ...111
Table 7.6 Sample explicit functional profile ...112
Table 7.7 Scenario probability of occurrence for an employment agency...113
Table 8.1 A requirements notation of GUI objects ...128
Table 8.2 Boilerplate test plan introduction ...134
Table 8.3 Boilerplate test plan specification of suspension criteria ...136
Table 8.4 A bug report ...155
Table 8.5 Risk log example...161
Table 10.1 Outsourcing threats and mitigations ...188
Table 12.1 Output of a path analysis tool ...213
Table 13.1 Confidence levels ...226
Table 14.1 Average coefficients of object-oriented metrics ...234
Table 14.2 Unit-testing arguments ...237
Table 15.1 Analysis of effort on six major projects ...247
Table 15.2 Effort expended on the CFC project ...248
Table 15.3 Bugs per unit reported by Endres...248
Table 15.4 Bug detection rates on the CFC project ...249
Table 15.5 Faults discovered in each phase reported by Lipow ...249
xviii Manage Software Testing
Table 15.7 Example chart plotting the system attributes against the various system tests
which most exercise that attribute ...255
Table 15.8 Example chart plotting the system features against the various system tests...256
Table 15.9 Regression test candidate examples ...261
Table 15.10 Web testing combinations spreadsheet...264
Table 15.11 A project status table...277
Table 17.1 Cost of usability testing example ...300
Table 17.2 RoI on usability calculation...301
Table 17.3 Usability RoI calculation...301
Table 17.4 Usability specification ...303
Table 18.1 MTTF Example ...317
Table 18.2 The iterations converge the values...319
Table 18.3 Coexistence metrics...328
Table 18.4 Example of a coexistence metric: some interference between applications B and D is evident...328
Table 18.5 Code turmoil data key ...335
Table 18.6 Code turmoil data ...336
Table 18.7 Bug density of four releases...339
Table 18.8 IBM data on bug types ...345
Table 18.9 ICL data on bug types ...345
Table 18.10 Binomial distribution example...346
Table 18.11 Albrecht weightings...353
Table 18.12 McCormack’s project statistics ...361
Table A.1 Withdraw cash test ...369
Table A.2 Use case glossary ...370
Table A.3 Transaction mix...398
Table A.4 Test application characteristics...398
Table A.5 Number of users/license ...398
Table A.6 Current bug status...401
Table A.7 Overall bugs predicted and found ...401
Table A.8 Bug levels in some previous releases...401
Table A.9 Functional Specifications for Wave 1...403
Table A.10 Interfaces of the ticketing system...409
Table A.11 Constraints...409
Table A.12 System test of “Enter A Station” ...416
Table B.1 BS ISO/IEC 17799: 2000 Information Technology Code of Practice for Information Security Management Test checklist ...437
Preface
This book is written for:
• Testers who want to become test managers and need to get a new perspective on all the things they already know.
• Test managers who want answers to some very pressing questions all in one place.
• Project managers who want to know what they should expect from their test team, what they can do with it, and what it will mean.
• Quality assurance staff who want to know what to look for in a testing environment and how to measure it when they find it.
• Lecturers who realize that test management is another critical role which can mean the difference between success and failure on a project, and which might form the basis of a new course. • Investment analysts who want to know what might go wrong with their investments, why, and
how to stop it.
• Project office staff who want to know how to integrate the information they get from the test team. • Auditors fed up with being pilloried by the Public Company Accounting Oversight Board and
worried that something about Sarbanes–Oxley might have escaped them.
It is intended to pull together a lot of issues to give a strategic, risk-based management view of testing and how it relates to every stakeholder involved. In particular it is focused on lifting readers above the testing battlefield, concerned with the what and how of bug finding but also looking at the why.
The book’s structure is as follows:
• The Introduction and Chapter 2 set out the issues. The issues are simple and so are the questions underlying them. The answers to those questions must be equally simple to be useful. Getting the answers isn’t simple and that’s why a lot of this book is devoted to how the test manager gets answers and interprets them.
• Chapter 3 begins the discussion of risk, which carries on throughout the book.
• Chapter 4 tells you how to plan and manage tests, and discusses possible starting points. • Chapter 5 looks at web testing.
• Chapter 6 puts testing into the context of several life-cycle models.
• Chapter 7 and Chapter 8 look at the things you must do and have ready for use, your tools,
processes, and support systems, your eyes and ears, the kinds of testing you may need to do, and
the documents you need to work with.
• Chapter 9 examines the test team in its context, who they interact with, how, and why.
• Chapter 10 looks at the problems of outsourcing, third-party service provisions, and how to accept a release.
xx Manage Software Testing
• Chapter 14 covers unit testing and why it will save you time and money by reducing risk during system testing.
• Chapter 15 through Chapter 17 go into system, performance, and usability testing.
• Chapter 18 deals with the issues needing to be backed by metrics. Metrics are only useful if they answer a question. I have tried to put all the basic questions in and give you worked examples to show how to get the answers. I’ve put in the equations to show the basis, but where things have got complex I have put some of the equations in Excel spreadsheet format.
• Appendix A contains examples of reports and plans as well as case studies.
• Appendix B contains checklists with questions you need answers to in more detail. Although this book is not concerned with reviews, inspections, or audits, these may prove useful in either. • Appendix C contains approaches to categorizing bugs.
• Appendix D lists tools.
• References, a glossary, and the index are located at the back of the book.
Managing testing is like managing a battle. Part of the time you need to fight the battle and part of the time you need to be above the battle, thinking. Thinking above the battle requires that you ask questions. If you don’t ask the right questions, you will never get the answers. The answers must help you and the test team do something. At the back of my head I hear the voice of an awkward Highland-Scottish project manager asking, “Aye, but what does it buy me?”
It’s a good question and this is an answer.
Assumptions
This book has been written with a number of assumptions:
• That software is best developed according to a plan which respects a life-cycle. The life-cycle used here is compatible with that shown in the IEEE Glossary of Terms.
• That for planning and management purposes, all activities in a project are broken into work packages of approximately two person-weeks duration, each with some definable work-product to be checked and signed off as complete. (This may seem like administrivia. On a well-run project it is one of the things which makes it a well-run project. In a not-entirely-well-run-project it isn’t done, because it would highlight the project’s deficiencies too clearly.) It’s worth doing because it makes you think more clearly about what you’re trying to do, and if you can’t plan it, what makes you think you can do it?
• That code is developed in units.
• That the integration of large-scale software is planned as a series of separate steps, each with its own set of tests. There are development environments which greatly simplify this.
• That you want a book on test planning and management, not quality assurance, reviews, or auditing.
• That you are testing systems of up to 200 KLOC. For such systems the usual method of unit and system testing applies. Beyond such a size it may be preferable to include a preliminary series of subsystem integration tests and subsystem tests before the full integration and system tests. This is because, with very large systems, perhaps some feature may prove extremely problematic when finally system tested, and it’s better to find such bugs early. Other than that, the book is applicable to managing the testing of systems of any size.
Book’s Website
Acknowledgments
About the Author
Peter Farrell-Vinay has been a test manager and consultant to major
1
Introduction
We all know what testing is. We’ve been doing it for years, in and out of school. We took tests, and teachers gave us marks and told us we were good, bad, or indifferent. People had got the idea that tests might be used to predict things about other people.
In 1904 a Frenchman called Alfred Binet was given the task of deciding whether or not children were subnormal. Monsieur Binet was a member of a committee of Eminent Frenchmen, each eager to propose his own Theory of Child Intelligence and How It can be Determined. M. Binet listened, extracted from each Eminent Frenchman a set of tests, added many of his own invention, and tried them out on sets of children. From the behavior of the children he decided which tests were useful. He then threw out those tests which failed to predict successfully, and tried again.
What did these tests prove? Nothing. They indicated the level of a child’s intelligence at the time the test was administered. They did not prove that the child has great ability or potential. They have been given to an enormous number of children. They are still in use today.
Mr. Cyril Burt was a psychologist interested in predicting the ability of children. The British govern-ment wanted to reduce the cost of education. They reached a position whereby Mr. Cyril Burt provided (much) questioned figures that “proved” that it was possible to predict a child’s ability, and the British government imposed a test on all British children at the age of 11 (called the 11-plus), which determined whether a child would go to a Grammar school (for the brighter) or a Secondary-Modern school (for the less-bright). Many studies have shown that the tests were very bad predictors of a child’s ability and have blighted the lives of a generation of children. Britain still has a terrible shortage of graduates and technicians, but Mr. Cyril Burt was knighted.
1.1 Conclusions
1. Theories can be disproved.
2. Theories can be very useful and good predictors within a limited range of environments. 3. Tests only work in a limited range of environments.
4. Conclusive tests are very difficult to write.
5. There is always someone who believes despite the evidence. 6. Test the tests before you use them.
7. Faking test results can be a way to social advancement — but destroys your reputation.
1.2 What Has This Got to Do With Software?
2 Manage Software Testing
under all circumstances. So we test it. Unfortunately, we occasionally make the mistake of believing that the tests we devise will always predict something useful. Sometimes they don’t.
1.3 If It Isn’t Planned, It Won’t Happen
Testing can only be managed successfully if management understands the processes of testing, the reasoning behind those processes, the intermediate products,1 their limits, how to estimate them, and how to recognize trouble early. For this reason this is not a book about how to write tests. If you need to know about testing, buy several of the books in Appendix D. If you need a definition of test manager’s terms of reference, then see Appendix B. If you want to know how to manage testing, read on.
1.4 Let’s Not Test
Testing is very expensive and its results are often embarrassing. So there are many politically-adept people ready with plausible arguments explaining why testing can be reduced, curtailed, or its implications glossed-over. Here are some of their favorites, followed by a possible rebuttal or work-around. If you think such politically-adept people are really too dim to bother with, then either you’ve just left university, have led a very cloistered life, or have only worked for really great companies.
1. We don’t need that level of testing. Whatever that level of testing is, they don’t want it. Perhaps because it’ll show that the product, or system is bug-ridden, and their job is on the line, alterna-tively that it’ll delay release, and they’d rather (very temporarily) satisfy a customer (and their boss) with a timely release than a usable one.
But there are limits to testing, and perhaps your boss knows what they are better than you. Ask yourself: is the thing I want to test essential? Will a failure matter? Is a failure probable? Is the risk low-probability/high-consequence? It is better to be boring and explicit than to assume. Remember the level of testing should always relate to the risk the product or system poses to all the stakeholders.
Put together the case as shown in section 1.5.
2. It costs too much. The issue is simply how much they will pay to manage a risk. The risk might be somewhere between “will we have any (more) customers if this release fails?” and “is it worth spending one more week to find bugs when the few we have found in the last 3 weeks were trivial?” See Chapter 3.
Estimate what it will cost if the software is late or fails. Then counter the question with “It costs too much for what? The riskthe system represents to the company? The budget you agreed to last week without me, or any relation to the cost to the company if the system fails?”
Put the question another way: “Why not just build the software and release it? To hell with the customers. They won’t know. Think of the money and time you can save by sacking all the testers.” (Be prepared to make this argument because if ever anyone thinks you’re too scared to argue for your job — you’re out. Persist.)
“You don’t want to test; fine, don’t test.” (Then they’ll accuse you of “being silly.”)
“Fine, so we agree you do want to test.” (Pause here. Let someone deny the obvious.)
“But you don’t want to test a lot. At least not with as much rigor as I do. So how much do you want? How much is enough?”
This should trigger a counter-attack along the lines of “testing is very costly in itself,” “testing is costing us time to market,” or “there are still too many bugs being found in the field.”
To each of these, show your figures. When they fail to come up with their own figures, make this bitingly clear. “You’re worried about the bottom line. Funny. So am I. But I’m prepared to back my arguments with figures and proof. You just hand-wave.” (Yes, the gloves are off). For the sorts of figures and ‘proof ’ you need, look at section 4.6.
Introduction 3
3. It’ll take too long. This might be just “it costs too much” in another guise. The argument may be couched in terms of “getting the developers the information they need fast.” In reality it doesn’t matter how fast you get the information to the programmers if most of it’s missing because test coverage was terrible. The question remains the same: what is the risk? Look at Chapter 3.
If, though, the complaint is that developers are told about bugs too late for them to be able to fix in an agile manner, then it needs investigating. How long does it take you to run a full system test (as a proportion of the time they spend building the software), and how good is your coverage? 4. “Testing” is never ready. Often true. The test team which is ready for system test is one which has had a stable and unchanging requirements specification 4 months before system testing was due to start, and a stable test environment for 3 months beforehand (assuming it uses automated tests). It is rare that requirements are so stable that every one is already covered by a test when testing begins: often some tests are being written and reviewed while other tests are being run. Yes, it’s the customer’s fault. What does that buy the test team? They just have to get ready as best they can. See section 4.6.5 and section 6.6 for more on this.
5. We never know how long testing will take (Aka we don’t know how many bugs are in the release). There are ways of finding out. See Chapter 18. Did you warn them how many there’d be or how long it would take? Did they want to know? Did the testers find bugs? Were they testing every day, or was there extensive downtime as development tried to get a release to work? Were there enough testers? Did you make your schedules unrealistically short? Did the testers agree to it? See section 4.6.5 in Chapter 4.
This is your problem. Deal with it by getting an estimate both of the number of bugs to be found and the length of time it will take to find them. Look at section 18.10.
6. It’s too academic (alternatively, we’re not NASA). It’s true that some academic ideas don’t scale to industrial use, but the real reason is they don’t (want to) understand either what you’re proposing to do or what will happen if you don’t. (This argument is also the managerial equivalent of the “real men don’t eat quiche” argument in that such a manager believes himself/herself to be practical and thus non-academic.) Don’t expect senior management to repeat that line of defense to customers or investors.
Bankruptcy is quite academic while it happens to someone else. Answer this by saying that everything you are doing is industry-standard (privately ensure that any academic approaches you might use are proven first). Ask them what they would do. Don’t wince or laugh. Write a brief paper of not more than two sides outlining your proposals. You have a major re-education job on your hands.
7. It isn’t in the plan (they mean “budget,” but don’t want to say so). Nor was the sinking of the
Titanic. Are they suggesting that very little testing be carried out or are they opposing that extra bit of testing you feel is needed? Were you one of the planners? If you weren’t, then write a paper as shown in section 1.5; if you were, explain how the situation has changed, as it does in any project. Explain the risks to be run if they don’t add it to the plan (and the budget).
8. Testing stops us getting the product out. Whoever uses this argument is quite unconcerned for the ill effects the product’s state may have on customers. They have probably miscalculated the release date too, and now face the prospect of explaining why the release is late. Testing is there to stop the company and customers from being damaged by buggy systems.2
2 A nice example: A computer system to cut crime and give Brits the chance to check the status of resold cars is
running millions of pounds over budget, three years late, and won’t be complete for another year. Disclosures obtained by Tom Brake, the Liberal Democrat spokesman for transport, reveals the contract to computerise the . . . system, (suffered) delays . . . caused by staff at the Vehicle and Operator Services Agency (VOSA), implementers of the scheme, and the IT contractor. His evidence . . . indicates both the Agency and contractor underestimated the migration stage of
the project, with progress further hindered by extensive software testing (author’s italics). Note the unchallenged
4 Manage Software Testing
9. Customers are crying out for this release and you testers are holding everything up. Oh gosh, that’s terrible. Well, we’d better stop testing and release It Immediately. They’ll never cry out for another one. 10. Testing makes us look bad. This sounds so much like the waffle of the brain-dead; you might be
surprised anyone would propose it. It was said by someone (probably) under great pressure and with little experience (let’s be nice). If testing makes that person look bad, then what does a bug-rich release do? Thought: is that person about to resign anyway?
11. Testing doesn’t add value. It’s not there to add value. It’s there to preserve value, the value that the development team has put into it.
12. By the time the testers have found all the bugs, the market will have gone away. See the story “If at First You Don’t Succeed, Then Bungee Jumping’s Not for You” in Chapter 7. If you’re competing in a market, this implies you have competitors. Are you relying on them making the same really crass mistake this argument implies? Markets have this horrid habit of rejecting bad products. If this release is a feature too big, then remove that feature. Else keep testing.
13. Nobody cares about these bugs. Everyone cares about the bug that’s stopping them from doing something. This sort of reaction means either you haven’t got them to agree on a way of classifying bugs or they’re arguing about the lesser bugs. What do these bugs mean? That some feature is missing, or absent, and users don’t care? If the latter, then remember that a system infected with a thousand tiny bugs is possibly as unusable as one with a couple of big ones, and user dissatis-faction may soon come to the boil. See section 17.2 for a little story.
14. Testing isn’t the answer. This was said of a finance system which should have been tested and never was, didn’t work, and whose remaining users fled. The person who said that was later found running another failing project. He had never quite worked out what the question was either. 15. The developers do all the testing and other sources of belly laughs. Developers develop. Ask them
to seriously system-test what they build and you’ll be looking at a fascinating expanse of empty chairs. This is probably what this person told the board or anyone else too dim to consider the implications. The person who said that lost his job as CEO seven months later.
16. Please don’t damage the system. OK, this was said 20 years ago and the person concerned will never make the same mistake again. But it illustrates perfectly what happens when someone who should know better gets a faulty paradigm into his3 head. If you can get people to explain how they view the system, you can probably clear away a lot of misconceptions.
17. By the time the users have found that bug, we’ll have released a patch. Sorry, why does the release need to be made anyway if you are going to release the patch so soon? Is it to fix a very embarrassing bug? If so, can you imagine how happy users will be to find the patch contains another bug? Because with that sort of inattention it will, and they’ll find it as well. Probably immediately. This too is the sort of excuse someone might dishonestly put to a (not very bright) board, not to testers. 18. We don’t have time to write the requirements specification. If they say this to you at the interview,
and the project is allegedly “close” to making a critical release, then you have options: • Take the job (and enjoy being a scapegoat).
• Fight your corner. • Don’t take the job.
The requirements specification is of critical importance to the following stakeholders: • Testers who need a specification to test against.
• Developers who need a specification to know what to develop.
• Technical writers who need a specification to know what they have to write about. • Marketing which needs a specification to sell the product.
• Project and test management need a requirements specification to get some idea of system sizing.
3 Sexism. If there’s one thing that enrages my wife more than sexism, it’s the habit of writing s/he, or his, or hers
Introduction 5
There are variants:
• We don’t write specifications.
• The product is too advanced/complex for a specification to be written. • That’s too process for this year.4
Before we all go down with a bad attack of structured sneering let us recall that:
• To have a complete requirements specification is impossible (never mind what the IEEE says), because to be complete the specification would have to say everything the system must be able to do, and to do that you would have to have the system itself. So most sensible people settle for a requirements specification sufficient to meet the stakeholders’ needs.
• Needs change, therefore requirements specifications must change. Requirements specifications can’t change if they don’t exist.
• In the past there was a race of absolutists who wanted cast-iron definitions of everything before they would release a development cent. They leave a long shadow in the collective memory. • Read [Hooks] for an excellent and simple explanation of what happens if you don’t write good
requirements specifications. Note the NASA diagram showing how failure to get the require-ments right leads to big cost overruns.
If people simply want to insist that requirements change and they must be free to change them as the market evolves, then:
• Remember that there has to be a cut-off date after which no changes can be made to a release (if you are ever to test it sufficiently).
• Ensure that there is someone tasked with both keeping the requirements up-to-date and distributing copies to all stakeholders in a timely fashion (possibly someone with an interest in keeping things up-to-date, like the testers).
Otherwise, do you really want to work for people so badly in need of taking Software Engineering 101? 19. The testers never find the important bugs. This is a serious criticism: if, despite having adequate specifications, your team is failing to find serious bugs which users later discover, and you were able to complete all your tests, either you or your team or both are no good. But take heart: at least someone is worrying about bugs.
20. The testers never find all the bugs anyway. Probably true. To test such that every possible bug is found would probably bankrupt the company. To test until every severity 1 or 2 bug is found and fixed is essential. See Appendix C for a classification scheme.
1.5 Something to Do When You Really Hit Opposition
Here are some of the things they don’t want to look at (and you do). Use these as the basis of a report to provide an outline for discussing
1. How much newer projects have slipped as a result of having to pull people off them in order to try to fix the mess created during older ones.
2. The cost of fixing post-release bugs, possibly because that doesn’t come out of their budget or they don’t care how frustrated the developers get in having to build patches rather than design new bits of the system. Get the data from time sheets. Look at:
• The equation in section 18.13 • Table 3.4
• Section 7.4.6 • Section 14.8.2
4 I’m sorry. We had this tacit agreement that we were going to use the English language, and here I go breaking
6 Manage Software Testing
3. The relationship between stopping testing “too early” and delaying getting the next release out (because the developers are spending all their time bug-fixing). Measure this by looking at the bug detection curve, the test runs, the time sheets, the overtime, and the 3rd-line support calls (problems per user month). If it looks like the one in Figure 1.1, then it seems highly probable that the release was snatched away from testers at the moment they were finding the most bugs. Note that only a third had been fixed. Were they the most critical? Find the number of 3rd-line support calls (problems per user month) made against that release and compare them with those made for a “well-tested” release whose bug detection curve looks like the one in Figure 1.2. (Notice, though, that this release had far too many unfixed low-level bugs in it.)
4. The number of lines of code per bug in each release over the last two years, and show it on a chart. Are things getting better or worse? (See Figure 18.19 for a nasty example.)
5. Number of bugs found in the field compared with those found during system testing (try to see how easy is it for some user to raise a bug report, and how easy is it for you to read it). Go and talk to real users. If there are very few bugs reported from the field it is probably because that’s difficult for users to do.
6. The number of click-outs or click-throughs on a web page. If you’re testing a web application, create some user action logs and look at them. At what point do people click out?
7. The number of 3rd-line support calls (measured as problems per user month in some companies) and which bits of the system provoked the most. (Why wasn’t the buggiest bit tested better? Review the tests and find out.) The support desk is either:
• Overwhelmed with calls
• Already abandoned by customers because it doesn’t work • Regularly hand-holding important users
FIGURE 1.1 Found and fixed bug detection chart
FIGURE 1.2 Overall bug detection profile 600
500
Found Found and fixed SCRs
Fixed 400 300 200 100 0 3000 2800 2600 2400 2200 2000 1800 1600 1400 1200 1000 800 600 400 200 0 Open
Open and closed SCRs
Closed
26 Mar 09 Ma
y 23 Ma y 06 J un 20 J un 04 J ul 18 J ul 01 A ug 15 A ug 28 A ug 11 A pr 25 Ap
Introduction 7
8. The amount they are spending on training (because the system is unusable out of the box or the user interface is terrible). Beware: some companies like it like this — users spend a lot on training consultants and the company earns even more revenue.
9. The extraordinary number of releases made to the field. (How many major releases do they make a year? How many minor releases, how many patches?) Rule of thumb: you should have one major release per annum, one minor, and a maximum of two roll-up patches. Why? Because otherwise: • Your development and testing staff will be falling over themselves trying to get releases out,
they will be unfocused, disorganized, and chaotic, and people will leave.
• The market will correctly perceive that your testing process, and probably much else, is inadequate.
10. The number of developers and testers who left in the last year.
11. The overtime amount. (To cope with the chaos. Relate them to the release dates. If you can’t observe a pattern, then it’s because you haven’t been given the real release dates. Check in the configuration management database. There’s always a bit of overtime worked around the time of a major release. How big is that bit?)
12. The number of abandoned test runs. There are two good reasons and one bad one for abandoning test runs:
• The number of bugs is so high that the testers spend more time filling in bug reports than in testing. • Important parts of the system simply do not work.
• The developers arbitrarily change the test environment (thus halting the use of the present release) or impose a new release by simply installing it over the existing one.
The first two are unfortunate; the last is unforgivable and indicates that the development function is out of control. If the last happens, then it can mean that some part of the system never gets tested until too late and that developers don’t hear of bugs in time because test coverage is poor. You can get this data from the test management tool or direct from the testers.
13. The risk the project runs. Is there a risk log? Review it.
14. The number of bugs is being introduced with each fix. This will really make people scream. The truth is, all fixes induce some bugs. Hopefully the ratio is less than 1:1 fixes to new bugs. See section 2.7.2 for more on this.
15. How many extraordinary delays occurred before the first release, because key parts of the product had neither been prototyped nor modeled and were found not to work far too late for corrective measures to be taken?
Structure your report like this:
1. The project environment.
2. What the project is supposed to be doing. 3. What’s happening, and the evidence. 4. What we need to do.
5. How we’ll know if we’re succeeding.
6. What will happen if we don’t do what’s needed.
Keep it short (no more than 4 pages, and preferably two), keep it conclusive. Say nothing you cannot support with evidence.
1.6 Conventions
• [Names] refer to a reference in the list at the back of the book. • |a| is the absolute value of a, e.g., (|-5|=5).
• min(a, b) is the minimum of a or b, e.g., (min(10, 11) = 10). • is an estimate of N.
• { sets | of | things } are held in curly brackets and separated with vertical strokes. ˆ
8 Manage Software Testing
1.7 Apologies
If this book seems so far to be a little diatribe against management, then please accept that:
1. I know and have worked for many intelligent managers who have been very tough over dates and resources, but didn’t want their name sullied by bug-filled releases. They are very good people to work for.
2. There are the unhappy few for whom avoidance of responsibility has become a way of life.
More cautions:
1. We have seen the enemy and it’s us. When we’ve seen past the technology, we realize that most
of the problems we face are the ones we create for ourselves.
2. Definitions of quality are a bit like quality of life. If the subject is raised, then you know there
isn’t much. If a product does what it says on the tin and someone will pay for it, that’s quality.
3. Why words get in the way: software engineering is a lexicographer’s delight. It’s nice to know
someone is happy with the plethora of terms, acronyms, and subtle distinctions that the subject has spawned. The definitions used in this book are contained in the Glossary at the end. As far as possible, this glossary is consistent with the IEEE glossary. To make this book as short as possible, polite phrases such as “it is highly advisable to” have been avoided in favor of a simple if direct command: “do this” or “do that.” If the reason for the command isn’t obvious, it has been added.
4. Errors, faults, bugs, problems, and defects. Much time is spent on defining them. A simple
distinction may help: in this book an error or problem is humanly visible; a fault, bug, or defect is the underlying cause. I have mostly used the word “bug.”
Many of the things in this book are so obvious everyone knows about them. Perhaps you know them. I’d rather bore you than mystify you.
1.8 Some Basics
1.8.1 Experts and Novices
Of course you’re not a novice. Whoever suggested that? But, er, just check:
1. The novice has no idea of what to attend to in the mass of data he sees every day. So he attends to everything, gets overloaded, and misses the vital signs.
2. The expert has anticipated most problems, concentrates on the essentials, and thus has time to look for the unexpected.
3. There is also the hapless person for whom unwelcome news is simply ignored because it conflicts with his pre-existing views. You’ve never met one? Lucky you.
See [Dixon 1] and [Dixon 2] for more on experts, novices, and, er, the others. There is no quick way to become an expert. But there is a way of preparing for surprises, somewhere between expert and novice. It’s called strategy and planning. Writing all those Very Wonderful documents is a way of simulating the project, getting it all down on paper, and thus externalizing it, like a script or a set of stage directions or a program.
Introduction 9
1.8.2 Let’s Hear It for Strategy
Testing is a way of answering questions. Questions such as “Does it work? Is it any good? Can we use it?”
are big, but they can be split into smaller questions such as “Have we used it like the users will? Have we tested it all? Did we build it the ‘right’ way? Is it fast enough?”
These are all strategic questions but because testing as an activity is accepted as Something We Ought To Do (more in principle than in practice), managers and testers tend to lose sight of them. This book is intended, among other things, to remind everyone that testing occurs for good reasons, and these need to be made explicit if they are to be understood. The place for this is not the test plan but the test strategy document. Seesection 8.3. See also [Minto] for good ways of thinking and writing strategically.
The test strategy document is a way of exposing your thoughts on what you are testing and why. It provides the rationale for the test plan and the overall approach to testing, and thus helps you to keep such thoughts in a place where they are more likely to be read. To some extent it subsumes some of the contents of the quality plan (seesection 8.21), while leaving (say) the activities and the schedule to change as progress dictates. As a manager you must be able to work part of your time at a strategic level so that you can align your work with the company’s needs. You will be expected to share your strategic thoughts with other managers and of course the board. Use the test strategy document for this.
1.8.3 Planning and Specifying
Testing takes time. So you need a test plan to manage that time. Tests get planned in test plans. These may be self standing or part of quality plans (seesection 8.21 in Chapter 8). Generally speaking, quality plans define a project’s overall approach to quality, and thus shouldn’t change throughout the project’s life unless something most important happens. Test plans may change as the risk the product is perceived to pose changes. Test plans say who does what, when, and what they produce. See section 8.5for an example; also see Chapter 6 and section 4.4 for an overview of the processes you’ll need to plan for.
Story
ir Peter Hall was once an unknown, aspiring theatre director: a novice. He finally got his Big Break directing a play, and bought a copy of the play, some paints, and cardboard, an enormous blank bound book, and hastened off to a rented cottage for a month. In the cottage he made a model of the theatre with all the actors, lights, scenery, etc. He cut up the copy of the play into individual sheets and pasted them into the blank bound book, leaving a blank page between each page of dialogue. Then, looking at the model theatre, he annotated the dialogue scene-by-scene until he knew exactly where everyone should be, what their cues were, roughly what the lighting should do, and what noises-off were needed.
The day came when he entered the theatre and placed his enormous book (which impressed everyone) on a table in the middle of the auditorium.
“Act one, scene one, darlings,” he called. The cast dutifully took their places, and he started to direct them exactly as his notes showed.
After an hour he realized that something was wrong. Nothing gelled. The cast just weren’t behaving like the bits of cardboard. They were scruffy, misbehaved, and awkward. He’d just have to get up there on stage and show them. So he did, and the play gelled and was a great success, because he knew that play backwards. Indeed, he was well on his way to becoming an expert.
10 Manage Software Testing
All tests exist to answer some question. Unit, integration, and systemtests answer the questions “Do the units do what they’re supposed to? Do the components integrate properly? Does the system do what is required of it?” To minimize risk, these questions are answered in phases: unit, integration, and system testing. Since testing will certainly cost a third and perhaps more than half the total cost of the project, planning and managing it is a major problem.
Tests get specified in test specifications (yes, some people call them test plans, but this is wrong). The test specifications may in fact be inputs directly to some test tool. If not, they should contain at least the essence of the test as shown in section 8.8.
1.8.4 Reviews
Testing is one of the main methods of demonstrating that the requirements of a project are met. Another method is reviewing. This book is not concerned with how