MULTIVARIATE ANALYSIS APPLIED TO GENOTYPE DISTINCTION IN COMMON BEAN
1
Ivan Ricardo Carvalho,
1Maicon Nardino,
2Tiago Olivoto,
2Alexsander Rigatti,
2
Cleiton Antonio Warths,
1
Tiago Zanatta Aumonde
ARTICLE INFO ABSTRACT
This study aimed to determine the dissimilarity among landrace common bean genotypes through multivariate techniques aiming the selection of individuals to compose the crossing blocks and determine among the evaluated genotypes, which ones have proximity t
experiment was carried out during the 2014/2015 agricultural year in TenentePortela
Brazil. The augmented blocks design was composed by the control treatments: BRS Estilo, IPR Uirapuru, IPR Tangara, BRSMG Realce,
treatments were constituted by the genotypes: LMGPP01, LMGPP2, LMGPP3, LMGPP4, LMGPP5, LMGPP6, LMGPP7, LMGPP8, LMGPP9, LMGPP10, LMGPP11, PORTELA16, PORTELA37, PORTELA38, PORTELA39, PORTELA64, and POR
PORTELA16 are the most dissimilar, while LMGPP01 and LMGPP02 are the most similar ones. The BRSMG REALCE and PORTELA16 genotypes can be used as genitors in combination with other genotypes in the formation of segregating p
UPGMA clustering method, the Tocher optimizing method, and the principal component analysis are consistent and complementary, enabling a reliable response in the data interpretation on the genetic dissimilarity in common bean.
Copyright©2016, Ivan Ricardo Carvalho et al. This
unrestricted use, distribution, and reproduction in any medium, provided the original work is properly cited.
INTRODUCTION
The grains of common bean (Phaseolus vulgaris
as a food source of protein and energy in different regions of the world, having special importance in the human diet (GOMES JUNIOR et al. 2005). The common bean yield of Brazil is far below the cultivars potential, being the average
grain yield of 1000 kg ha-1 (CONAB 2015). There are several
factors that influence the crop grain yield, such as the cropping environment factors, genotype traits, technologies employed, cropping systems (MINGOTTE et al. 2014), nutritional management mainly of nitrogen (DEMARI
water supply (CARVALHO et al. 2013).
genotypes with higher yield and adapted to the most varied cropping conditions presents as one of the main interests of the genetic breeding.
*Corresponding author: Ivan Ricardo Carvalho,
Federal University of Pelotas.
ISSN: 0975-833X
Article History: Received 05th June, 2016
Received in revised form 20th July, 2016
Accepted 25th August, 2016
Published online 30th September,2016
Citation: Ivan Ricardo Carvalho, Maicon Nardino, Gustavo Henrique Demari common bean” International Journal of Current Research
Key words:
Phaseolus Vulgaris,
Genetic Breeding, Biometry.
RESEARCH ARTICLE
MULTIVARIATE ANALYSIS APPLIED TO GENOTYPE DISTINCTION IN COMMON BEAN
Maicon Nardino,
1Gustavo Henrique Demari,
2Diego Nicolau Follmann,
Alexsander Rigatti,
1Alan Junior de Pelegrin,
1Vinicius
Cleiton Antonio Warths,
2Felipe Koch,
1Geison Rodrigo Aisenberg,
Tiago Zanatta Aumonde and ³Velci Queiróz de Souza
1
Federal University of Pelotas
2Federal University of Santa Maria
3
Federal University of Pampa
ABSTRACT
This study aimed to determine the dissimilarity among landrace common bean genotypes through multivariate techniques aiming the selection of individuals to compose the crossing blocks and determine among the evaluated genotypes, which ones have proximity t
experiment was carried out during the 2014/2015 agricultural year in TenentePortela
Brazil. The augmented blocks design was composed by the control treatments: BRS Estilo, IPR Uirapuru, IPR Tangara, BRSMG Realce, IAC Formoso, IPR Imperado, and IPRTiziu, and the regular treatments were constituted by the genotypes: LMGPP01, LMGPP2, LMGPP3, LMGPP4, LMGPP5, LMGPP6, LMGPP7, LMGPP8, LMGPP9, LMGPP10, LMGPP11, PORTELA16, PORTELA37, PORTELA38, PORTELA39, PORTELA64, and PORTELA65. The genotypes LMGPP09 and PORTELA16 are the most dissimilar, while LMGPP01 and LMGPP02 are the most similar ones. The BRSMG REALCE and PORTELA16 genotypes can be used as genitors in combination with other genotypes in the formation of segregating populations with wide genetic variability. The hierarchical UPGMA clustering method, the Tocher optimizing method, and the principal component analysis are consistent and complementary, enabling a reliable response in the data interpretation on the genetic dissimilarity in common bean.
This is an open access article distributed under the Creative Commons Att use, distribution, and reproduction in any medium, provided the original work is properly cited.
Phaseolus vulgaris) are utilized
food source of protein and energy in different regions of the world, having special importance in the human diet common bean yield of Brazil is far below the cultivars potential, being the average (CONAB 2015). There are several such as the cropping environment factors, genotype traits, technologies employed, . 2014), nutritional management mainly of nitrogen (DEMARI et al. 2015), and . 2013). The search for genotypes with higher yield and adapted to the most varied cropping conditions presents as one of the main interests of the
,
Thus, plant breeders seek to understand the genetic variability available and better determine which genotypes are
ally adequate and responsive to environmental effects (RAMALHO et al. 2012). Phenotypic differentiation are important to orientate available genotypes, whic
agronomical requirements and lead to crop breeding gains. Thus, the phenotype is defined as a collection of biological information, resulting from the expression of genetic traits and by the environmental action (RAMALHO
the breeder has genetic variability available in common bean breeding program, it is necessary to understand the genetic variation and discriminate the genetic distance among the genotypes without studies or information. Thus, with the purpose of support in choosing which genotypes better represent the agronomic ideotype, techniques of multivariate analysis are used in the genotype discrimination.
International Journal of Current Research Vol. 8, Issue, 09, pp.38352-38358, September, 2016
INTERNATIONAL
Ivan Ricardo Carvalho, Maicon Nardino, Gustavo Henrique Demari et al. 2016. “Multivariate analysis applied to genotype distinction in
International Journal of Current Research, 8, (09), 38352-38358.
MULTIVARIATE ANALYSIS APPLIED TO GENOTYPE DISTINCTION IN COMMON BEAN
Diego Nicolau Follmann,
Vinicius Jardel Szareski,
Geison Rodrigo Aisenberg,
1Tiago Pedó,
Queiróz de Souza
This study aimed to determine the dissimilarity among landrace common bean genotypes through multivariate techniques aiming the selection of individuals to compose the crossing blocks and determine among the evaluated genotypes, which ones have proximity to an agronomic ideotype. The experiment was carried out during the 2014/2015 agricultural year in TenentePortela– RS, southern Brazil. The augmented blocks design was composed by the control treatments: BRS Estilo, IPR IAC Formoso, IPR Imperado, and IPRTiziu, and the regular treatments were constituted by the genotypes: LMGPP01, LMGPP2, LMGPP3, LMGPP4, LMGPP5, LMGPP6, LMGPP7, LMGPP8, LMGPP9, LMGPP10, LMGPP11, PORTELA16, PORTELA37, TELA65. The genotypes LMGPP09 and PORTELA16 are the most dissimilar, while LMGPP01 and LMGPP02 are the most similar ones. The BRSMG REALCE and PORTELA16 genotypes can be used as genitors in combination with other opulations with wide genetic variability. The hierarchical UPGMA clustering method, the Tocher optimizing method, and the principal component analysis are consistent and complementary, enabling a reliable response in the data interpretation on the genetic
is an open access article distributed under the Creative Commons Attribution License, which permits
to understand the genetic variability available and better determine which genotypes are agronomic adequate and responsive to environmental effects . 2012). Phenotypic differentiation are important to orientate available genotypes, which meet the and lead to crop breeding gains. Thus, the phenotype is defined as a collection of biological information, resulting from the expression of genetic traits and (RAMALHO et al. 2012). While breeder has genetic variability available in common bean breeding program, it is necessary to understand the genetic variation and discriminate the genetic distance among the genotypes without studies or information. Thus, with the oosing which genotypes better represent the agronomic ideotype, techniques of multivariate analysis are used in the genotype discrimination.
INTERNATIONAL JOURNAL OF CURRENT RESEARCH
Among these techniques, the Standardized Euclidean Distance is emphasized because it indicates the genetic dissimilarity by the group formation, pointing the closest and distantly related genotypes (CRUZ et al. 2012). Cluster analysis techniques aim assemble the genotypes into several groups by some criteria in a way that homogeneity occurs within the group and heterogeneity occurs among groups. These methods are used efficiently by directing the selection of genitors to compose the crossing blocks (CRUZ et al. 2012). Multivariate methods that summarize the set of original variables in a few components involving the majority of the found variability are also very useful in the analysis of genetic dissimilarity, highlighting the principal components analysis (CRUZ& REGAZZI 1997). Therefore, this study aimed to determine the dissimilarity among landrace common bean genotypes through multivariate techniques aiming the selection of individuals to compose the crossing blocks and determine among the evaluated genotypes, which ones have proximity to an agronomic ideotype.
MATERIALS AND METHODS
The experiment was carried out during 2014/2015 agricultural year in Tenente Portela – RS, southern Brazil. The corresponding coordinates are latitude of 27º22'10.20''S and longitude of 53º45'23.00''O, with an altitude of 420 meters. Thesoilisclassified as a “Latossolo Vermelho Férrico típico”. According toKöppenclimateclassification, the climate is classifiedas humid subtropical Cfa. The experimental design utilized was augmented blocks, where the common treatments were composed by seven control treatments: BRS Estilo, IPR Uirapuru, IPR Tangara, BRSMG Realce, IAC Formoso, IPR Imperado, and IPR Tiziu, and the regular treatments were constituted by 17 genotypes: LMGPP01, LMGPP2, LMGPP3,
LMGPP4, LMGPP5, LMGPP6, LMGPP7, LMGPP8,
LMGPP9, LMGPP10, LMGPP11, PORTELA16,
PORTELA37, PORTELA38, PORTELA39, PORTELA64, and PORTELA65, as proposed by Ramalho et al. (2012).
The experimental units were composed by two rows of one meter and spacing of 0.45 meters. The employed population
density was ten seeds per linear meter (s m-1), based on the
no-till seeding system. Basic fertilization of 300 kg ha-1of N-P-K
with the formulation 10-20-20 was performed. Posteriorly,
topdressing fertilization of 90 kg ha-1 of nitrogen in the amide
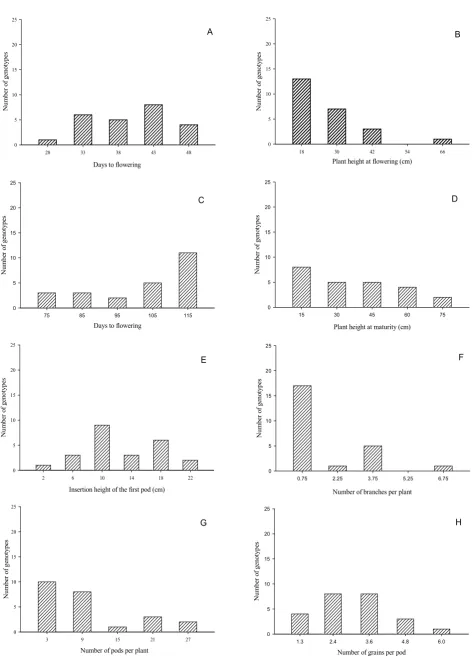
form was performed during V4 crop vegetative stage. Phytosanitary management to control weeds, insect pests, and diseases were carried out preventively in order to minimize interference on experimental results. The following traits were measured in ten plants per treatment: days to flowering (DTF), plant height at flowering (PHF), days to maturity (DTM), plant height at maturity (PHM), insertion height of the first pod (IFP), number of branches per plant (NBP), number of pods per plant (NPP), number of grains per pod (NGP), grain weight per pod (GWPD), number of grains per plant (NGP), grain weight per plant (GWP), length of grains (LGG),and width of grains (WDG), based on methodologies proposed by Silva (2005) and Demari et al. (2015). The obtained data were
submittedto descriptive analysis through phenotypic
frequencies distributions. Subsequently, the analysis of genetic dissimilarity was performed through Standardized Euclidean Distance and the dendrogramwas based on Unweighted Pair
Group Method Arithmetic Average (UPGMA) grouping. The Tocher group analysis and the relative contribution of traits proposed by Singh (1981) were performed. Moreover, the principal components analysis was carried out, where scores of each genotype were plotted in a three-dimensional distribution. All analyzes were performed as Cruz et al. (2012), utilizing the Genes statistical software (CRUZ 2013).
RESULTS AND DISCUSSION
Descriptive analyzes by the frequency distributions showed the formation of different phenotypic classes for the measured traits. For the trait days to flowering (DTF), the formation of five phenotypic classes with range from 25 to 55 days (Figure 1A) was observed. Classes of 40 and 45 DTF comprised 74.5% of genotypes. The plant height at flowering (Figure 1B) showed values from 18 cm to 66 cm, with the majority of the present genotypes among 18 cm and 30 cm. In this regard, the great range of variation observed in PHF can enable obtaining segregating populations with high genetic variation for this trait. For the trait days to flowering (Figure 1C), early genotypes with up to 75 days to maturation and late genotypes with up to 115 days for maturation were observed. The data indicated that there is the possibility of selecting contrasting superior genotypes in terms of cycle, allowing their insertion in specific niches of market, which require early genotypes to enable the production system in rotation with other crops.
The plant height at maturity (Figure 1D) appeared as one of the traits with high variation among genotypes, ranging from 15 cm to 75 cm of PHM, evidencing the difference among the studied genotypes. The same can be observed for the trait insertion height of the first pod (Figure 1E) with genotypes distributed among measures of two cm to 22 cm. Concerning the number of branches per plant (Figure 1H), most genotypes revealed magnitudes of 0.75 branches per plant.
Days to flowering
28 33 38 43 48
N
u
m
b
er
o
f g
en
o
ty
p
es
0 5 10 15 20 25
Number of grains per pod
1.3 2.4 3.6 4.8 6.0
N
u
m
b
er o
f
g
en
o
ty
pe
s
0 5 10 15 20 25
Number of pods per plant
3 9 15 21 27
Nu
m
b
er o
f
ge
n
o
ty
p
es
0 5 10 15 20 25
Insertion height of the first pod (cm)
2 6 10 14 18 22
Nu
m
b
er o
f
g
en
o
ty
p
es
0 5 10 15 20 25
Number of branches per plant
0.75 2.25 3.75 5.25 6.75
Nu
m
b
er o
f
g
eno
ty
p
es
0 5 10 15 20 25
Plant height at maturity (cm)
15 30 45 60 75
Nu
m
b
er o
f
g
eno
ty
p
es
0 5 10 15 20 25
Days to flowering
75 85 95 105 115
N
u
m
be
r o
f g
en
o
ty
p
es
0 5 10 15 20 25
Plant height at flowering (cm)
18 30 42 54 66
Nu
m
b
er o
f
g
en
ot
y
p
es
0 5 10 15 20 25
A B
C D
E F
[image:3.595.52.528.81.742.2]G H
Figure 1. Frequency distribution of phenotypic classes for: graph (A) days to flowering (DTF); graph (B) plant height at flowering (PHF); graph (C) days to flowering (DTM); graph (D) plant height at maturity (PHM); graph (E) insertion height of the first pod (IFP); graph (F)number of branches per plant (NBP); graph (G) number of pods per plant (NLP); and graph
According to Table 1, which presents the dissimilarity matrix among the 24 common bean genotypes based on the Standardized Euclidean Distance, the greatest distance was 2.25 and it was observed between the pair of genotypes 19 (PORTELA16) and 16 (LMGPP09). The highlighted pairs of genotypes represented the largest found distances, being indicated as potential genitors to compose the crossing blocks. While the genotypes 8 and 9 were the most similar ones, showing the smallest distance (0.27).Although revealing the
genetic distance among each genotype combination,
complementary analyzes are necessary in order to design the crossing blocks, aiming to identify promising genotypes.
The formation of three distinct groups with the greatest
distance between groups of 1.86 (DI,III) was observed by
grouping the genotypes by the Tocher optimization method (Table 2). Also, the largest group was formed by group I, composed by 22 genotypes. Groups II and III were composed by one genotype in each group. When comparing the results of Tocher grouping with genetic dissimilarity matrix (Table 1), the most distant genotypes by the dissimilarity matrix were reliably separated in both multivariate methods. Comparing the group formation, the cultivars remained in similar groups, such as IPR UIRAPURU, IPR TANGARÁ, IPR IMPERADOR, IPR TIZIU cultivars, being the group I.
Grain weight per pod (g)
0.6 1.2 1.8 2.4 3.0
Nu
m
b
er
o
f g
en
o
ty
p
es
0 5 10 15 20 25
Number of grains per plant
1 15 30 45 60 75
Nu
m
b
er o
f g
en
o
ty
p
es
0 5 10 15 20 25
Length of grains (mm)
9 11 12 14 15
Nu
m
b
er
o
f g
en
o
ty
p
es
0 5 10 15 20 25
Grain weight per plant (g)
2.5 7.5 12.5 17.5 22.5
N
u
m
b
er
o
f g
en
o
ty
p
es
0 5 10 15 20 25
Width of grains (mm)
5.7 6.3 6.9 7.5 8.1
N
u
m
b
er o
f
g
en
o
ty
p
es
0 5 10 15 20 25
A B
C D
[image:4.595.64.515.82.565.2]E
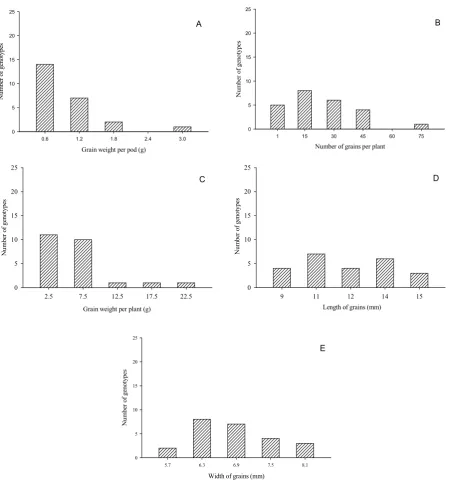
Figure 2. Frequency distribution of phenotypic classes for: graph (A) grain weight per pod (GWPD); graph (B) number of grains per plant (NGP); graph (C) grain weight per plant (GWP); graph (D) length of grains(LGG); and graph (E) width of
Table 1. Genetic dissimilarity matrix among 24 common bean accessions (listed from1 to 24), estimated from 13 morphological traits inTenentePortela– RS in the 2014/2015 agricultural year
G* 1 2 3 4 5 6 7 8 9 10 11 12 13 14 15 16 17 18 19 20 21 22 23 24
1 0
2 1,51 0
3 1,69 0,48 0
4 1,35 1,85 2,15 0
5 1,17 0,94 0,97 1,62 0
6 1,21 1,07 1,35 1,39 1,04 0
7 1,25 1,20 1,59 1,30 1,21 0,97 0
8 1,62 0,98 0,74 2,05 0,86 1,51 1,79 0
9 1,61 0,95 0,69 2,10 0,76 1,48 1,77 0,27 0
10 1,32 1,04 1,28 1,62 0,87 0,79 0,92 1,46 1,36 0 11 1,05 1,08 1,31 1,47 1,12 1,01 1,03 1,37 1,39 0,89 0 12 1,19 1,05 1,07 1,83 0,73 1,21 1,29 1,12 1,08 0,82 0,89 0 13 0,81 1,35 1,59 1,42 1,25 1,15 0,91 1,69 1,69 1,10 0,62 1,08 0 14 1,09 1,29 1,59 1,63 1,54 1,42 1,03 1,88 1,88 1,41 1,08 1,38 0,85 0 15 0,96 1,56 1,75 1,67 1,34 1,46 1,23 1,79 1,79 1,48 1,34 1,33 1,14 1,02 0 16 1,54 0,81 0,76 2,12 0,88 1,31 1,55 0,89 0,71 0,99 1,19 0,97 1,53 1,64 1,71 0 17 1,28 1,38 1,52 1,73 1,07 1,15 1,10 1,57 1,52 0,98 0,95 1,14 0,88 1,41 1,34 1,38 0 18 1,37 1,50 1,60 1,84 1,35 1,29 1,34 1,73 1,74 1,30 1,12 1,20 1,02 1,34 1,23 1,68 0,79 0
19 1,68 2,01 2,18 1,51 1,84 1,89 1,77 1,96 2,09 2,00 1,50 1,84 1,59 1,80 1,62 2,25 1,77 1,77 0
20 1,32 1,16 1,49 1,42 1,29 0,93 0,83 1,70 1,71 0,82 0,72 1,00 0,92 1,15 1,44 1,49 1,28 1,30 1,64 0
21 1,50 1,43 1,70 1,75 1,61 1,13 1,11 1,92 1,97 1,24 1,03 1,32 1,11 1,27 1,40 1,79 1,36 1,06 1,83 0,77 0
22 1,31 0,82 1,03 1,77 1,14 0,94 1,11 1,37 1,34 0,84 0,63 0,89 0,90 1,09 1,49 1,06 1,00 1,01 1,91 0,83 0,97 0
23 1,65 0,61 0,62 2,08 1,00 1,46 1,49 0,79 0,74 1,24 1,26 1,13 1,58 1,56 1,72 0,58 1,53 1,77 2,15 1,51 1,78 1,14 0
24 1,31 1,11 1,40 1,77 1,23 0,91 0,88 1,72 1,64 0,79 0,92 1,21 0,94 1,07 1,29 1,26 0,81 1,09 1,93 1,01 1,18 0,78 1,43 0
[image:5.595.128.489.371.596.2]*1: BRS ESTILO; 2: IPR UIRAPURU; 3:IPR TANGARA; 4: BRSMG REALCE; 5: IAC FORMOSO; 6: IPR IMPERADOR; 7: IPR TIZIU; 8: LMGPP01; 9: LMGPP02; 10: LMGPP03; 11: LMGPP04; 12: LMGPP05; 13: LMGPP06; 14: LMGPP07; 15: LMGPP08; 16: LMGPP09; 17: LMGPP10; 18: LMGPP11; 19:PORTELA16; 20: PORTELA37; 21: PORTELA38; 22: PORTELA39; 23: PORTELA64; 24: PORTELA65.
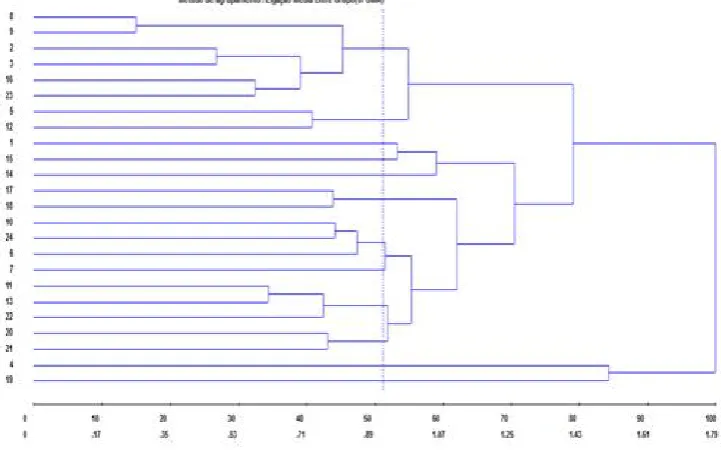
Figure 3. Representative dendrogram of genetic dissimilarity among 24 common bean genotypes, obtained by the method of average links between groups UPGMA and using the Euclidean Distance as dissimilarity measure. The values found in each cluster represents the percentage of times that the genotypes were grouped together in 2000 simulations of bootstrap resampling. The
cophenetic correlation coefficient (r) was 0.82, with estimates of 2.42% distorting and 15.58% stress
Table 2. Genotype groups established by the Tocher method based on dissimilarity expressed by the Euclidean Distance, estimated from 13 morphological traits
Group Common bean accessions Distance
Intragroup Intergroup I 8 9 3 23 16 2 5 12 22 10 11 6 24 20 17 13 7 18 1 14 21 15 1,22 DI,II = 1,72
II 4 DI,III = 1,86
III 19 DII,III = 1,51
Table 3 – Results of relative contribution of eachmorphological-agronomic traiton the total variation found among 24 common bean genotypes estimated by the method of Singh
(1981)
Traits S.j Relative Contribution (%)
Daystoflowering 15116,00 2,14
Plantheightatflowering 85973,75 12,15
Daystomaturity 116864,00 16,52
Plantheightatmaturity 224315,00 31,71
Insertion height of the first pod 14099,00 1,99
Number of branches per plant 1808,00 0,26
Number of pods per plant 28911,00 4,09
Number of grains per pod 862,51 0,12
Grainweight per pod 180,49 0,03
Number of grains per plant 201399,00 28,47
Grainweight per plant 15519,95 2,19
Lengthofgrains 2091,94 0,30
Width of grains 243,97 0,03
Table 4. Estimate of the principal components (PC), eigenvalues (λi), percentage of variance explained by the component (%VEC)
and cumulative variance by the traits (%CVT) obtained from 13 traits evaluated in 24 common bean genotypes
Principal Components λi % VEC % CVT
PC1 4,689 36,071 36,071
PC2 2,354 18,108 54,179
PC3 1,480 11,388 65,568
PC4 1,156 8,896 74,464
PC5 1,004 7,725 82,188
PC6 0,593 4,560 86,748
PC7 0,576 4,433 91,182
PC8 0,397 3,053 94,235
PC9 0,323 2,485 96,720
PC10 0,219 1,687 98,407
PC11 0,160 1,231 99,638
PC12 0,038 0,294 99,932
[image:6.595.40.281.290.616.2]PC13 0,009 0,068 100,000
Figure 4. Three-dimensional graphic dispersion of scores obtained in the first three principal components, estimated by the
weighting coefficients and the standard mean of each trait measured in 24 common bean genotypes
The presence of genotypes derived from the same breeding program in the same group shows the similarity among them (FALCONER 1987). Thereby, possibly only one of genotypes would be incorporated to the crossing block due to its close relation with the other genotypes. Moreover, the genetic distance (1.34) among the cultivars originated from the same program that integrated different groups in the distance matrix
indicated that genetic constitutions with greater amplitude of genetic variation can be obtained from the same breeding program, as the example of BRS ESTILO (group I) and BRSMG REALCE (group II) cultivars. The formation of groups II (BRSMG REALCE) and III (PORTELA16), composed of only one genotype each, evidenced the great genetic distance of these with the other genotypes. The distance evidenced between groups II and III was 1.51, which corresponds to the distance between 4 and 19 genotypes (Table 1). The dendrogram (Figure 3) presented significant cophenetic correlation (r) of 0.82. The higher this coefficient, the smaller is the distortion between the original dissimilarity matrix and the graphic grouping (BUSSAB et al. 1990). In this regard, Sokal & Rohlf (1962) reported that ratios above 0.80 are considered satisfactory, providing reliability to the original matrix. The calculated values of distortion (2.42%) and stress
(15.58%) also indicate the reliability of graphical
representation of the original matrix.
As in Tocher optimization method, the same genotypes were observed composing groups. The first group was composed of 22 genotypes with approximately 92% of all genotypes. Moreover, the second group was composed by the BRSMG REALCE genotype and the third group was composed by PORTELA16 genotype (Figure 3). These results indicated being possible the combination of these with the genotypes present in group I. The most favorable combinations utilizing the check varieties in the crossing blocks are with genotype 4 (BRMSG REALCE): G4 x G8; G4 x G9; G4 x G16, and G4 x G23. While the most promising combinations using genotype 19 (PORTELA16) are: G19 X G2; G19 x G3; G19 x G9; G19 x G10; G19 x G16, and G19 x G25 (Table 1). The use of more than one grouping method allowed the complementarities between them, generating a reliable information data and avoiding erroneous inferences that may occur depending on the various criteria that each method uses. When assessing the relative trait contribution (Table 3), the traits that contributed more to the dissimilarity among the analyzed genotypes were the plant height at maturity (31.71%), the number of grains per plant (28.47 %), days to maturity (16.52%) and plant height at flowering (12.15%), which accounted for approximately 90% of the total variation among genotypes. The traits number of branches per plant, number of grains per pod, grain weight per pod, length of the grain, and width of the grain did not come to explain 1% of the total variation found among genotypes.
Although the first three principal components had just explained 65.56% of the total variation found (Table 4), this method was consistent with other dissimilarity analysis methods among genotypes, being complementary with the results found in other methods. In order to exploit the maximum genetic variability in crossings and obtain segregating populations, with the possibility of obtaining superior genotypes, the genetic basis of common bean is promising to be expanded. Whereas the multivariate analysis revealed that there are indications of dissimilarityamonggeno types. In this sense, the multivariate methods are promising and useful to plant breeders in order to facilitate the interpretation of data showing the dissimilarity of the genotypes and optimizing the working time as well as human and financial resources.
Conclusion
The LMGPP09 and PORTELA16 genotypes are the most dissimilar, while LMGPP01 and LMGPP02 are the most similar. The BRSMG REALCE and PORTELA16 cultivars can be used as genitors in combination with other genotypes in the formation of segregating populations with wide genetic variability. The hierarchical UPGMA clustering method, the Tocher optimizing method, and the principal component analysis are consistent and complementary, enabling a reliable response in data interpretation on the genetic dissimilarity in common bean.
REFERENCES
Bussab W. de O. et al. 1990. Introdução à análise de agrupamentos. São Paulo: Ed. Associação Brasileira de Estatística, 100p.
Cabral P.D.S. et al. 2011. DE. Análise de trilha do rendimento de grãos de feijoeiro (Phaseolusvulgaris L.) e seus componentes. RevCi Agronômica 42,132–138.
Carvalho I.R. et al. 2013. Demanda hídrica das culturas de interesse agronômico. Enciclopédia Biosfera. 9, 100-110. Conab 2015. Acompanhamento da Safra Brasileira de Grãos.
Brasília: Ed Conab, 100p.
Cruz C.D. 2013. GENES: a software package for analysis in experimental statistics and quantitative genetics. Acta Scientiarum. Agronomy 35, 271–276.
Cruz C.D. and Regazzi, A.J. Modelos biométricos aplicados ao melhoramento genético. Viçosa: 2 Ed UFV, 450p. Cruz, C.D. et al. 2012. Modelos Biométricos Aplicados ao
Melhoramento Genético. Viçosa: 4 Ed UFV, 400p. Demari, G.H. et al. 2015. Feijão em época não preferencial
submetido a doses de nitrogênio e seu impacto nos caracteres agronômicos.Enciclopédia Biosfera11, 1102– 1112.
Falconer, D.S. 1987. Introdução à genética quantitativa. Viçosa: UFV, 200p.
Gomes Junior, F.G. et al. 2005. Teor de proteína em grãos de feijão em diferentes épocas e doses de cobertura nitrogenada. Acta Scientiarum. Agronomy 27, 100-110. Kureka et al. 2012. Análise de trilha como critério de seleção
indireta para rendimento de grãos em feijão.
CurrentAgricultural Science and Technology7, 25-35. Mingotte, F.L.C. et al. 2014. Sistemas de cultivo antecessores
e doses de nitrogênio em cobertura no feijoeiro em plantio direto. BioscienceJournal30, 100-110.
Ramalho, M.A.P. et al. 2012. Genética na agropecuária. Lavras: 5 Ed. UFLA, 400p.
Silva, H. 2005. Descritores mínimos indicados para caracterizar cultivares/variedades de feijão comum (Phaseolusvulgaris L.). Brasília: Ed Embrapa, 25p. Singh, D. 1981. The Relative Importance of Characters
Affecting Genetic Divergence. Indian Journal of Genetics and Plant Breeding, 42,237–245.
Sokalr, R. and Rohlf, F.J. 1962. The Comparison of Dendrograms by Objective Methods. Taxon, 11,33–4.