warwick.ac.uk/lib-publications
Manuscript version: Author’s Accepted ManuscriptThe version presented in WRAP is the author’s accepted manuscript and may differ from the published version or Version of Record.
Persistent WRAP URL:
http://wrap.warwick.ac.uk/110193
How to cite:
Please refer to published version for the most recent bibliographic citation information. If a published version is known of, the repository item page linked to above, will contain details on accessing it.
Copyright and reuse:
The Warwick Research Archive Portal (WRAP) makes this work by researchers of the University of Warwick available open access under the following conditions.
Copyright © and all moral rights to the version of the paper presented here belong to the individual author(s) and/or other copyright owners. To the extent reasonable and
practicable the material made available in WRAP has been checked for eligibility before being made available.
Copies of full items can be used for personal research or study, educational, or not-for-profit purposes without prior permission or charge. Provided that the authors, title and full
bibliographic details are credited, a hyperlink and/or URL is given for the original metadata page and the content is not changed in any way.
Publisher’s statement:
Please refer to the repository item page, publisher’s statement section, for further information.
Counting bubbles: precision process control of gas-liquid
reactions in flow with an optical inline sensor
Nikolay Cherkasova,b,*, Antonio José Expósitoa,b, Yang Baia, Evgeny V. Rebrova,b,c,*
a School of Engineering, University of Warwick, Coventry CV4 7AL, UK
b Stoli Catalysts Ltd, Coventry, CV3 4DS, UK
c Department of Biotechnology and Chemistry, Tver State Technical University, 170026, Nab. A. Nikitina 22, Russia,
Corresponding authors: n. [email protected], [email protected]
Abstract
Quality by Design encouraged by the US Food and Drug Administration (FDA) in the continuous flow synthesis requires tight monitoring of all the reaction input and output parameters to improve reproducibility and eliminate the process rejects. The reaction monitoring, however, relies on costly (above 10,000$) process analytical technology (PAT) – one of the factors that prevents a wider utilisation of continuous processes. In the work, we show that gas-liquid reactions can be monitored using low-cost (10$) hardware – optical liquid inline sensors – that allows instantaneous analysis of gas fraction in the moving stream. We discuss the application of the sensor for various gas-liquid reactions. The gas-consuming reactions such as hydrogenation are the easiest to implement because the sensor without calibration provides accurate readings close to complete consumption of the gas. The gas-evolving reactions can be monitored but require sensor calibration to determine the gas fraction accurately. Operation of the sensor was demonstrated for various hydrogenation reactions self-optimised using a proportional-integral (PID) algorithm which adjusted the substrate concentration to provide high (but not full) pre-defined hydrogen consumption. The optimised hydrogen consumption agreed with the product analysis for a range of the substrates hydrogenated under various pressures and with different selectivities. The optical sensor was also proven to be an efficient tool in adapting the reaction condition to the catalyst deactivation in the reaction of
2-methyl-3-butyn-2-ol semi-hydrogenation – the autonomous reactor allowed reaching a turn-over number (TON) of 2.7·106 with the value of 1.5·107 expected till a twofold decrease in the catalyst activity. The TON values demonstrated are significantly higher than those observed in batch reactors (~103) even in case of catalyst re-use (105) demonstrating a substantial improvement of process sustainability operating with the process control.
1. Introduction
Gas-liquid reactions are widespread in the chemical industry and range from oil desulfurization performed on a gigaton scale to metathesis on a gram scale. Gas-liquid reactions involve numerous reaction classes and functional groups, but hydrogenations are particularly important because of versatility, and often perfect atom efficiency.1–3
A majority of hydrogenation reactions in the fine and pharma industries are carried out in stirred-tank batch reactors.4,5 Low production and economic performance shown by the batch reactors comes from mass and heat transfer limitations as well as myriad operations such as substrate loading, heating, cooling, and reactor cleaning – repetitive and non-productive. The performance can be enhanced with the continuous flow chemistry.6,7
reactions, such as hydrogenations, have lower reaction rates and their hydrodynamics is more difficult to control resulting in a limited reproducibility.14
The gas-liquid reactions often require a solid catalyst making them three-phase reactions. High pressure drop, limited product selectivity, formation of hot spots and associated quick catalyst deactivation are usual problems.15–17 The exact control of residence time is another problem because different two-phase flow regimes can co-exist in different parts of the reactor.16,17
Nevertheless, there are ample examples of carrying out the gas-liquid reactions with high selectivity in a continuous fashion achieving excellent catalyst utilisation and process intensification.18–21
Another barrier for a wider adoption of continuous flow manufacturing for liquid-phase as well as gas-liquid reactions comes from the need for precise process monitoring, automation and control. Control of all the input operational parameters (temperature, pressure and flow rates) as well as the main reaction indicators (conversion, selectivity) is the key for reproducible process operation.
In a manufacturing process, autonomous operation of the continuous flow processes decreases the labour costs and improves process safety.9,22–24 Product quality obtained under the precise process control is ensured and any abnormalities are detected and eliminated.25 The US regulator, Food and Drug Administration (FDA), encourages adoption of continuous flow processes because they
provide the Quality by Design.26,27
In a research environment, autonomous operation of a flow reactor improves efficiency allowing unprecedented testing throughput and improved reproductivity of the processes.28 Self-optimisation of reaction conditions is one of such examples – the process where the software finds the optimum conditions without human interaction.9,23,29–32 Months of the experimental work can be performed in days.
Monitoring the input reaction parameters is straightforward and involves standard equipment such as flow meters, temperature and pressure transducers.11 Monitoring the output reaction parameters is, unfortunately, significantly more difficult because it often requires gaining insights into the
chemical composition. The literature shows examples of using online chromatography, NMR, mass, IR, Raman and UV-vis spectroscopy.24,28,33–36 Selecting a proper reaction monitoring tool involves finding a balance between the (i) price of the process monitoring solution, (ii) versatility for various reactions, and (iii) data quality and acquisition speed. Quality of data is, not surprisingly, prioritized and the process monitoring tools cost above $10,000 a unit – prohibitively expensive for many labs.
High equipment price and uncertainties in process monitoring impose limitations on process automation. In the current work, we show that excellent data quality in gas-liquid reactions can be achieved at high acquisition speed with low-cost equipment. A 10$ inline optical sensor can be used to control reaction conditions precisely. The sensor can also be employed in self-optimisation of reaction conditions to provide the required gas consumption and maintain the product yield regardless of the course of catalyst deactivation.
2. Experimental
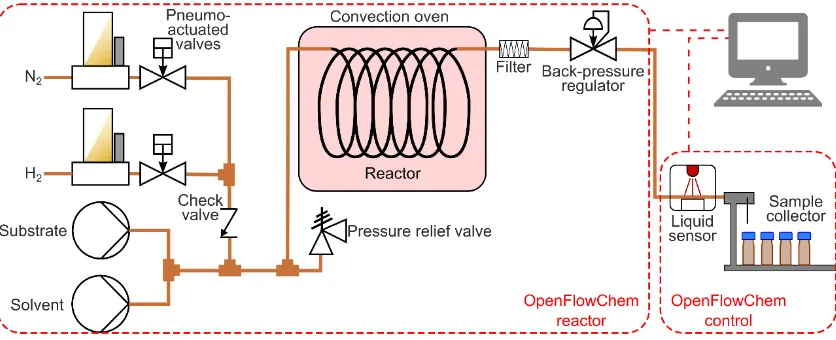
The hydrogenation experiments were performed in an automated system described in our previous work.37 Briefly, the system included two HPLC pumps (Knauer P4.1S) to control the liquid flow rates (Fig. 1). The gas flow rates were set with a set of mass flow controllers (Bronkhorst) and pneumo-actuated valves (Swagelok) placed afterwards.37 The gas and liquid flows were combined in a T-mixer (IDEX). A reactor was placed in a convection oven followed by a back-pressure controller (Equlibar). The reaction was performed in catalyst-coated tube reactors (1.27mm inner diameter, 1.6 mm outer diameter) provided by Stoli Catalysts Ltd. The catalyst-coated tubes were used to avoid problems associated with liquid channelling and residence time distribution inherent to
and a Stabilwax column 10 m x 0.15 mm x 0.15 μm. Product conversion and selectivity were calculated using equations provided in the Electronic Supplementary Information, S1.
Fig. 1. Scheme of the hydrogenation reactor with a feedback control and process monitoring with an optical sensor.
The reactor was controlled with an OpenFlowChem software37 and contained two systems: (i) the flow reactor until the back-pressure regulator, (ii) and a control system containing the optical sensor and the sample collector. The flow reactor was executing the pre-defined reaction conditions (flow rates, temperature, pressure). The reactions were performed by mixing a 0.5 M substrate solution with isopropanol solvent to maintain a constant liquid flow rate of 1.5 mL min-1 at a reaction temperature of 50-90 oC and pressure of 1.3-6.0 bar (absolute). A simplified system used for the validation of the optical sensor is described in the Electronic Supplementary Information, S2.
3. Results and Discussion
3.1. Head-on approach: combine equimolar quantities and let them react
First of all, we would like to discuss why semi-hydrogenation may benefit from complex process control. Indeed, the best control measures are often passive. In case of a temperature control, for example, overheating can be prevented in some cases without any process control because the heat dissipation rate increases with temperature.38 The next step in the process control complexity might be a bimetallic strip that bends at known temperatures or a phase-change material that consumes heat – both are simple and reliable for maintaining a process temperature.39,40 In case of hydrogenation, it is possible to avoid complex process monitoring and rely on a performance margin. The reaction can be carried out at a contact time longer than required so that deactivation and external disturbances do not affect the full conversion.
As an example, we took alkyne (MBY) semi-hydrogenation to alkene (2-methyl-3-buten-2-ol, MBE) shown in Fig. 2 as a model and the compound used vitamin synthesis.3 A straightforward approach to control the reaction could be feeding an equimolar combination of MBY and H2 with a sufficient contact time for full H2 consumption – the performance margin.
Fig. 2. Scheme of the 2-methyl-3-butyn-2-ol (MBY) semi-hydrogenation with alkene the desired product.
Operating catalysts under hydrogen-lean conditions, unfortunately, brings a lot of problems outlined in Table 1. First of all, the performance margin introduced provides a sub-optimal reactor
study is required before using the approach. Thirdly, the catalysts tend to leach in the absence of hydrogen.41 Leaching brings contamination of the product stream which might require additional purification. Leaching also alters and removes the catalyst resulting in faster deactivation with more frequent reactor maintenance cycles.41–43 Lastly, any contact time beyond the minimum facilitates side reactions such as isomerisation, oligomerisation, or decomposition.44 Therefore, simplicity brought with the performance margin is fraught with problems.
Table 1. Comparison of controlling a semi-hydrogenation reaction by ensuring complete consumption of a limited amount of hydrogen.
Advantages Disadvantages
Simplicity Underutilised performance
Quick to set-up Stability optimisation required
No need for process control equipment Accelerated catalyst deactivation by leaching
Product contamination by catalyst leaching
Side-reactions
[image:5.595.182.413.473.636.2]Simplicity, nevertheless, might be a substantial incentive to try this simple process control approach. We performed an experimental study of MBY semi-hydrogenation in a 1 m tube reactor wall-coated with a 2.3 wt% Pd/C catalyst. Because the extent of the required performance margin cannot be predicted in advance, we gradually increased the reaction pressure and collected the products. The initial H2 to MBY molar ratio was kept at 105% to ensure high MBE yield despite unavoidable over-hydrogenation to MBA (Fig. 2) that consumes twice as much H2 as MBE.
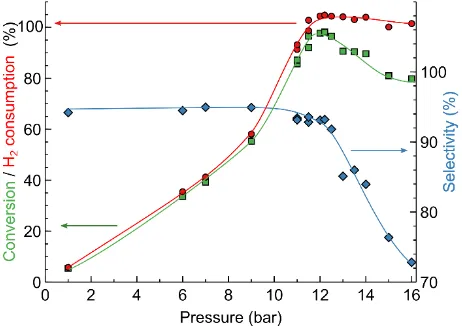
Fig. 3 shows the effect of reaction pressure on the MBY conversion and MBE selectivity. On increasing pressure from 1 to 11 bar, the MBY conversion increased because of (i) the higher reaction rate which is proportional to the H2 pressure18,45 and (ii) a longer liquid residence time due to compression of H2 bubbles at higher pressure. The MBE selectivity in the 1-11 bar range was 93-95% which is typical for supported Pd catalysts.18,46–49
Fig. 3. Effect of reaction pressure on MBY semi-hydrogenation performance over a 2.3 wt% Pd/C
catalyst-coated tube: (■) MBY conversion, (♦) MBE selectivity, and (●) H2 consumption calculated
from product composition. Reaction conditions: 0.5 mL min-1 5M MBY, 35 oC, 5% molar excess of
H2 to MBY.
At a pressure of 12 bar, the conversion reached the maximum value of 98.1% and decreased the MBE selectivity to 93%. The decrease in selectivity at a high conversion is known to appear from the competitive adsorption of the dominant alkene and minor alkyne species onto the Pd
consumption. The product composition confirmed that MBY consumed 103% molar equivalent of H2, in agreement with the introduced feed ratio.
Above 12 bar, H2 had already been fully consumed. A further increase in pressure was expected to bring changes neither in the MBE selectivity nor in conversion. On the contrary, the experimental data showed a decrease both in the MBE selectivity and the MBY conversion (Fig. 3). The
performance margin introduced by the higher reaction pressure did not provide the desired control over the reaction. Study of this effect is beyond the scope of this work, but it was found to be reproducible over a range of catalysts, pressures and concentrations. This simple model reaction clearly demonstrates that the “performance margin” may bring anything but performance and some form of “complex” process control is beneficial.
3.2. Applicability of an optical sensor
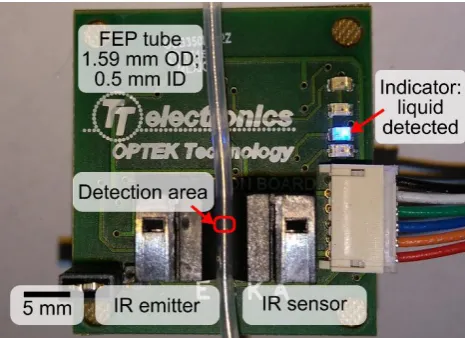
[image:6.595.181.414.325.494.2]We used a commercially-available 10$ Optek liquid optical sensor for the process monitoring. The sensor consists of an infrared light-emitting diode and a photo-transistor with a transparent 1/16” tube in between (Fig. 4). The sensor detects liquid based on light refraction and allows analysing optically-transparent liquids such as water. The output is a binary signal – the presence or absence of liquid in the detection volume of below 0.2 μL. The sensor has an excellent response speed typically an order of 50 μs; therefore, the measurements can be reliably performed on quickly-moving feeds.
Fig. 4. Photograph of the Optek optical sensor with 1.59 mm OD tubing.
We used the optical sensor to determine liquid fraction (LF) – the fraction of liquid in the gas-liquid flow by reading the liquid presence every 100 μs and averaging the data over 10 s. The response time of 10 s is considerably faster than chromatography and is comparable to the spectroscopy.
The accurate LF measurements are obviously possible only for the Taylor flow regime because the relative abundance of liquid slugs is expected to provide the LF.51,52 The annular or slug-annular flow regimes, where the liquid film moves along the reactor wall as a film,19,53,54 seem unsuitable for the detection. This is because the light refraction properties of the film may depend on the media, film thickness and velocity to result in false readings.
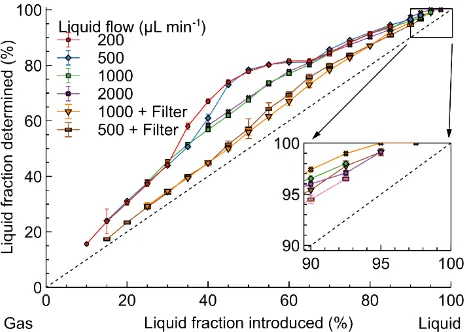
When the gas-liquid flow was formed with a T mixer (Fig. 5), a broad “hump” appeared at the 30-60% LF for the liquid flow rates of 200 and 500 μL min-1. At higher liquid flow rates, the “hump” disappeared and the LF readings were consistent (within 2%).
[image:7.595.55.288.189.355.2]The T mixer, however, generated Taylor flow with constant gas and liquid bubble sizes – not always the flow observed in the hydrogenation.15,18,19,47 Therefore, we placed a large-volume filter (300 μL) after the T mixer to introduce flow irregularity. With the filter, no “hump” was observed and the LF readings became considerably closer to the expected LF values likely because the slugs were longer resulting in a smaller number of inter-phase boundaries. However, there was a significant discrepancy between the LF readings observed with and without the filter.
Fig. 5. Comparison of the liquid fraction introduced and determined by the optical sensor in the
model isopropanol-N2 flow.
Therefore, the LF readings of the optical sensor depend significantly on the liquid flow rates and slug lengths. The difficulty in controlling the slug lengths after the reactor outlet is a limiting factor in the applicability of process monitoring with the optical sensor. The zoomed-in area in Fig. 5,
[image:7.595.58.289.519.656.2]however, demonstrates that the LF readings above 95% become consistent. Nevertheless, there is also a risk of falsely obtaining 100% LF readings when a small amount of gas is present in the flow – at the introduced LF above 95%. This phenomenon comes, likely, from the sensor inability to detect gas in the bubbly flow – the regime where the gas bubbles are substantially smaller than the channel diameter.54–56
Fig. 6. Summary of the optical sensor applicability for monitoring various types of gas-liquid reactions.
be used to overcome the problem. A possible solution in this example is dissolving CO2 in the liquid media at a high pressure or adding a gas-absorbing alkaline solution. In these cases, the simplicity of the optical sensor may be counterbalanced by complexity introduced by the additional gas-absorption system.
Gas-evolving reactions (Fig. 6B) such as decarbonylation can be monitored easier with the optical sensor because the LF changes substantially during the reaction. The strong dependence of the LF readings on the liquid flow rate and slug length (Fig. 5), however, require additional efforts for process monitoring. The optical sensor must be calibrated for the required flow rates with, possibly, slug length control by image analysis.
Gas-consuming reactions (Fig. 6C) such as hydrogenation seem the most suitable for monitoring with the optical sensor. Reliable readings in the LF range of 95-97%, possible without sensor calibration, are beneficial in ensuring almost complete gas consumption. A few remaining hydrogen bubbles saturate the solution and minimise side-reaction and catalyst leaching.41,42 A minor
hydrogen content in the product feed maximises residence time and the reactor throughput. In summary, the negative consequences discussed in Table 1 are eliminated.
3.3. Optimising hydrogenation: adjusting substrate concentration to obtain a specified hydrogen consumption
In the work, we used the optical sensor to monitor hydrogenation reactions because these gas-consuming reactions are vital in many fine chemical syntheses.1,3 The experimental system
presented in Fig. 1 combined the flows of (i) H2, (ii) a solvent and (iii) a substrate solution. Following the unsuccessful attempts to control the MBY semi-hydrogenation by complete H2 consumption in Fig. 3, we used the optical sensor to monitor and maintain high (but not complete) H2 consumption with the same 2.3 wt% Pd/C catalyst-coated tube.
Optimisation was performed using a proportional-integral (PID) algorithm. The LF reading was a process variable (setpoint of 95%), and the MBY concentration was a control variable adjusted to reach the setpoint. Compared to conventional optimisation algorithms such as simplex,23,24,57 the PID algorithm does not assume implacable experimental reproducibility and can handle slow changes in the reaction performance caused by usual phenomena such as catalyst
activation/deactivation.18,58 The flow rates of H
2 and solvent were also adjusted by the algorithm, but these were linked to the MBY flow rate by the pre-defined H2 to MBY molar feed ratio and the total liquid flow rate. After reaching the LF setpoint, the system collected the 4 liquid samples for the offline GC verification.
Fig. 7A shows the change in the MBY and H2 flow rates over the time on stream in the system controlled with an optical sensor. The PID algorithm, using the LF readings, automatically adjusted the MBY flow rate to maintain the LF at 95%. During the experiment, the H2/MBY feed ratio
increased stepwise and the LF values dropped momentarily to about 80%. The diminishing LF was compensated by the system with decreasing MBY flow rates allowing for a longer MBY residence time to consume more H2.
Fig. 7. MBY semi-hydrogenation in a 2.3 wt% Pd/C catalyst-coated tube. (A) Performance of the optical sensor and PID reactor control in maintaining the product Liquid Fraction to 95 %. (B) The
effect of the H2/MBY feed ratio on the product composition. Concentration 0.39-0.43 M, 70 oC and
2.5 bar.
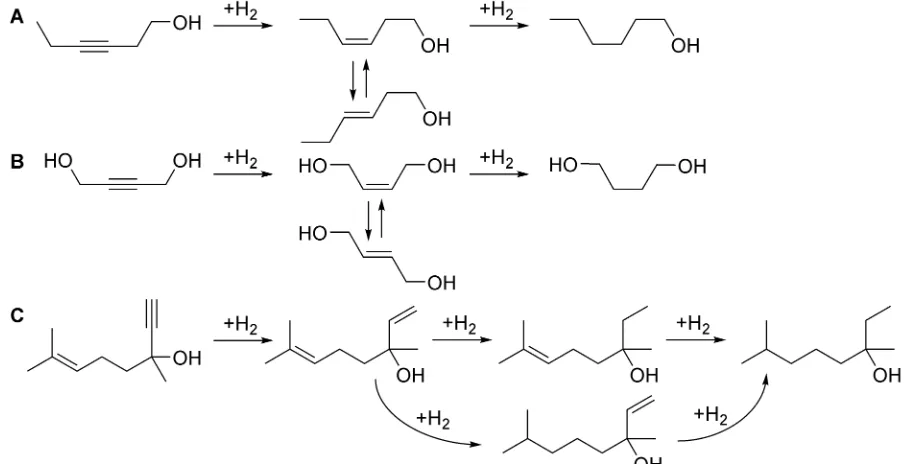
To validate the process control with the optical sensor, we studied hydrogenation of 3-hexyne-1-ol, a widely used fragrance compound and a model molecule for internal alkyne semi-hydrogenation.59– 61 The possible hydrogenation reactions are shown in Fig. 8A.
Fig. 8. Schemes of (A) 3-hexyne-1-ol, (B) 1,4-butyndiol, and (C) dehydrolinalool hydrogenation reactions.
Hydrogenation of 3-hexyne-1-ol was studied in 2.3 wt% Pd/SiO2 and 2.3 wt% Pd/ZnO catalysts-coated tubes. The Pd/ZnO catalyst often provides a higher alkene selectivity in the alkyne semi-hydrogenation.19,20,45,46 Compared to MBY (Fig. 7B), the range of 3-hexyne-1-ol hydrogenation products was wider and a significant E-alkene formation was observed caused by Z/E
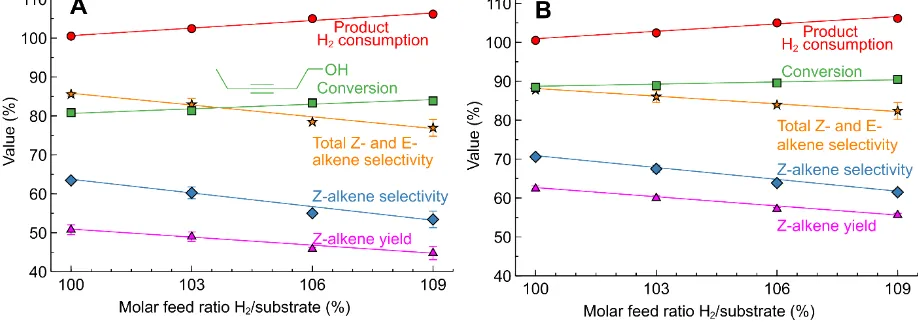
isomerisation.59–61 The increasing H2/substrate feed ratio over the Pd/SiO2 (Fig 8A) catalyst resulted in a higher alkyne conversion (from 80 to 85%) but lower Z-alkene selectivity (from 64 to 55%). The highest yield of the Z-alkene was 50.5 % at the H2/substrate feed ratio of 100 %. The results
observed over the Pd/ZnO catalyst (Fig. 9B) confirm the expected Z-alkene selectivity increase, which reached 70 % with the maximum yield of 62 % at the H2/substrate feed ratio of 100%.
[image:9.595.51.507.340.572.2]precise process control of the H2 consumption is possible even in case of substantial side-reactions. The precision of process control is evidenced by the excellent agreement between the H2/substrate feed ratio and the H2 consumption calculated from the product chemical composition.
Fig. 9. 3-hexyne-1-ol semi-hydrogenation in (A) 2.3 wt% Pd/SiO2 and (B) 2.3 wt% Pd/ZnO
catalyst-coated tubes at various H2/substrate feed ratios. Concentration 0.15-0.22 M, 50 oC and 1.3 bar. H2
consumption calculated from product composition. The reactor self-optimised liquid fraction to 95% for each feed ratio selected.
Using the same approach, the study was extended to 1,4-butyndiol semi-hydrogenation (Fig. 8B), another model molecule with internal the triple bond and the possibility to form Z- and E- alkenes. In this reaction, we used the more selective 2.3 wt% Pd/ZnO catalyst-coated tube reactor, but the reaction conditions were considerably harsher compared these studied previously. The reaction pressure was increased to 5 bar and the reaction temperature to 90 oC due to lower hydrogenation activity (in agreement with the literature)62 likely caused by the steric limitation introduced by the OH groups.
Fig. 10. 1,4-butyndiol semi-hydrogenation performance over a 2.3 wt% Pd/ZnO catalyst-coated
tubes at various H2/substrate feed ratios. Concentration 0.10-0.13 M, 90oC and 5 bar. The reactor
self-optimised liquid fraction to 95% for each feed ratio selected.
The H2 consumption determined from the product analysis showed good agreement with the H2/substrate feed ratio. It is particularly interesting considering not only as demonstration of the process control with a different molecule, but also because a substantially higher reaction pressure was used. The agreement between the anticipated and the observed values shows that the H2 gas dissolved in the product feed quickly expands after the back-pressure regulator so the
measurement with the optical sensor remains accurate even despite the increased reaction pressure.
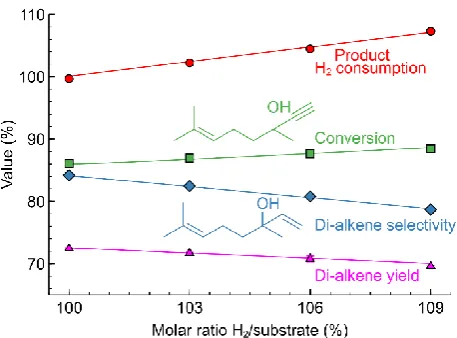
To explore the possibility to control more complex reactions, we studied semi-hydrogenation of dehydrolinalool (DLL), a precursor to linalool fragrance – the molecule that contains a triple as well as a double bond and has a broader range of possible hydrogenation products (Fig. 8C). Fig. 11 shows the effect of the H2/substrate feed ratio on the product distribution observed over the 2.3 wt% Pd/ZnO catalyst-coated tube. The target di-alkene (linalool) selectivity was only 84 - 79 % at the conversion of 88-90%. The resulting linalool yield decreased from 72% to 70% with the addition of the H2 excess highlighting that the higher yield in this reaction requires catalyst optimisation. Nevertheless, the H2 consumption determined from the product composition showed an excellent agreement with the H2/substrate feed ratio.
Fig. 11. Dehydrolinalool semi-hydrogenation performance in a 2.3 wt% Pd/ZnO catalyst-coated
tubes at various H2/substrate feed ratios. Concentration 0.10-0.14 M, 50 oC and 1.3 bar. The reactor
self-optimised liquid fraction to 95% for each feed ratio selected.
[image:11.595.55.284.508.677.2]concentration to obtain the desired H2 consumption with the accuracy of ± 3% and the product yield repeatability better than ± 0.4%. The autonomous reactor with the LF monitoring provided, in our experience, a factor of 3-10 faster optimisation of the reaction parameters compared to using offline chemical analysis as a reaction monitoring solution.
3.4. Continuous optimisation: maintaining hydrogen consumption in semi-hydrogenation despite deactivation
PID control with the optical sensor may be used not only to find optimal reaction conditions, but to maintain high product conversion despite catalyst deactivation. In the previous work,37 we
demonstrated operation of a PID controller in nitrobenzene to aniline hydrogenation of over a short period of time. Here, we aimed to maximise catalyst utilisation in a reaction with possible over-hydrogenation. For this task, reaction monitoring and control are critical in maintaining high substrate conversion regardless of inevitable catalyst deactivation.
[image:12.595.62.520.503.692.2]We selected the MBY semi-hydrogenation as a model reaction. The reaction poses problems of over-hydrogenation without the active process control (Fig. 3). Additionally, the reaction is well studied allowing to apply process intensification to maximise the turn-over number (TON) within a manageable time on stream.18 Under conventional conditions of constant flow rates (Electronic Supplementary Information, S3), the MBY conversion declines slowly after a brief increase. Active control of the flow rates provides an opportunity to maintain product yield regardless of changes in catalyst behaviour.
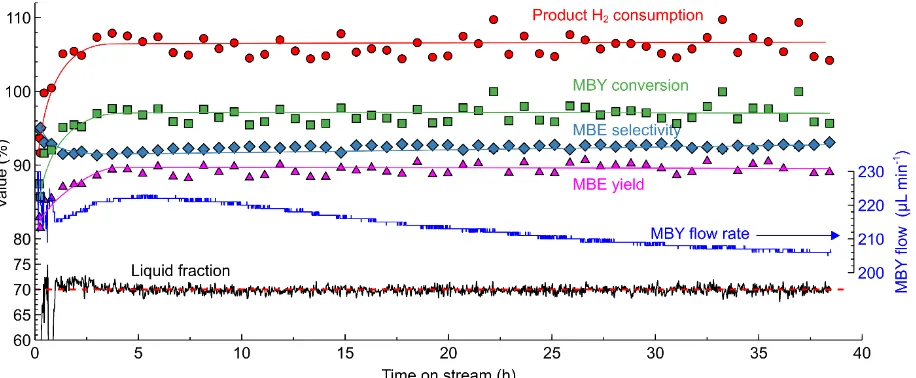
Fig. 12 shows the time on stream experiment carried out in a 2.3 wt% Pd/ZnO catalyst-coated tube in MBY semi-hydrogenation at 100 oC and 9 bar pressure – the conditions chosen to increase the reaction rates. The increasing reaction rates had to be compensated by the higher fluid velocity to ensure adequate mixing and high MBE selectivity by setting the LF setpoint to 70% and optimising the H2/MBY ratio for the H2 consumption of 106%. On starting the reactor, the system adjusted the MBY concentration to maintain the LF readings despite changes in the catalyst behaviour. These changes can be noticed in the MBY flow rates (Fig. 12) which were increasing during the first 5 hours on stream and decreasing afterwards likely caused by catalyst activation and deactivation phenomena. This example highlights that only a feedback control algorithm (in contrast to feed-forward or real-time)65 can be used to maintain constant H
2 consumption because the catalyst activation/deactivation phenomena are contingent and are difficult to foresee.
Fig. 12. Long-term stability study in MBY semi-hydrogenation in a 0.5 m catalyst-coated tube (2.3 wt% Pd/ZnO) controlled by the optical sensor. Reaction conditions: MBY diluted with isopropanol to
1 mL min-1 total flow rate, 100 oC, 9 bar H
2, 6 % molar excess of H2 to MBY. The reactor optimised
The samples collected periodically for the offline GC analysis show that the system successfully maintained high MBY conversion and MBE yield. The yield of 89.6±1.0 % observed is close to the limit possible with a monometallic Pd catalyst. Importantly, MBE yield was virtually constant regardless of the catalyst behaviour demonstrating the performance of the optical sensor.
In this experiment, the TON value (which shows the number of molecules converted per atom of Pd) exceeded 2.7·106, while the catalyst activity was far from exhausted. Indeed, the MBY flow rate decreased only by 6.7% compared to the initial value demonstrating that the catalyst was far from deactivated. Extrapolating the observed trend considering the exponential decline in the activity, 50% catalyst deactivation will allow reaching the TON value of 1.5·107 in 280 h on stream.
The TON values obtained are drastically higher than in conventional batch reactors, where the typical values are an order of 103. Batch hydrogenation with the catalyst reuse can provide TON values of 104-105. The notably higher TON in the catalyst-coated tube reactors possible with the optical sensor monitoring demonstrates exceptionally efficient noble metal utilisation. A substantially lower metal requirement, in turn, improves economics of the process and has a potential to
introduce more efficient platinum-group catalysis into the base-metal hydrogenation.
4. Conclusion
The 10$ refractory liquid optical sensor was shown to be an efficient process monitoring tool in controlling semi-hydrogenation reactions. The approach combines simplicity, robustness, low cost with high reproducibility required to optimise and maintain a constant hydrogen consumption. High reliability and precision provided by the sensor allow its use in complete as well as selective hydrogenation reactions. The response time of 10 s eliminates analytical delays in process control and excessive material consumption.
The autonomous system with the process monitoring performed by the optical sensor was demonstrated in several examples of semi-hydrogenation reactions. The proportional-integral-derivative (PID) algorithm allowed for reaction condition optimisation – finding the optimal conditions to ensure the required hydrogen consumption. In the examples, it took 2-15 min to find the
conditions and collect a liquid sample for external analysis. Because the system finds and maintains the hydrogen to substrate molar ratio defined by the experimenter, the number of conventional chemical analyses decreases dramatically. With the process control, moreover, all the samples collected have high substrate conversion eliminating the need to analyse many low-conversion samples. In our experience, using the process monitoring with an optical sensor provides
acceleration in reaction optimisation a factor of 3-10 compared to using offline chemical analysis as a process monitoring solution.
The utilisation of the process monitoring allows not only for optimisation of reaction conditions but maintaining the given hydrogen consumption over a long period of time. The experiment was performed using a model MBY semi-hydrogenation reaction under the intensified reaction
conditions during 39 hours on stream at the MBE yield of 89.6 ± 1.0% to obtain a turn-over number of 2.7·106. It is a more than 3 orders of magnitude above the typical batch reactor processes. Therefore, catalyst-coated tube reactors combined with simple yet robust process monitoring by the optical sensor provide an exceptional utilisation of noble metal catalysts.
Acknowledgement
The authors are grateful to DSM Nutritional Products for the dehydrolinalool provided and Dr Jonathan Medlock for fruitful discussion of the work. The financial support was provided by the InnovateUK grant (900041).
Conflict of interest
5. References
1 M. Brzozowski, M. O’Brien, S. V. Ley and A. Polyzos, Acc. Chem. Res., 2015, 48, 349–362.
2 J. S. Carey, D. Laffan, C. Thomson and M. T. Williams, Org. Biomol. Chem., 2006, 4, 2337– 47.
3 W. Bonrath, J. Medlock, J. Schutz, B. Wustenberg, T. Netscher, B. Wüstenberg and T. Netscher, Hydrogenation in the Vitamins and Fine Chemicals Industry – An Overview, In: I.
Karame (Ed.) Hydrogenation, InTech, Rijeka, 2012, pp. 69-90., InTech, 2012.
4 E. H. Stitt, Chem. Eng. J., 2002, 90, 47–60.
5 G. S. Calabrese and S. Pissavini, AlChe, 2011, 57, 828–834.
6 V. Hessel, D. Kralisch, N. Kockmann, T. Noël and Q. Wang, ChemSusChem, 2013, 6, 746–
789.
7 D. M. Roberge, L. Ducry, N. Bieler, P. Cretton and B. Zimmermann, Chem. Eng. Technol., 2005, 28, 318–323.
8 C. Wiles and P. Watts, Green Chem., 2012, 14, 38–54.
9 K. F. Jensen, AlChe, 2017, 63, 858–869.
10 J. Yoshida, Y. Takahashi and A. Nagaki, Chem. Commun., 2013, 49, 9896–9904.
11 M. B. Plutschack, B. Pieber, K. Gilmore and P. H. Seeberger, Chem. Rev., 2017, 117, 11796–11893.
12 S. V. Ley, D. E. Fitzpatrick, R. J. Ingham and R. M. Myers, Angew. Chemie - Int. Ed., 2015, 54, 3449–3464.
13 M. Irfan, T. N. Glasnov and C. O. Kappe, ChemSusChem, 2011, 4, 300–16.
14 D. van Herk, P. Castaño, M. Makkee, J. A. Moulijn and M. T. Kreutzer, Appl. Catal. A Gen., 2009, 365, 199–206.
15 Y. Bai, N. Cherkasov, S. Huband, D. Walker, R. Walton and E. Rebrov, Catalysts, 2018, 8, 1– 18.
16 J. Yue, Catal. Today, , DOI:10.1016/j.cattod.2017.09.041.
17 A. Tanimu, S. Jaenicke and K. Alhooshani, Chem. Eng. J., 2017, 327, 792–821.
18 N. Cherkasov, Y. Bai and E. Rebrov, Catalysts, 2017, 7, 1–16.
19 N. Cherkasov, A. O. Ibhadon and E. V. Rebrov, Appl. Catal. A Gen., 2016, 515, 108–115.
20 L. B. Okhlopkova, S. V. Cherepanova, I. P. Prosvirin, M. A. Kerzhentsev and Z. R. Ismagilov,
Appl. Catal. A, 2018, 549, 245–253.
21 Z. Wu, E. Calcio Gaudino, M. Manzoli, K. Martina, M. Drobot, U. Krtschil and G. Cravotto,
Catal. Sci. Technol., 2017, 7, 4780–4791.
22 J. C. Pastre, D. L. Browne and S. V Ley, Chem. Soc. Rev., 2013, 42, 8849–69.
23 V. Sans and L. Cronin, Chem. Soc. Rev., 2016, 45, 2032–2043.
24 B. J. Reizman and K. F. Jensen, Acc. Chem. Res., 2016, 49, 1786–1796.
25 S. Mascia, P. L. Heider, H. Zhang, R. Lakerveld, B. Benyahia, P. I. Barton, R. D. Braatz, C. L. Cooney, J. M. B. Evans, T. F. Jamison, K. F. Jensen, A. S. Myerson and B. L. Trout, Angew.
Chemie - Int. Ed., 2013, 52, 12359–12363.
https://blogs.fda.gov/fdavoice/index.php/2016/04/continuous-manufacturing-has-a-strong-impact-on-drug-quality/, (accessed 6 July 2017).
27 S. L. Lee, T. F. O’Connor, X. Yang, C. N. Cruz, S. Chatterjee, R. D. Madurawe, C. M. V. Moore, L. X. Yu and J. Woodcock, J. Pharm. Innov., 2015, 10, 191–199.
28 D. Perera, J. W. Tucker, S. Brahmbhatt, C. J. Helal, A. Chong, W. Farrell, P. Richardson and N. W. Sach, Science, 2018, 359, 429–434.
29 N. Holmes, G. R. Akien, A. J. Blacker, R. L. Woodward, R. E. Meadows and R. A. Bourne,
React. Chem. Eng., 2016, 1, 366–371.
30 V. Sans, L. Porwol, V. Dragone and L. Cronin, Chem. Sci., 2014, 6, 1258–1264.
31 A. Echtermeyer, Y. Amar, J. Zakrzewski and A. Lapkin, Beilstein J. Org. Chem., 2017, 13, 150–163.
32 D. E. Fitzpatrick and S. V Ley, Tetrahedron, 2017, 74, 3087–3100.
33 A. J. Parrott, R. A. Bourne, G. R. Akien, D. J. Irvine and M. Poliakoff, Angew. Chemie - Int. Ed., 2011, 50, 3788–3792.
34 D. E. Fitzpatrick, C. Battilocchio and S. V. Ley, Org. Process Res. Dev., 2016, 20, 386–394.
35 Z. Amara, E. S. Streng, R. A. Skilton, J. Jin, M. W. George and M. Poliakoff, European J.
Org. Chem., 2015, 2015, 6141–6145.
36 E. Danieli, J. Perlo, A. L. L. Duchateau, G. K. M. Verzijl, V. M. Litvinov, B. Blümich and F. Casanova, ChemPhysChem, 2014, 15, 3060–3066.
37 N. Cherkasov, Y. Bai, A. J. Exposito and E. V. Rebrov, React. Chem. Eng., 2018, article ASAP.
38 L. P. Pagani, G. E. Apostolakis, P. Hejzlar, L. P. Pagani, G. E. Apostolakis and P. Hejzlar,
Nucl. Technol., 2005, 149, 129–140.
39 T. Narushima, N. T. Kinahan and J. J. Boland, Rev. Sci. Instrum., 2005, 76, 095113-1–5.
40 R. Kizilel, A. Lateef, R. Sabbah, M. M. Farid, J. R. Selman and S. Al-hallaj, J. Power Sources, 2008, 183, 370–375.
41 P. Albers, J. Pietsch and S. F. Parker, J. Mol. Catal. A Chem., 2001, 173, 275–286.
42 M. Argyle and C. Bartholomew, Catalysts, 2015, 5, 145–269.
43 J. A. Moulijn, A. E. Van Diepen and F. Kapteijn, Appl. Catal. A Gen., 2001, 212, 3–16.
44 S. Kataoka, Y. Takeuchi, A. Harada, T. Takagi, Y. Takenaka, N. Fukaya, H. Yasuda, T. Ohmori and A. Endo, Appl. Catal. A Gen., 2012, 427–428, 119–124.
45 E. V Rebrov, E. A. Klinger, A. Berenguer-Murcia, E. M. Sulman and J. C. Schouten, Org.
Process Res. Dev., 2009, 13, 991–998.
46 S. K. Johnston, N. Cherkasov, E. Pérez-Barrado, A. Aho, D. Y. Murzin, A. O. Ibhadon and M. G. Francesconi, Appl. Catal. A Gen., 2017, 544, 40–45.
47 N. Cherkasov, A. O. Ibhadon and E. V. Rebrov, Lab Chip, 2015, 15, 1952–1960.
48 N. Cherkasov, A. O. Ibhadon, A. McCue, J. A. Anderson and S. K. Johnston, Appl. Catal. A Gen., 2015, 497, 22–30.
49 Z. Wu, N. Cherkasov, G. Cravotto, E. Borretto, A. O. Ibhadon, J. Medlock and W. Bonrath,
ChemCatChem, 2015, 7, 952–959.
50 N. Cherkasov, M. Al-Rawashdeh, A. O. Ibhadon and E. V Rebrov, Catal. Today, 2016, 273, 205–212.
3313–3322.
52 A. Günther, S. A. Khan, M. Thalmann, F. Trachel and K. F. Jensen, Lab Chip, 2004, 4, 278– 286.
53 A.-K. Liedtke, F. Bornette, R. Philippe and C. de Bellefon, Chem. Eng. J., 2013, 227, 174– 181.
54 C. X. Zhao and A. P. J. Middelberg, Chem. Eng. Sci., 2011, 66, 1394–1411.
55 A. Günther, M. Jhunjhunwala, M. Thalmann, M. A. Schmidt and K. F. Jensen, Langmuir, 2005, 1547–1555.
56 A. N. Tsoligkas, M. J. H. Simmons and J. Wood, Chem. Eng. Sci., 2007, 62, 4365–4378.
57 R. J. Ingham, C. Battilocchio, D. E. Fitzpatrick, E. Sliwinski, J. M. Hawkins and S. V. Ley,
Angew. Chemie - Int. Ed., 2015, 54, 144–148.
58 Y. Liu, P. Gao, N. Cherkasov and E. V. E. V. Rebrov, RSC Adv., 2016, 6, 100997–101007.
59 C. Moreno-Marrodan, F. Liguori and P. Barbaro, Beilstein J. Org. Chem., 2017, 13, 734–754.
60 P. T. Witte, P. H. Berben, S. Boland, E. H. Boymans, D. Vogt, J. W. Geus and J. G. Donkervoort, Top. Catal., 2012, 55, 505–511.
61 L. A. Saudan, Acc. Chem. Res., 2007, 40, 1309–1319.
62 F. Liguori and P. Barbaro, J. Catal., 2014, 311, 212–220.
63 J. Wood, L. Bodenes, J. a Bennett, K. Deplanche and L. E. Macaskie, Ind. Eng. Chem. Res., 2010, 49, 980–988.
64 C. Berguerand, I. Yuranov, F. Cárdenas-Lizana, T. Yuranova and L. Kiwi-Minsker, J. Phys.
Chem. C, 2014, 118, 12250–12259.