Permanent WRAP URL:
http://wrap.warwick.ac.uk/103911/
Copyright and reuse:
This thesis is made available online and is protected by original copyright. Please scroll down to view the document itself.
Please refer to the repository record for this item for information to help you to cite it. Our policy information is available from the repository home page.
An Intrusion Detection Scheme for Identifying Known and
Unknown Web Attacks (I-WEB)
By
Muhammad Hilmi Kamarudin
A dissertation submitted in fulfilment of the requirements for the degree of Doctor of Philosophy
At WMG
Abstract
The number of utilised features could increase the system's computational effort when processing large network traffic. In reality, it is pointless to use all features considering that redundant or irrelevant features would deteriorate the detection performance. Meanwhile, statistical approaches are extensively practised in the Anomaly Based Detection System (ABDS) environment. These statistical techniques do not require any prior knowledge on attack traffic; this advantage has therefore attracted many researchers to employ this method. Nevertheless, the performance is still unsatisfactory since it produces high false detection rates. In recent years, the demand for data mining (DM) techniques in the field of anomaly detection has significantly increased. Even though this approach could distinguish normal and attack behaviour effectively, the performance (true positive, true negative, false positive and false negative) is still not achieving the expected improvement rate. Moreover, the need to re-initiate the whole learning procedure, despite the attack traffic having previously been detected, seems to contribute to the poor system performance.
This study aims to improve the detection of normal and abnormal traffic by determining the prominent features and recognising the outlier data points more precisely. To achieve this objective, the study proposes a novel Intrusion Detection Scheme for Identifying Known and Unknown Web Attacks (I-WEB) which combines various strategies and methods. The proposed I-WEB is divided into three phases namely pre-processing, anomaly detection and post-processing. In the pre-processing phase, the strengths of both filter and wrapper procedures are combined to select the optimal set of features. In the filter, Correlation-based Feature Selection (CFS) is proposed, whereas the Random Forest (RF) classifier is chosen to evaluate feature subsets in wrapper procedures. In the anomaly detection phase, the statistical analysis is used to formulate a normal profile as well as calculate the traffic normality score for every traffic. The threshold measurement is defined using Euclidean Distance (ED) alongside the Chebyshev Inequality Theorem (CIT) with the aim of improving the attack recognition rate by eliminating the set of outlier data points accurately. To improve the attack identification and reduce the misclassification rates that are first detected by statistical analysis, ensemble-learning particularly using a boosting classifier is proposed. This method uses using LogitBoost as the meta-classifier and RF as the base-classifier. Furthermore, verified attack traffic detected by ensemble learning is then extracted and computed as signatures before storing it in the signature library for future identification. This helps to reduce the detection time since similar traffic behaviour will not have to be re-executed in future.
Table of Contents
Abstract ... i
Table of Contents ... ii
List of Tables ... vii
List of Figures ... viii
Abbreviations ... xii
Declarations ... xvi
Acknowledgement ... xvii
List of Publications ... xviii
Chapter 1
Introduction ... 11.1 Background ... 1
1.2 Motivation ... 2
1.3 Problem Statement ... 5
1.4 Research Question ... 6
1.5 Thesis Outline ... 7
Chapter 2
Literature Review ... 82.1 Introduction ... 8
2.2 Web Attacks ... 8
2.3 Intrusion Detection System ... 11
2.3.1 Types of IDS ... 12
2.3.2 IDS Detection Methods ... 12
2.3.2.1 Misuse Based Detection System (MBDS) ... 12
2.3.2.2 Anomaly Based Detection System (ABDS) ... 13
2.3.3 IDS Datasets ... 15
2.4 Pre-processing Phase ... 16
2.4.1 Feature Selection ... 16
2.4.1.1 Filter and Wrapper Methods ... 17
2.5 Anomaly Detection Approaches ... 22
2.5.1 Statistics based Anomaly Detection (SBAD) ... 22
2.5.2 Data Mining Based Anomaly Detection (DMBAD) ... 26
2.5.2.1 Classification Techniques ... 27
2.5.2.2 Ensemble-based Classifiers ... 34
2.5.3 Summary ... 40
2.6 Post-Processing Phase ... 41
2.6.1 Incident Prioritisation ... 41
2.6.2 Summary ... 42
2.7 Summary ... 43
Chapter 3
Methodology ... 463.1 Introduction ... 46
3.2 Research Design ... 46
3.2.1 Pre-Processing Phase ... 46
3.2.2 Anomaly Detection Phase ... 47
3.2.3 Post-Processing Phase ... 50
3.2.4 Data Source Selection ... 51
3.2.4.1 DARPA 1999 ... 52
3.2.4.2 NSL KDD ... 54
3.2.4.3 ISCX 2012 ... 54
3.2.4.4 UNSW-NB 15 ... 56
3.3 Experimental Setup ... 58
3.3.1.1 MySQL ... 58
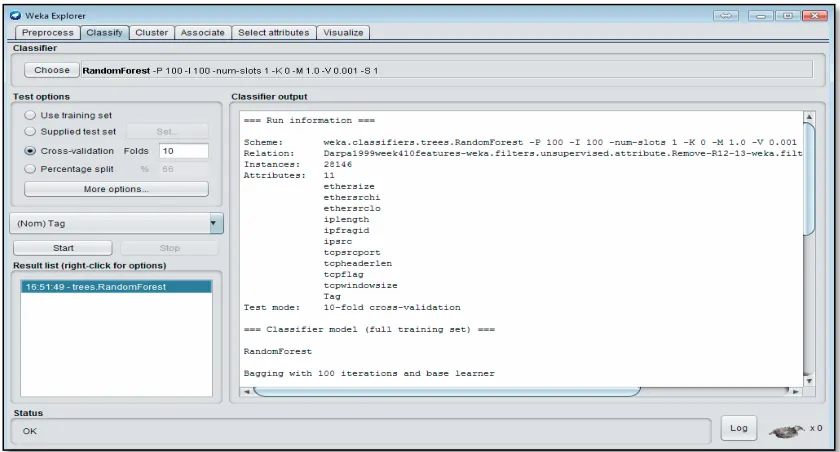
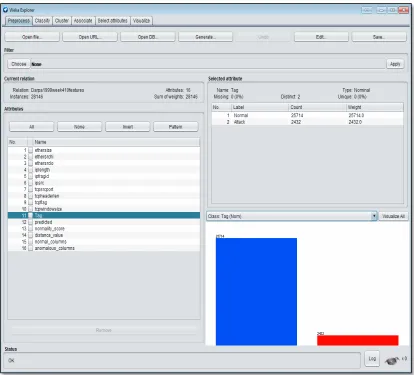
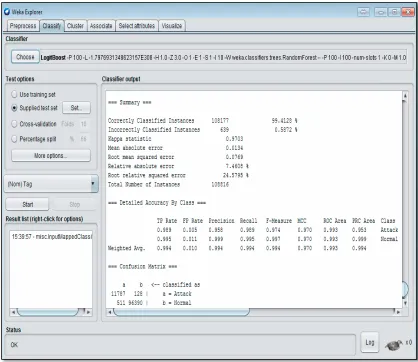
3.3.1.2 WEKA Data Mining Tools ... 58
3.3.2 Experimental Design ... 59
3.3.3 Evaluation Measurement ... 61
3.4 Summary ... 62
Chapter 4
An Intrusion Detection Scheme for Identifying Known and Unknown Web Attacks (I-WEB) ... 634.2 The Proposed I-WEB ... 63
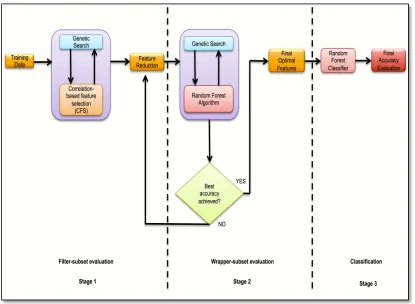
4.3 Pre-Processing Phase ... 64
4.3.1 Filter-subset Evaluation (Stage 1) ... 65
4.3.2 Wrapper-subset Evaluation (Stage 2) ... 65
4.3.3 Classification (Stage 3) ... 66
4.4 Anomaly Detection Phase ... 67
4.4.1 Statistical-based Anomaly Detection (First stage detection) ... 67
4.4.1.1 Normal profile ... 67
4.4.1.2 Influence of Feature Size ... 71
4.4.2 Ensemble Classification Algorithm (Second stage detection) ... 74
4.5 Post-Processing Phase ... 75
4.5.1 Attack Signature Formation ... 76
4.5.2 Attack Prioritisation ... 79
4.5.2.1 Decision Factors for IPM ... 79
4.5.2.2 Severity Formation ... 80
4.6 Summary ... 81
Chapter 5
The Implementation of I-WEB ... 825.1 Introduction ... 82
5.2 Pre-Processing Phase ... 84
5.3 Anomaly Detection Phase ... 87
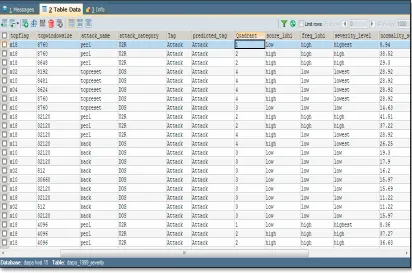
5.4 Post-Processing Phase ... 92
5.5 Summary ... 95
Chapter 6
Results and Discussion ... 966.1 Introduction ... 96
6.2 Preliminary Experiments ... 96
6.2.1 First Preliminary Experiment ... 96
6.2.2 Second Preliminary Experiment ... 100
6.3 Performance Evaluation of Proposed Detection Scheme ... 101
6.3.2 Anomaly Detection Phase ... 104
6.3.3 Post-Processing Phase ... 106
6.4 Attack Analysis and Comparison of Previous Work ... 108
6.4.1 DARPA 1999 Dataset ... 108
6.4.2 NSL KDD Dataset ... 110
6.4.3 ISCX 2012 Dataset ... 113
6.4.4 UNSW-NB15 Dataset ... 115
6.5 Summary ... 117
Chapter 7
Conclusion and Future Work ... 1187.1 Introduction ... 118
7.2 Main Findings and the Summary of the Thesis ... 118
7.2.1 Research Question One: ... 118
7.2.2 Research Question Two: ... 119
7.2.3 Research Question Three: ... 119
7.2.4 Research Question Four: ... 119
7.3 Contributions of the Study ... 120
7.4 Limitations of the Study ... 121
7.5 Future Work ... 122
References
... 123Appendix A
... 142A.1 First Preliminary Experiment ... 142
A.1.1.1 DARPA 1999 Dataset ... 142
A.1.1.2 NSL KDD Dataset ... 145
A.1.1.3 ISCX 2012 Dataset ... 147
A.1.1.4 UNSW-NB15 Dataset ... 150
A.2 Second Preliminary Experiment ... 153
A.2.1.1 DARPA 1999 Dataset ... 153
A.2.1.2 NSL KDD Dataset ... 155
A.2.1.4 UNSW-NB15 Dataset ... 159
Appendix B
... 162B.1 Performance Evaluation on DARPA 1999 ... 162
B.2 Performance Evaluation on NSL KDD ... 164
B.3 Performance Evaluation on ISCX 2012 ... 165
B.4 Performance Evaluation on UNSW-NB15 ... 167
List of Tables
Table 2.1: Comparison of Previous Work (Feature Selection)………...…………...20
Table 2.2: Comparison of Previous Work (Statistical Approaches)………...25
Table 2.3: Comparison of Previous Work (Ensemble Classifications) …...………...39
Table 3.1: Distribution of Web Traffic for DARPA 1999 Dataset………..…...53
Table 3.2: Distribution of Web Traffic for NSL KDD Dataset……..…….………...54
Table 3.3: Distribution of Web Traffic for ISCX 2012 Dataset..……..……….………56
Table 3.4: Distribution of Web Traffic for UNSW-NB 15 Dataset..……….…57
Table 4.1: Normal Profile of DARPA 1999………...68
Table 4.2: Example of Computation Score for Traffic (n) in DARPA 1999………...69
Table 6.1: Performance of proposed I-WEB using the DARPA 1999 testing dataset ……...108
Table 6.2: Performance comparisons using the DARPA 1999 dataset………109
Table 6.3: Performance of proposed I-WEB using the NSL KDD testing dataset…...110
Table 6.4: Performance comparisons obtained on KDD and NSL KDD dataset……...….…112
Table 6.5: Performance of proposed I-WEB using the ISCX 2012 testing dataset………...113
Table 6.6: Performance comparisons obtained from the ISCX 2012 dataset…………...114
Table 6.7: Performance of proposed I-WEB using the UNSW-NB15 testing dataset…...…...115
Table 6.8: Performance comparisons obtained on the UNSW-NB15 dataset…..……...116
Table 6.9: Performances of four different datasets………...117
List of Figures
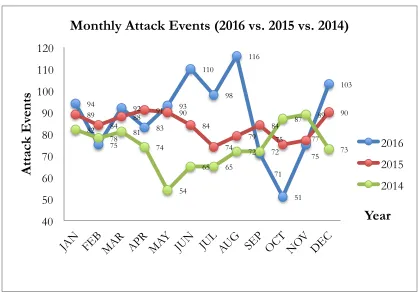
Figure 1.1: Monthly Attack Events Activity for Year 2014, 2015 and 2016 ... 3
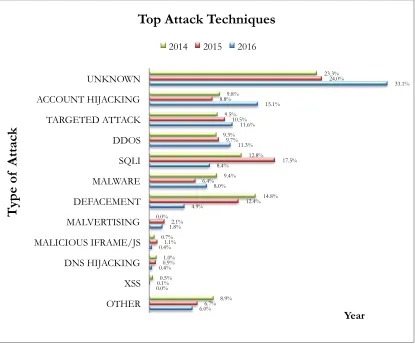
Figure 1.2: Top Attack Techniques in Year 2014, 2015 and 2016 ... 4
Figure 2.1: The components of the pre-processing phase ... 21
Figure 2.2: The components of the anomaly detection phase ... 40
Figure 2.3: The components of the post-processing phase ... 42
Figure 2.4: The conceptual framework ... 44
Figure 3.1: Block diagram of DARPA 1999 test bed (Lippmann et al., 2000) ... 52
Figure 3.2: ISCX 2012 Testbed Network Architecture (Shiravi et al., 2012) ... 55
Figure 3.3: UNSW-NB15 Testbed Network Architecture (Moustafa and Slay, 2016) ... 57
Figure 4.1: Hybrid Feature Selection (HFS) design (Kamarudin et al., 2017a) ... 64
Figure 4.2: An example of attributes matching on testing data (DARPA 1999) ... 70
Figure 4.3: Example of Anomalous traffic behaviour (DARPA 1999) ... 71
Figure 4.4: An example of attack signature stored in the signature library ... 76
Figure 4.5: An example of new incoming traffic 1 ... 77
Figure 4.6: An example of new incoming traffic 2 ... 77
Figure 4.7: Severity Quadrants ... 80
Figure 5.1: The Proposed Detection Model (I-WEB) ... 82
Figure 5.2: Process of selecting features using FBSE ... 85
Figure 5.3: Process of selecting features using WBSE ... 85
Figure 5.5: The week 4 data of DARPA 1999 dataset ... 91
Figure 5.6: The evaluation process of DARPA 1999 dataset ... 92
Figure 5.7: The intrusion prioritisation process of the DARPA 1999 Dataset ... 95
Figure 6.1: Comparison of Filter Approaches Performance over IDS Datasets ... 97
Figure 6.2: Comparison of Performance Accuracy between Filter and HFS ... 98
Figure 6.3: Comparison of Classification Algorithms Performance on HFS ... 99
Figure 6.4: Comparison of Classification Algorithms Performance on IDS Datasets ... 100
Figure 6.5: Feature Count and Time taken to Built Training Model over IDS Datasets ... 101
Figure 6.6: The Accuracy Rate Performance over IDS Datasets ... 104
Figure 6.7: The Necessity of Signature Implementation over IDS Datasets ... 106
Figure A.1: Building Time and Feature Selected by Search Algorithm with DARPA 1999 ... 142
Figure A.2: Comparison of Filter Approaches on DARPA 1999 Dataset ... 143
Figure A.3: Building Time of Feature Selection Methods on DARPA 1999 Dataset ... 143
Figure A.4 Comparison of Feature Selection Methods on DARPA 1999 Dataset ... 144
Figure A.5: Comparison of Classification Algorithms on DARPA 1999 Dataset ... 144
Figure A.6: Building Time and Feature Selected by Search Algorithm with NSL KDD Dataset ... 145
Figure A.7: Comparison of Filter Approaches on NSL KDD Dataset ... 145
Figure A.8: Building Time of Feature Selection Methods on NSL KDD Dataset ... 146
Figure A.9 Comparison of Feature Selection Methods on NSL KDD Dataset ... 146
Figure A.10: Comparison of Classification Algorithms on NSL KDD Dataset ... 147
Figure A.12: Comparison of Filter Approaches on ISCX 2012 Dataset ... 148
Figure A.13: Building Time of Feature Selection Methods on ISCX 2012 Dataset ... 148
Figure A.14: Comparison of Feature Selection Methods on ISCX 2012 Dataset ... 149
Figure A.15: Comparison of Classification Algorithms on ISCX 2012 Dataset ... 149
Figure A.16: Building Time and Feature Selected by Search Algorithm with UNSW-NB15 Dataset ... 150
Figure A.17: Comparison of Filter Approaches on UNSW-NB15 Dataset ... 150
Figure A.18: Building Time of Feature Selection Methods on UNSW-NB15 Dataset ... 151
Figure A.19: Comparison of Feature Selection Methods on UNSW-NB15 Dataset ... 151
Figure A.20: Comparison of Classification Algorithms on UNSW-NB15 Dataset ... 152
Figure A.21: Building Model and Detection Time Taken by Single Classifier Using DARPA 1999 Dataset ... 153
Figure A.22: Comparison Performances of Single Classifier Using DARPA 1999 Dataset ... 154
Figure A.23: Building Model and Detection Time Taken by Boosting Classifiers Using DARPA 1999 Dataset ... 154
Figure A.24: Comparison Performances of Boosting Classifiers Using DARPA 1999 Dataset 155 Figure A.25: Building Model and Detection Time Taken by Single Classifier Using NSL KDD Dataset ... 155
Figure A.26: Comparison Performances of Single Classifier Using NSL KDD Dataset ... 156
Figure A.27: Building Model and Detection Time Taken by Boosting Classifiers Using NSL KDD Dataset ... 156
Figure A.28: Comparison Performances of Boosting Classifiers Using NSL KDD Dataset .... 157
Figure A.29: Building Model and Detection Time Taken by Single Classifier Using ISCX 2012 Dataset ... 157
Figure A.31: Building Model and Detection Time Taken by Boosting Classifiers Using ISCX
2012 Dataset ... 158
Figure A.32: Comparison Performances of Boosting Classifiers Using ISCX 2012 Dataset .... 159
Figure A.33: Building Model and Detection Time Taken by Single Classifier Using UNSW-NB15 Dataset ... 159
Figure A.34: Comparison Performances of Single Classifier Using UNSW-NB15 Dataset ... 160
Figure A.35: Building Model and Detection Time Taken by Boosting Classifiers Using UNSW-NB15 Dataset ... 160
Figure A.36: Comparison Performances of Boosting Classifiers Using UNSW-NB15 Dataset161 Figure B.1: Performance of HFS Using DARPA 1999 Dataset ... 162
Figure B.2: Performance of Statistical Analysis Detection on DARPA 1999 Dataset ... 163
Figure B.3: Performance of proposed approaches on DARPA 1999 Dataset ... 163
Figure B.4: Performance of HFS Using NSL KDD Dataset ... 164
Figure B.5: Performance of Statistical Analysis Detection on NSL KDD Dataset ... 164
Figure B.6: Performance of Anomaly Detection Approaches on NSL KDD Dataset ... 165
Figure B.7: Performance of HFS Using ISCX 2012 ... 165
Figure B.8: Performance of Statistical Analysis Detection on ISCX Dataset ... 166
Figure B.9: Performance of Anomaly Detection Approaches on ISCX 2012 Dataset ... 166
Figure B.10: Performance of HFS Using UNSW-NB15 Dataset ... 167
Figure B.11: Performance of Statistical Analysis Detection on UNSW-NB15 Dataset ... 167
Abbreviations
ABDS Anomaly Based Detection System
AB-RF AdaBoost and Random Forest
ACC Accuracy
ACCS Australian Centre for Cyber Security
A-DR Attack Detection Rate
AFRL Air Force Research Laboratory
AIS Artificial Immune Systems
ANN Artificial Neural Network
ANFIS Adaptive Neural Fuzzy Inference System
AP Active Point
AS Active Score
BER Backward Elimination Ranking
BS British Standard
CAGE Cellular Genetic Programing
CART Classification and Regression Tree
CFS Correlation Feature Selection
CIA Confidentiality, Integrity and Availability
CIT Chebyshev Inequality Theorem
DBMS Database Management System
DoS Denial of Service
DDoS Distributed Denial of Service
DM Data Mining
DNS Domain Name Server
DS Dempster-Shafer
DT Decision Table
EAFB Eyrie Air Force Base
ESVDF Enhanced Support Vector Decision Function
FAR False Alarm Rate
FBFR Filter-based Feature Ranking
FBSE Filter-based Subset Evaluation
FBI Federal Bureau of Investigation
FL Fuzzy Logic
FP False Positive
FN False Negative
FSR Forward Selection Ranking
GA Genetic Algorithm
GP Genetic Programming
HFS Hybrid Feature Selection
HIDS Host-based Intrusion Detection System
HMM Hidden Markov Model
HMP Hybrid Multilayer Perceptron
HTTP Hypertext Transfer Protocol
HTTPS Hypertext Transfer Protocol Secure
ICMP Internet Control Message Protocol
IDS Intrusion Detection System
IGR Information Gain Ratio
IoT Internet of Things
IPM Intrusion Prioritisation Model
IPSec Internet Protocol Security
ISO International Organization for Standardization
ISMS Information Security Management System
I-WEB Intrusion Detection Scheme for Identifying Known and Unknown Web
Attacks
J48 Decision Tree
LGP Linear Genetic Programming
LNID Lightweight Network Intrusion Detection
LB-RF LogitBoost and Random Forest
MARS Multivariate Adaptive Regression Splines
MBDS Misuse Based Detection System
MBP Multilayer Backpropagation Perceptron
MLP Multilayer Perceptron
NAT Network Address Translation
NB Naïve Bayes
N-DR Normal Detection Rate
NN Neural Network
NHS National Health Service
NIDS Network-based Intrusion Detection System
NSA National Security Agency
NSL KDD Network Security Laboratory Knowledge Discovery and Data Mining
OWASP Open Web Application Security Project
PART Partial Decision Tree
PbPHAD Protocol-based Packet Header Anomaly Detection
PHAD Packet Header Anomaly Detection
PP Passive Point
PS Passive Score
PSO Particle Swarm Optimization
RF Random Forests
R2L Remote to Local
RIDOR Ripple Down Rule
SAD Statistical Analysis Detection
SBAD Statistical Based Anomaly Detection
SMB Server Message Block
SQL Sequel Query Language
SSH Secure Shell
SVM Support Vector Machines
TCP Transmission Control Protocol
TELNET Terminal Network
TN True Negative
TP True Positive
UDP User Datagram Protocol
UNB University of Brunswick
US-CERT United State Computer Emergency Readiness Team
U2R User to Root
WBSE Wrapper-based Subset Evaluation
WEP Wired Equivalent Privacy
WEKA Waikato Environment for Knowledge Analysis
XSS Cross-Site Scripting
Declarations
I hereby declare that this dissertation entitled An Intrusion Detection Scheme In Identifying Known and Unknown Web Attacks (I-Web) is an original work and has not been submitted for a degree or diploma or other qualification at any other University
Acknowledgement
First and foremost, all praise and gratitude shall be bestowed to Allah the Almighty and The Merciful for all the insight given by Him which has led to the completion of this research.
I would like to express my sincerest gratitude and appreciation to my supervisors Prof. Carsten Maple, Prof. Tim Watson and Dr Nader Sohrabi Safa for their valuable guidance, support and motivation throughout my PhD journey. This thesis will not even be possible without their continues encouragement, enthusiasm and positive critics.
To my source of inspiration, my wife Hasliza Sofian, my son Muhammad Ashraf and for the one who is coming soon, I am truly thankful for their encouragements, patients, supports, and understanding throughout this endeavour. Not to forget, the deepest appreciation goes to my father Mr Kamarudin, my mother Mrs Siti Johariah, father-in-law Mr Sofian, and mother-in-father-in-law Mrs Sharifah Robiah for their blessing and endless support throughout this study.
I would also like to thank my friends, colleagues at the Cyber Security Centre, WMG, University of Warwick, and to all individuals who are involved either directly or indirectly in making this project successful.
List of Publications
Conference:
1. Kamarudin, M.H., Maple, C., Watson, T., and Sofian, H., (2016). Packet Header
Intrusion Detection with Binary Logistic Regression Approach in Detecting
R2L and U2R Attacks. Proceedings - 4th International Conference on Cyber Security, Cyber Warfare, and Digital Forensics, CyberSec 2015, pp.101–106.
Journal:
1. Kamarudin, M.H., Maple, C. and Watson, T., (2016). Hybrid feature selection
technique for intrusion detection system. Int. J. High Performance Computing and Networking.
2. Kamarudin, M.H., Maple, C., Watson, T., and Safa, N.S. (2017). A
LogitBoost-based Algorithm for Detecting Known and Unknown Web Attacks. IEEE Access, 5, 26190–26200. http://doi.org/10.1109/ACCESS.2017.2766844
3. Kamarudin, M.H., Maple, C., Watson, T., and Safa, N.S. (2017). A New Unified
Chapter
1
Introduction
1.1 Background
The continuous growth of the Internet technologies and massive data exchange have created a new paradigm named big data. One of the challenges is when a huge amount of sensitive information stored in the servers and transmitted over the Internet becomes a primary target. Web-based applications and web servers have been a popular target in recent years considering that most communications involving client-server queries. A comprehensive analysis carried out by Symantec (2017) revealed that 76% of
websites were scanned and found to have vulnerabilities, where 9% fall into the critical category.
devices and formed an army of bots that was used to perform large scale Distributed Denial of Services (DDOS) attacks from multiple different locations. The attacks caused outages and slowness for many of Dyn’s customers including Twitter, Paypal, CNN, and some businesses hosted by Amazon.com Inc.
A more recent massive cyber-attack took place on 12th May 2017 and had a major impact on a significant element of the UK’s National Health Service (NHS), other health industries and created chaos in hospitals across England (Jones, 2017). Thousands of computers at hospitals and GPs’ surgeries became victims of global ransomware attacks, derivatives of the WannaCry attack, which are believed to have exploited a vulnerability first discovered by the National Security Agency (NSA). In particular, the attack exploited a vulnerability in the Windows Server Message Block (SMB) protocol and installed backdoor tools to deliver and run a WannaCry ransomware package. Although the Internet is widely recognised as a convenient means for providing real-time information services to the public, the potential threats to confidentiality, integrity and availability (CIA) issues need to be addressed more effectively and permanently (Thakare and Gore, 2014).
1.2 Motivation
Figure 1.1: Monthly Attack Events Activity for Year 2014, 2015 and 2016
One of the biggest concerns of information security is to protect or defend the information infrastructure (Tirenin and Faatz, 1999). This further explains the need to identify the source of threats and then analyse them for future preventive action. The process complies with the International Organization for Standardization (ISO) 17799 and the identical British Standard (BS) 7799 that act as the codes of practice for information security management systems (ISMS) (Chan et al., 2005). Recent developments of the Internet have given rise to the enhanced capability of the Internet of Things (IoT) to ease people’s lives, particularly in solving issues related to communication, financial and time constraints.
94 75 92 83 93 110 98 116 71 51 75 103 89
84 88
91 90 84
74 79
84
75 77 90
82
78 81 74
54
65 65
72 72
87 89
73 40 50 60 70 80 90 100 110 120
A
tt
ac
k E
ve
nt
s
Year
Monthly Attack Events (2016 vs. 2015 vs. 2014)
Figure 1.2: Top Attack Techniques in Year 2014, 2015 and 2016
Figure 1.2 shows the top attack techniques represented in total percentage for each year from 2014 until 2016. It demonstrates that “unknown” attacks had recorded an increase of almost 10% in 2016 compared to 2014 (Passeri, 2017). The highest proportion of “unknown” attacks each year has emphasised the serious need for defence mechanisms. The unknown attack is generally known as a zero-day attack in the network security field (Levy, 2004). The persistent growth of vulnerability and threats has also emphasised the serious need for defence mechanisms. The main technology of network security focuses on access control, firewall and information encryption. However, it is also important to acknowledge the common issues related to bugs and deficiencies. For instance, a firewall alone is unable to detect intrusions occurring from within the network (Wankhade and Chatur, 2014). This further explains why the intrusion detection system (IDS) has become a popular option. In addition, IDS is recognised as one of the components in the security arsenal as “defense in depth” (Northcutt et al.,
6.0% 0.0% 0.4% 0.4% 1.8% 4.9% 8.0% 8.4% 11.3% 11.6% 15.1% 33.1% 6.7% 0.1% 0.9% 1.1% 2.1% 12.4% 6.4% 17.5% 9.7% 10.5% 8.8% 24.0% 8.9% 0.5% 1.0% 0.7% 0.0% 14.8% 9.4% 12.8% 9.3% 9.5% 9.8% 23.3% OTHER XSS DNS HIJACKING MALICIOUS IFRAME/JS MALVERTISING DEFACEMENT MALWARE SQLI DDOS TARGETED ATTACK ACCOUNT HIJACKING UNKNOWN Year
T
yp
e of
A
tt
ac
k
Top Attack Techniques
2008), that acts as a complement to the existing security appliances. Although the IDS does not guarantee the security aspect, it will be greatly enhanced if integrated with other security measures, such as vulnerability assessments, data encryption, user authentication, access control, and firewalls.
1.3 Problem Statement
1. The rapid growth of Internet communication has led to the creation of myriad data. Hence, longer processing time is needed due to the high dimensionality of data communication, which is believed to significantly affect the system performance by reducing the attack detection speed (Davis and Clark, 2011). The main factor that contributes to performance reduction is due to the system having to process redundant and irrelevant features; thus it is crucial to develop a method that could efficiently remove them.
2. Despite the fact that numerous statistical detections have been developed and studies made in the past, achieving exceptionally low false detection with high attack recognition capabilities still remains a major challenge (Acarali et al.,
2016). Most of the previous statistical detection managed to achieve an unsatisfactory attack detection rate (referred to as true positive). This action has led to the generation of a high false detection rate due to the traffic being more likely to be classified as anomalous.
3. In classifying data type, the chosen algorithm plays an important role because it is highly associated with the derived features. For example, the classification process is inefficient if the derived features are not able to contribute enough to help the algorithm in the decision-making process. This will lead the algorithm to misclassify normal data as attack data (false positive) and attack data as normal data (false negative). The inaccurate result has compromised the reliability of the system to flag a true attack.
4. In a conventional detection approach, researchers often disregard the time need for the re-execution process for every piece of traffic, which further delays the determination of the traffic pattern. In some cases, the re-initiation of the whole procedure can be a mess when processing huge amounts of traffics. As such, the detection system should be fast enough to alert the administrator to prevent information loss. In addition, due to the number of incidents rising significantly, the incidents should be sorted according to their severity level. For instance, a critical incident would requires a quick response from a security analyst compared to less critical incidents (Anuar et al., 2013). Furthermore, such an approach could provide better insight for security analyst regarding incident responses.
1.4 Research Question
In this thesis, this research attempts to address the overarching question: “How could system detection performance be improved in order to identify known and unknown web attacks? Four sub-questions then follow hereafter:
1. What approach can be used to select prominent features within the dataset?
2. How can the false detection rate produced using conventional statistical techniques be reduced?
3. What is the suitable combination of classifiers in boosting algorithms that could improve the attack detection performance?
4. How can the detection ability be improved in order to identify similar attacks in the future?
1.5 Thesis Outline
This section presents the structure of the thesis as follows:
Chapter 2 contains related studies on the subject matter including intrusion detection system (IDSs), feature selection, statistical, and data mining-based anomaly detection.
Chapter 3 describes the research methodology adopted in this study. The chapter gives an overview on how the proposed scheme is designed and implemented. It also covers the experimental setup. The selection of the required methods for the research and the criteria used to evaluate the performance are also highlighted.
Chapter 4 describes the proposed scheme that is based on three major phases: processing, anomaly detection and post-processing. The overview of steps taken in pre-processing, anomaly detection as well as post-processing is also discussed in this chapter.
Chapter 5 presents the implementation of three major phases in the proposed detection scheme using WEKA data mining tools, SQL script and MySQL database. The procedure for each step of implementation is explained in this chapter.
Chapter 6 discusses the performance evaluation and analysis of the proposed scheme. The effectiveness of Pre-Processing, Anomaly Detection and Post-Processing is assessed using four widely used IDS datasets with various performance metrics.
Chapter 2
Literature Review
2.1 Introduction
This chapter aims to review most of the published works that are relevant to the field of IDS as well as its implication. Section 2.2 begins with a discussion of attacks on web traffic. Section 2.3 highlights an overview of IDS. Section 2.4 presents the pre-processing phase, particularly using a feature selection procedure. Section 2.5 discusses the anomaly detection employed as statistical and data mining (DM) approaches in classifying attack traffic. Section 2.6 emphasises the post-processing phase and the existing techniques. Finally, Section 2.7 summaries the overall findings.
2.2 Web Attacks
immediate action by freezing all online transactions in order to prevent more customers from being the victim of further unlawful activity. It was reported that the said attack had cost Tesco a hefty £25 million. The attack also resulted in the biggest drop in the value of Tesco stock on record. Hence, it becomes imperative to secure the related information assets with robust and reliable security systems.
SQL-injection is a commonly used attack employed to exploit a vulnerability known as command injection. Typically, SQL-injection is a technique that is employed to inject fictitious data into an SQL statement or query for malicious purposes through web page input. The SQL-injection attack makes it possible to alter, delete, or insert information from the affected web service and compromise its security system (Jang and Choi, 2014). Critical information such as full name, date of birth, previous or current home address can be collected from the server as part of identity fraud (Abdallah et al., 2016). Another popular target for hackers is the banking sector. It is understood that the credit card information stored in the banking server’s database is the most valuable information. Hence, the breach of credit card information will definitely cause major disruption, and most importantly, the compensation for the loss resulting from this action is unimaginable. There are known solutions to alleviate the impact of these attacks, which include encrypting the database system, limiting user privileges, and implementing data validation.
The exposure of the vulnerable web applications and sensitive information on the Internet has further emphasised the need to investigate the network security element. This has resulted in an increasing number of aggressive attacks incidents that caused serious damage to the targeted web-based information system. According to the top 10 applications of security risk by Open Web Application Security Project OWASP (2017), the injection flaws attacks became the most critical security risk to web applications, which subsequently led to more studies being conducted in this field. The research by Laranjeiro et al. (2010) proposed a learning-based approach to secure web servers through the detection of SQL and Xpath injection attack. The detection is based on input query where the attacker usually adds extra conditions to the original SQL commands. The proposed methods required examination of the structure as well as the type of inputs and outputs of the operation that exist in the XSD file. After the necessary information is collected, the workload generator is used to inspect the set of data that access the SQL/Xpath presented in the source code. In detection mode, the SQL query is compared with the normal SQL query that does not store any attacks in the lookup map. The execution will stop processing the query to avoid probable hazardous requests if the SQL query is not found. This approach is capable of alerting developers and service administrators to stop the XPath/SQL injection before the system is harmed.
The research conducted by Zolotukhin et al. (2014) was focused on payload, where HTTP log requests were extracted. The normal HTTP log requests have been used as a training set that describes the model of normal users’ behaviour. This approach is similar to work performed by Kim and Lee (2014) in which they made use of the query to detect SQL attacks. Initially, the query trees are converted to dimensional vectors for feature extraction and feature transformation. The work has been carried out using a DM technique by utilising the SVM algorithm for classification purposes. The result has demonstrated conspicuous performance improvement concerning computational time reduction and attacks detection accuracy rate.
Traditionally, IDS works with the principle of "deep packet inspection" whereby the packet contents are inspected in order to detect any malicious activities. The increased usage of network communication has led to more demands for secure communication using a cryptography approach. In an encrypted traffic environment, SSL, VPN or IPsec protocols are utilised to offer better privacy and confidentiality. Most established works in detecting web attacks are mainly focused on investigating the log/payload content. As the traffic is encrypted, the payload (log) is unavailable as the content is indecipherable.
2.3 Intrusion Detection System
An IDS is an application system or device that functions to identify either hostile activities or policy violation activities within a network. Anderson (1980) in a technical report described how audit trails containing patterns of legitimate information (user behaviour) could be utilised to distinguish and identify abnormal behaviour. The main interest in securing a network infrastructure is to design a network that is able to protect the confidentiality and integrity of data information while also ensuring the resource’s availability. According to Thai and De Oliveira (2013), a defective network design with limited misconfiguration of the software can lead to a more serious vulnerability issue, which makes it easier for an attacker to attack an organisation.
2.3.1 Types of IDS
With regard to IDS deployment, the scope can be classified as host-based IDS (HIDS) and network-based IDS (NIDS) (Muda et al., 2011a). The scope is based on the location of IDS which is deployed to inspect suspicious traffic. More specifically, NIDS captures the whole network segment and analyses it to detect for signs of hostile traffic. Meanwhile, HIDS focuses on a specific host and analyses information such as system calls, logs, and packets. In that manner, HIDS is regarded to be the better option in helping to identify internal attacks compared to NIDS (Iii, 2007).
2.3.2 IDS Detection Methods
The IDS detection methods are divided into two types: misuse-based detection system (MBDS), referred to as signature-based detection and anomaly-based detection system (ABDS) known as behaviour-based detection (Chen et al., 2010).
2.3.2.1 Misuse Based Detection System (MBDS)
higher detection rates. Despite its limitation in maintenance and detecting an unseen attack, MBDS has been recognised as an efficient system for identifying the considerable number of attacks, and being easy to use and suitable for huge environmental diversity.
2.3.2.2 Anomaly Based Detection System (ABDS)
An anomaly is a state of action or behaviour that deviates from the legitimate state (Wang, 2004). The anomalies are initiated through the variation of unusual activities that are vital for data inspection, such as cyber-attacks, e-banking fraud, and social engineering. It is important to define the state of abnormality in determining anomaly. According to Ahmed et al. (2016), the category of anomaly can be classified into the following three types:
1) Collective anomaly: In this case, a collection of a similar event that is different from the entire dataset is classified as a collective anomaly. Sync flood is one of the Denial of Service (DoS) attack types that occur when there is a superfluous request made in an attempt to flood the targeted server. Hence, it would not be considered as an anomalous event if a single request were detected to be unresponsive. Meanwhile, an abnormal phenomenon is bound to occur when the collective of the unresponsive pattern is received from clients, which will cause the targeted server to be unresponsive to any other requests.
3) Point anomaly: A point anomaly occurs when a particular single data instance from the dataset is different from the normal scheme. For instance, normal users will access their account daily on average, and there is the possibility that they might insert an incorrect password probably one or two times. However, point anomaly involves attempts to access the account, which may be more than average, considering that the attacker launches a brute force attack to gain unauthorised access to the account.
In ABDS, the point anomaly detection scheme has been widely applied. It is crucial to note that the statistical measurement (Chen et al., 2010), distance-based measurement (Bayarjargal and Cho, 2014) and clustering (Louvieris et al., 2013) are the main factors that help to identify or estimate the point anomaly (outliers). Chen et al. (2010), in their research constructed a normal profile by clustering the traffic attributes from the packet headers, in which any attribute’s value that deviates from this profile is considered as an outlier. Concerning this, Bayarjargal and Cho (2014) employed Mahalanobis distance on selected packet attributes to compute the distance between normal and abnormal traffics. Meanwhile, Louvieris et al. (2013) performed outlier detection using the nearest neighbour algorithm by calculating the distance between connection vectors. Unlike MBDS, this detection-based method does not require specific knowledge about an attack to be known beforehand. According to Guo et al. (2016), anomaly-based detection usually elevates more false alarm, compared to the misuse-based detection. False alarm occurs when ABDS inaccurately defines the normal traffic as abnormal traffic. The main focus of ABDS is to design high detection and prediction with smaller amounts of false alarms to avoid IDS performance reduction.
the system to flag abnormal data instances as normal instances. Therefore, the aforesaid situation has generated another two types of classes known as: (1) legitimate action caused by normal behaviour, and (2) legitimate action caused by intrusion behaviour. The four major classes used in measuring the IDS performance and effectiveness are (1) True Positive, (2) False Positive, (3) True Negative, and (4) False Negative. In most established works, various techniques have been performed in anomaly detection such as statistical and DM approaches.
2.3.3 IDS Datasets
There are many synthetic datasets available in the field of IDS. This includes DARPA 1999 (Lippmann et al., 2000), KDD 99 (1999), NSL KDD (Tavallaee et al., 2009), CAIDA (2011), DEFCON (2000), The Internet Traffic Archive (2008), LBNL (2005), ISCX 2012 (Shiravi et al., 2012) and UNSW-NB15 (Moustafa and Slay, 2016). Most of these datasets are unlabelled, and it requires comprehensive search activity to tag attack traffics.
The DARPA 1999 was constructed to simulate the traffic of a medium sized US Air Force Base. Despite heavy criticism by McHugh (2000) and Brown et al. (2009) on their limited ability and accuracy in demonstrating real-live traffic, the dataset remain to be extensively adopted in the field of IDS. A similar simulation environment was employed to generate a KDD 99 dataset where the difference is that the dataset was captured under the DARPA 1998 project. The NSL KDD dataset was recognised as an improved version of the KDD 99 dataset in the way that it has removed huge numbers of redundant and duplicated records in both training and testing sets.
In the CAIDA dataset, most of the attacks were generated according to very specific and particular events that make it suitable for researchers to develop a solution for detecting certain attacks. However, some of the backbone traces are anonymized by payload, with some other information such as protocol information and destination being completely unavailable.
and does not represent a real network environment. This is due to the dataset containing a substantial amount of attack traffic, compared to benign traffic, which has made this dataset suitable for alert correlation methods.
Other datasets such as The Internet Traffic Archive and LBNL, have suffered from heavy anonymization which resulted in a lack of packet information, such as individual IP address. On top of that, the datasets were developed in the ‘90s, which create further questions regarding their relevancy to represent the modern traffic environment.
The recently published datasets ISCX 2012 and UNSW-NB 15 were claimed to be more realistic due to their containing of recent sophisticated attacks. It is appropriate to adopt these datasets for a better projection of presenting the modern network traffic environment.
2.4 Pre-processing Phase
In IDS, the pre-processing phase is required with aim of easing data analysis and improving the processing time. Feature selection is widely employed to reduce high dimensionality data while removing insignificant information. This procedure is vital in order to improve the detection speed when processing the huge amount of traffic (Ji et al., 2016).
2.4.1 Feature Selection
accuracy, and improve the processing time to be significantly faster and efficient.
The two general methods for feature selection are the filters and wrappers approaches (El-Khatib, 2010). The filters approach is divided into two categories: filter-based feature ranking (FBFR) and filter-based subset evaluation (FBSE). FBFR ranks the relevant features by assigning weights to features individually. The assigning is based on the score of every single feature to the target classes without paying attention to the
interaction between features. Feature ranking is faster than FBSE that processes 2n (n=number of features) because it only computes the features once. However, it is impossible to get rid of redundant features due to the fact that filter ranking processes each feature independently (Khammassi and Krichen, 2017). Hence, FBSE was introduced to overcome these problems (redundant feature). It examines the whole subset (not just selecting the relevant features) and explores the degree of relationship between features. Overall, FBSE is more desirable in selecting feature in IDS compared to FBFR (Nguyen et al., 2010).
2.4.1.1 Filter and Wrapper Methods
features. On top of that, researchers have often used the filter as an alternative to the wrapper, since the latter is more expensive and time-consuming.
The feature selection process has attracted the interest of many researchers due to its potential in reducing high dimensional data. According to Mukkamala et al. (2004), the feature ranking algorithm was introduced merely to select the top six features based on rank. They adopt three ranking algorithms, namely support vector machines (SVM), multivariate adaptive regression splines (MARS), and linear genetic programming (LGP). The algorithm will select the best feature and then compare the performance of each algorithm. The detection will be programmed to detect Probe and DoS attacks. The LGP can achieve a higher accuracy rate in detecting both types of attacks compared to other algorithms. However, this approach is only effective to specific types of attacks. The speedy computation ability of the filter ranking has made it suitable to be applied for huge datasets. For instance, Wald et al. (2013) used filter ranking to reduce 480 features to a total of 40. They compared three different approaches of feature selection which are filter-rank, FBSE, and WBSE in order to find the best method to select the relevant features. Three different feature selections with six different classifiers, five-nearest neighbours (5-NN), logistic regression (LR), multi-layer perceptron (MLP), Naive Bayes (NB), RF with 100 trees (RF100), and SVM were utilised to achieve the best results. As recommended by these authors, the filter ranking process executed in high dimension data tends to perform better with SVM classifier techniques. Although, they claimed that the filter ranking method is more competent compared to the FBSE and the WBSE. However, there was no explanation of the methods implemented in choosing the top 40 features from the ranking table, which might affect the final optimal set of features, considering the irrelevant features.
El-Khatib (2010) proposed the information gain ratio (IGR) to replace the traditional information gain (IG) calculation method, considering that IG is normally biased towards features that contain high distinct value. The selected features are ranked based on score derived from the IGR calculation. The K-means classifier is then used to determine the best-fit feature-set based on the performance results accuracy. The selection process will end when the current subset performance drops below the previous subset accuracy. Next, the selected features are tested with three types of artificial neural network (ANN) architecture listed as follows: (1) perceptron, (2) multilayer backpropagation perceptron (MBP), and (3) hybrid multilayer perceptron (HMP). HMP was found to have a lower false positive rate and required the longest time in the learning model; however, its classifier has outperformed both the perceptron and the MBP. Nevertheless, there were no significant detection rate differences between the proposed HMP and MBP.
The classifier was shown to be less accurate when used solely to evaluate performance accuracy compared to the ensemble technique (combining more than one classifier) (Mukkamala et al., 2005). Another research by Zainal et al. (2008), proposed adaptive neural fuzzy inference system (ANFIS) and LGP algorithms in detecting four main types of attacks, namely Probe, DoS, R2L, and U2R. This ensemble technique was implemented with a reduced set of features (between six to eight) for each type of attack. This technique has managed to achieve more than 99% detection rate for R2L and U2R attack types, including an average of 99.15% accuracy for all attack types.
capabilities is still a major challenge despite the introduction of numerous feature selection approaches.
Table 2.1: Comparison of Previous Work (Feature Selection)
Authors Features Techniques Pros Cons Dataset
Mukkamala
et al. (2004) 41
Ranking using SVM, MARS and LGP
Useful in detecting Probe and DoS attack types
Not suitable for detecting R2L and U2R attack types
KDD 99
Zainal et al.
(2008) 41
Linear Genetic Programming ensemble with Adaptive Neural Fuzzy Inference System
Effective in detecting DoS and R2L using ensemble approaches
Not effective for detecting Probe and
U2R attack types KDD 99 Zaman and Karray, (2009) 41 Enhanced Support Vector Machines
Time effective in
building model Reduced output was lower features when compared with using full features
KDD 99
Ravale et al.
(2015) 41
Hybrid
Selection using K Means & RBF Support Vector
Machines
Reduced features
achieved better detection rate compared with using all features, with improvement around 9%
Single classifier using
SVM has
outperformed the proposed hybrid approaches
KDD 99
Kakavand
et al. (2016) 256
Dimensionality Reduction using Text Mining Model
The features had reduced from 256 to 25 features. The model had achieved 97% detection rate with 1.2% false alarm rate
The experiment was conducted on payload traffic which required additional computational effort. In addition, only 25% of testing data used when compare to training data
ISCX 2012
Aljawarneh
et al. (2017) 41
Hybrid
selection using Information Gain
Reduced
features from 41 to 8 features with 99.81% accuracy rate
The classification model is built by combining seven classifiers which are expensive to execute
2.4.2 Summary
Figure 2.1: The components of the pre-processing phase
The previous work had highlighted the function of selecting prominent features is to minimise the data dimensionality in order to achieve a better discrimination boundary in classifying attack behaviour.
2.5 Anomaly Detection Approaches
There are two detection methods that are regularly employed in the anomaly detection field: statistical and DM approaches. The advantages and limitations of both approaches are further discussed in the next sub-sections.
2.5.1 Statistics based Anomaly Detection (SBAD)
The statistical method in IDS was first introduced by Denning (1987). The detection approach primarily relies on a collection of data history to create normal profile behaviour. In this approach, only benign traffic data collected over a period of time is utilised to detect intrusion (Denning, 1987). The collected benign traffic is utilised to generate a profile behaviour, in which any incoming traffic that deviates from the profile will be recognised as suspicious traffic. As a result, the intruder behaviour form can be detected as a possible attacker through this detection approach (Patcha and Park, 2007). The main advantage of this approach is its ability to employ statistical procedures that could extract the traffic features in representing the behaviour pattern of the data, which can either be normal or attack traffics. A considerable amount of established works have employed statistical measures, e.g. Mahoney and Chan (2001), Shamsuddin and Woodward (2007), Chen et al. (2010), and Xiong et al. (2013).
The information in the attributes was used to measure the probability of each packet, either towards benign or abnormal behaviour. An anomaly score will be given when any dissimilarity is detected from the match against normal data. Finally, the sum anomaly score of each packet is summed up and flagged as anomalous if the score surpasses the pre-set threshold.
In contrast to conventional PHAD systems, Shamsuddin and Woodward (2007), proposed Protocol-based Packet Header Anomaly Detection (PbPHAD) in two different environments, namely network-based and host-based. The proposed method adopts three main protocols which are TCP, UDP, and ICMP to construct a normal profile that contains normal behaviour. Similarly to the traditional PHAD system, this approach uses all 33 packet header attributes to produce an anomaly score. The score will individually rate the degree of incoming traffic. There is still room for further improvement, despite the fact that PbPHAD exceeds the results from the PHAD and DARPA best System (Lippmann et al., 2000), with 57.83% detection rate.
To identify malicious packets present in within TELNET traffic, Chen et al. (2010) proposed the Lightweight Network Intrusion Detection (LNID) System. In LNID, benign behaviour extracted from training data is used to construct a normal profile. Additionally, the normal profile is used as the indicator to compute the anomaly score that was given during the matching process between testing and training data. The packets are flagged as malicious when the score surpasses the pre-set threshold. Insignificant features from training data are removed during the pre-processing phase to reduce the computational cost.
In addition, it is difficult for the detection approach to identify an attack that possesses similar behaviour to normal traffic. This is due to the anomaly approach being solely dependent on a normal profile as a baseline in determining the traffic status (normal or attack). It is important to note that the traffic could be anomalous if several outliers are present in the traffic, particularly taking into account that the predefined threshold is determined without performing further analysis. Besides, the detection methods only emphasise R2L and U2R without giving any concern to other risky attack types such as Probe and DoS. On top of that, the approach requires payload extraction that is limited to unencrypted traffic environment.
Profile generation has led Xiong et al. (2013) to propose catastrophe and equilibrium surface theory to extract common behaviour present within the network. The standard equilibrium surface is used to indicate the change of packet behaviour, which makes it suitable for inspecting incoming traffics. The real challenge is to obtain the best detection rate together with the lowest false alarm rate, despite the fact that the evaluation of true positive slightly increased over 86% for TELNET traffic.
Table 2.2: Comparison of Previous Work (Statistical Approaches)
Authors Techniques Pros Cons Dataset
Mahoney and Chan (2001)
Statistic based, Anomaly score, predefine threshold
Recognise 70 attacks out of 180 with 39% detection rate and 10% false alarm rate
The proposed method could
not achieve
higher
detection rate
DARPA 1999
Shamsuddin and Woodward (2007)
Statistic based, stationary model,
Anomaly score method,
predefine threshold
Detection Rate 57.80%
(Identified 48
out of 83
attack instances)
The detection rate recorded
by proposed
method has
room for
further improvement
DARPA 1999
Chen et al.
(2010)
Statistic based, stationary model, Feature Extraction, Anomaly score method,
predefine threshold
Achieved
72.70% of
detection rate
with 1.36%
false alarm rate
Only focusing on detecting R2L and U2R attacks inside Telnet traffic
DARPA 1999
Xiong et al.
(2013)
Statistic based, Catastrophe Theory,
distance based, predefined threshold
Detection rate
average at
86.3% with
3.2% false
alarm rate
The predefined threshold has generated high false alarm rate
DARPA 1999
2.5.2 Data Mining Based Anomaly Detection (DMBAD)
DM is a technique for discovering a systematic data relationship as well as determining the fundamental data information (Louvieris et al., 2013). DM can be divided into two broad categories, which are unsupervised and supervised approaches. Furthermore, clustering and classification are the respective examples of unsupervised and supervised algorithms. In clustering, the group of objects is categorised based on the characteristic data points. In this case, every single data point in a cluster is similar to those within its cluster but different from those in different clusters (Hair et al., 2009). The purpose of grouping similar data into one or more clusters is simply to ease the abnormality identification. However, this approach will potentially increase the false alarm rate (Hubballi et al., 2013). In view of the fact that the IDS performance is highly dependent on low false alarms, its capabilities can be downgraded if high false alarms continuously occur. Hence, classification is considered the better approach for classifying data (e.g. benign or anomalous), especially in reducing the false alarm rate.
Meanwhile, in supervised learning, the knowledge structure is created to recognise and classify newly found instances into predetermined classes. The collections of samples provided are inserted into machine learning to further classify them into classes. On another note, a classification model is developed as an output of the learning process based on the instances information provided in the learning stages. In short, the focus of supervised learning is to model the input/output relationships with the objective of recognising a mapping from input attributes to an output class. The output, such as the regularities among attributes of the same class or differences between them, can be demonstrated as a decision tree, a flowchart, and classification rules, which are to classify a novel unseen instance.
be produced: True Positive, True Negative, False Positive, and False Negative.
2.5.2.1 Classification Techniques
Classification is a supervised approach that is able to differentiate unusual data patterns, thus making it the most suitable option to identify unseen attack patterns (Farid et al.,
2014). A classifier will gather the knowledge by training the pre-classified sample representing the classes. Furthermore, it can act as a predictor for some unknown samples, or a descriptor for classified samples. On top of that, classification has been widely used considering its strong ability to identify attack and normal structure accurately, which helps to reduce false detection (Muda et al., 2011a). Most of the established works employed the following as a single classifier in the field of intrusion detection: artificial immune systems (AIS), fuzzy logic (FL), one rule (OneR), hidden markov model (HMM), genetic algorithm (GA), neural network (NN), naïve bayes (NB), decision table (DT), decision tree (J48), random forest (RF), support vector machine (SVM) and multilayer perceptron (MLP).
AIS was inspired by natural immunity models. The implementation algorithm that was inspired by the immune system has been widely applied to various real world applications. In view of ABDS, the AIS performs the detection by generating the pattern of abnormality given from a given set of normal data (Wu and Banzhaf, 2010). The abnormal pattern is used as a benchmark for detecting the anomaly data. In the learning process, the efficiency of the algorithm is highly dependent on the traffic contents (Hosseinpour et al., 2014). Hence, the dataset that contains continuous attribute values will ease the process of generating the abnormal pattern.
OneR classifier is known as a rule-based algorithm that generates rules with the basic purpose of selecting the features and appropriately ranking them. The algorithm establishes rules for every value in the feature by testing a single feature at a time. In this algorithm, a set of classification rules for the particular tested features is generated based on the value of a single feature, whereby the feature with the lowest error rate is chosen as "one rule". The error rate is generated by the proportion of instances that do not belong to the majority class of the corresponding feature. Overall, it is very helpful in selecting features but not for classifying data that contains many features because OneR only considers one feature (Muda et al., 2011b).
The Hidden Markov Model (HMM) approach has been widely used in various fields of application such as speech synthesis, crypto analysis, speech recognition, and classification problem-solving. In the ABDS classification model, HMM has the capability to distinguish between normal and abnormal behaviour. Unfortunately, the model is more suitable for one-dimension sequence classification, such as wave spectrum or voice (Choraś, 2015). As in ABDS, the data are in multi-dimensional sequences (continuous and discrete) mixed together, which makes them unsuitable for detecting anomalous traffics.
Apart from HMM, GA has been widely applied as a selection feature in the field of intrusion detection (Kamarudin et al., 2016). In the view of GA as a classification approach to achieve high accuracy, unfortunately, the drawbacks have outweighed the advantages of this algorithm. The main downside refers to the computational effort in processing the crossover, mutation, selection, iteration, and combination stages (Tsai et al., 2009). The methods seem to be unsuitable to be used as a detection approach in dealing with high volumes of traffic.
1. Multilayer Perceptron (MLP)
Mapping a set of input data into outputs can be performed using simple feed-forwards NN or MLP. In MLP, multiple layers of neurons are placed in layers that always flow towards the output layer. Single perceptron refers to only one layer, while multilayer perceptron has multiple layers. The class of multilayers usually operates in a feed-forward way. Each neuron placed in a layer is connected directly to another neuron on a subsequent layer. The algorithm applies a sigmoid function as an activation function. These classification algorithms have been popular to be applied in back propagation techniques in training the network. Using this technique, the predefined error-function value is computed by comparing the output values with the correct answer. The error generated is then fed back through the network. The information gathered from the previous stage is used to calibrate the weight of each connection with the aim of reducing the error function. The process is repeated for an adequate number of rounds until it reaches the state where the calculation of error is small. In this state, it shows that the network has acquired a certain level of function. Normally, there will be an issue for the algorithm in classifying instances that were not present in the training set. In some cases, this is vital, considering that the training sample is limited in availability. As a result, the algorithm tends to over-fit and is unable to capture the true statistical process in producing the data. In the area of neural networks, there is an early stopping criterion for simple heuristics in ensuring that the algorithm can be well-generalised to instance that does not exist in the training data.
2. Naive Bayes (NB)
been implemented in various fields with the aim of solving classification down side, such as low detection accuracy and false detection rates. Moreover, it is also effective in handling continuous data and missing values alongside its simple and easy implementation (Farid et al., 2014).
3. Decision Tree (J48)
The J48 classifier is one of the present notable methods used in DM techniques. The algorithm was first introduced by Quinlan (1986), and can be viewed as a tree from a set of attributes to a particular class. It consists of three indispensable sections: the root node that illustrates the stipulation on a data point, the branch that corresponds to the probability feature values, and a leaf node that is labelled with the decision value for a classification category in order to classify its entity. The process of constructing a decision tree is similar to the procedure of divide and conquer. Hence, the IG criterion is used to select attributes that can provide maximum information in forming a decision to achieve the finest feature splitting (AL-Nabi and Ahmed, 2013). It then seeks to calculate the information content by attempting to produce the answer in a series of bits. Therefore, a one-bit answer is encoded in the bit of yes or no. The conventional approach to constructing a J48 algorithm is called the classification and regression tree (CART). The J48 algorithm with discrete class labelled is known as a classification tree, while the regression tree can be described when J48 algorithm contains a scale of continuous values.
4. Support Vector Machines (SVM)