The satisfaction of university students:
differences by field of study
Juan Carlos, Campaña and J. Ignacio, Giménez-Nadal and
Jose Alberto, Molina
University of Zaragoza, University of Zaragoza and CTUR,
University of Zaragoza and IZA
1 June 2015
Online at
https://mpra.ub.uni-muenchen.de/64727/
Introduction
This paper examines the factors that may influence the level of satisfaction of students
at the University of Zaragoza (Spain). Many theories of college retention recognize the
significance of student satisfaction as a positive factor in student persistence (see Suhre et al.
(2007) for a review), and the analysis of the satisfaction of university students can provide
information to identify inequalities, trends, and public needs within and across college
populations (Campbell, 1976). Moreover, prior research has found that observed
heterogeneity of students can explain part of the variation in satisfaction at school or
university. Huebner et al. (2000) found that women are more satisfied with their experience at
school, compared to men, and Caucasian students are more satisfied than others with their
friends and life environment. Zullig et al. (2009) found that race influenced the results, since
Caucasian students are more satisfied with school, compared with ethnic minorities. Lykken
and Tellegen (1996) argue that individual characteristics can explain up to 80% of
satisfaction. Hence, the analysis of what factors are related to the level of satisfaction of
university students proves important for teachers, students, and policy-makers. This paper
contributes to the literature in confirming the importance of student heterogeneity, together
with motivations and the field of study, in influencing the level of satisfaction of
undergraduate students.
We use data from the survey “Los universitarios aragoneses y su altruismo” for the
academic year 2011/2012, conducted at the University of Zaragoza (Spain), among
undergraduate students from different fields of study1. The survey provides information on
the socio-demographic characteristics of students from four disciplines: Economics and
Business, Health Sciences, Arts and Philosophy, and Engineering Sciences. In this academic
1 See Giménez-Nadal and Ortega (2015) for a detailed explanation of the survey. Recent evidence on altruistic
versus non-altruistic behaviors appear in Molina (2013 and 2014).
year, the University of Zaragoza ranks among the top 20 universities in Spain, in terms of the
number of undergraduate students, which is relevant for the validity of the sample. The
survey gathers information on how students assess their level of satisfaction at the University,
which is analyzed in relation to the socio-demographic characteristics and expectations of
students. We estimate linear OLS models on the level on satisfaction, controlling for factors
such as the field of study, gender, risky behaviors, and expectations.
Our main results show that students of Engineering Sciences are less satisfied with their
university life, relative to students in other fields. In particular, we find that undergraduate
students from Health Sciences, Art and Philosophy, and Economics and Business report
satisfaction scores of 0.213, 0.233 and 0.061 higher, compared to students from Engineering
Sciences, which represent differences of 23%, 25% and 6% of one standard deviation in
satisfaction. These differences are obtained when socio-demographic characteristics,
motivations, and expectations are considered in the analysis, which points towards net
differences in satisfaction levels. However, in this analysis, we cannot take into account the
unobserved heterogeneity of individuals that may condition the interpretation individuals may
make of the valuation scale and the selection of the field of study. Within this framework,
variations by field of study may be observed because different individuals select in different
fields, and not because that particular area increases the satisfaction of students. Hence, we
cannot establish a causal link between student satisfaction and field of study, and thus our
analysis represents only a first step in understanding differences in student satisfaction, and
more research on this issue is needed.
We find that alcohol and tobacco consumption is positively related to student satisfaction.
At the country level, it is interesting to analyze possible reasons at the root of these
relationships. Spain has the recent phenomenon of “botellon”, where young people meet in
and this practice is commonly seen as a way to socialize with peers. Thus, alcohol
consumption in young people is associated with greater socialization with their peers (Duarte
et al., 2007 and 2011), which likely influences the size of personal networks. Thus, we
hypothesize that higher satisfaction of students and alcohol consumption may reflect the
effect of greater socialization among students (Murphy et al., 2005), especially given the
positive relationship between satisfaction and health status reported by these students, and the
detrimental effect of alcohol consumption on health and human development that can lead to
lower academic efficiency (Gil and Molina, 2007). We leave this question open to future
research.
Finally, we find the feeling that having a university degree will be enough to obtain a job
in the future is positively related to the level of satisfaction. Thus, students who believe the
degree will be a passport to a job report a higher level of satisfaction, indicating the
importance of expectations in influencing the satisfaction of students. This is especially
relevant in our context, given the high rates of unemployment in Spain at the time of the
survey (INE, 2014), and where the under-30 generation is especially affected.
We contribute to the literature by analyzing what factors affect the satisfaction
undergraduates report at University. Knowing these factors is particularly important, as a
body of research reports that around 20–30% of students do not return to their initial
institution for the second year (Rausch and Hamilton, 2006). Other research claims that
satisfaction at university affects student performance (Bean and Bradley, 1986; Pike, 1991),
is a predictor of student persistence at university (Aitken, 1982; Tinto, 1993), or helps a
Data and empirical strategy
The data used in the analysis is obtained from the survey “Los universitarios aragoneses y su
altruismo” (The University Students in Aragon and their Altruism) corresponding to the
academic year 2011/2012, conducted by the research group “Industrial and Family
Economics” of the University of Zaragoza (Spain). The data comprise a representative
sample of students in four fields of study, providing information on socio-demographic
variables and student expectations/motivations. The University of Zaragoza ranks 13th out of
74 Spanish Universities in terms of the number of students. At the time of the survey, 31,548
where officially enrolled in degree courses at the University, of which 82.17% were born in
the same Autonomous Community (Aragon), 14.88% of students were born in other
Autonomous Communities, and 2.95% of students came from abroad. For consider Spain is
organized into 17 Autonomous Communities (Andalucia, Aragon, Madrid, Catalonia, etc.)
and 2 autonomous cities (Ceuta and Melilla).
The sample of students comprise the following faculties: Economics and Business,
including Economics and Business Administration; Health Sciences, including Medicine,
Nursing, and Physiotherapy; Arts and Philosophy, including Information and Documentation,
Philosophy, Journalism, English Studies, History, Geography, Art History, Classical Studies,
and Hispanic Studies, and Engineering Sciences, including Geology, Optometry,
Biotechnology, Physics, Chemistry, Mathematics, Engineering, Industrial Design,
Architecture, Mechanical Engineering, Chemical Engineering, Industrial Technology,
Telecommunication Engineering, Computer Engineering, and Electrical Engineering.
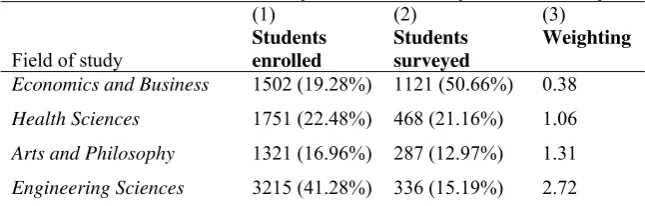
Table 1 shows the distribution of the sample across the different fields of study. In the year
of the survey, 7,789 students were enrolled in the faculties surveyed, distributed as follows:
Health Sciences; 16.96% were enrolled in Arts and Philosophy, and 41.28% were enrolled in
Engineering Sciences. The total number of students surveyed is 2,212, representing 28.39%
of the total student body, divided as follows: 50.66% are students of Economics and
Business, 22.48% are students of Health Sciences, 16.96% are students of Arts and
Philosophy, and 15.19% are students of Engineering Sciences. Given that we have different
percentages of students in each field of the population and in the sample, weights are used to
give the sample the same proportion of students in the different fields of study in comparison
with the total population: 0.38 for Economics and Business, 1.06 for Health Sciences, 1.31
for Arts and Philosophy, and 2.72 for Science and Engineering.
[Table 1 here]
For the dependent variable, we focus on the answer to the following question: What is the
current level of your satisfaction with university life? Possible responses are on a scale from
1 to 5, with the value “1” referring to “very dissatisfied”, and the value 5 referring to “very
satisfied”. Looking at overall values of the responses to this question, we observe an overall
value of 3.624 and a standard deviation of 0.899. Students from Health Sciences show the
largest value in response to the question (3.688) followed by students from Arts and
Philosophy (3.659) and Economics and Business (3.606), while students in Engineering
Sciences report the lowest level of satisfaction (3.564). We find that the difference in overall
satisfaction between students in Health Sciences and Engineering Sciences is statistically
significant at standard levels (p=0.07). Thus, we observe that students’ levels of satisfaction
may differ according to the field of knowledge, and we include this as an explanatory factor.
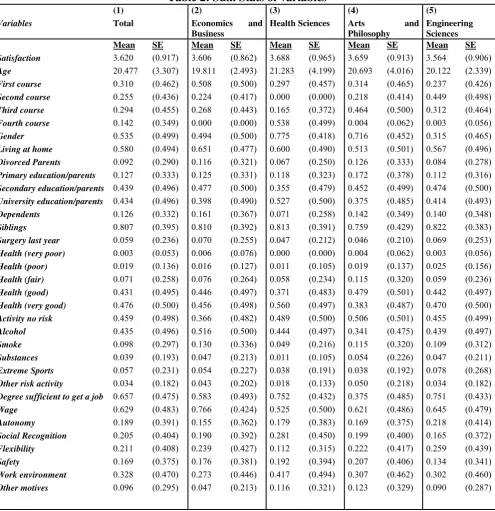
Table 2 shows summary statistics of the socio-demographic variables and expectations for
undergraduates in our sample. Column 1 shows summary statistics for all surveyed students,
age of our sample is 20.45 years, with the youngest group being students of Economics and
Business (19.81 years of age, on average). The largest proportion of students are in the first
year of their degree course (31%), more females than males were surveyed (53.5% of the
total), although the fields of Economics and Business and Engineering Sciences have more
male respondents. Slightly more than half of the students (58%) live at home, with 9.2% of
the students having divorced parents. The level of education of the bread-winner in the
household is secondary education for 43.9% of students, while university-educated
bread-winners correspond to 43.4% of the students. There are dependent adults at home in 12.6% of
cases, while 80.7% of the students have siblings. The proportion of students who had any
type of surgery in the previous year is 5.9% of the sample, while a high proportion of
students report having a good (43.1%) or a very good (47.6%) health status. Regarding risky
behaviors, 45.9% of the students indicated they are not involved in any risky behavior, while
43.6% and 9.8% reported drinking alcohol and smoking on a regular (weekly) basis,
respectively. Furthermore, 3.9% of students admitted to consuming some type of illegal
substance, 5.7% reported practicing extreme sports, and 3.4% reported taking other risks
(students were able to choose more than one risky behavior, as appropriate).
[Table 2 here]
We also use the information obtained from two additional questions included in the
survey. The first question is: “Do you think your degree will be enough to obtain a job?” with
students answering yes (1) or no (0) to this question. The second question is: “What two
characteristics of your future work will you value the most”, selecting from the following
options: salary, autonomy, social recognition, flexibility, safety, work environment, and
others. The responses to these questions allow us to obtain the variables related to the
motivations and expectations of students, as prior research has shown that decision-making in
Table 2 shows that 65.7% of the students report believing that their degree will be enough
to obtain a job in the future. However, there are differences in this rate by field of knowledge.
The higher rates correspond to Health Sciences (75.2%) and Engineering Sciences (75.1%),
while the lowest rate corresponds to Arts and Philosophy (37.5%). Thus, students may see
their degree as helpful to a career in some cases, and not in others, which may indicate that
certain students choose their degrees in order to increase their employability, while others
choose their degrees for other reasons (e.g., personal interest, vocation).
Table 2 shows that, among the options available, “salary” is chosen as an important
characteristic in 62.9% of the cases. By field of study, the highest percentage of students
choosing “salary” as one of their preferred options is shown in Economic and Business
(76.6%). The lowest percentage of students choosing this option appears in Health Sciences
(52.5%). These differences indicate that motives to choose the degree and field of study may
differ among students. The second most valued characteristic of the future job is “work
environment”, with students choosing this option in 32.8% of the cases, which may indicate
that students will consider this work characteristic important if they are confronted with
several job offers at the same time.
For the econometric analysis, we estimate OLS regressions on the level of satisfaction of
undergraduate students, although, given that we have a categorical variable, other models,
such as the ordered probit model, may be preferred to OLS models. However,
Ferrer-i-Carbonell and Frijters (2004) show that assuming ordinality or cardinality of
happiness/satisfaction scores makes little difference, whilst allowing for fixed-effects does
change results substantially. Given that we rely on cross-sectional data, we use OLS models,
although we have alternatively estimated ordered probit models, and our qualitative
We estimate the following equation:
i i i
S =
α
+
β
X +
ε
(1)where Si represents the satisfaction level of undergraduate student “i”, and vector Xi
includes individual and household characteristics, including field of study, age and its square,
academic course, gender (ref.: male), living at parents’ home, whether parents are
divorced/separated, or not, the educational level of the head of the household, whether there
are dependent relatives at home, number of siblings, if the respondent had a surgery last year,
health status, risky behaviors, whether the respondent believes the degree will be enough to
obtain a job, and the two characteristics of the job the respondent considers as most
important. We correct our estimates with the use of robust standard errors.
Results
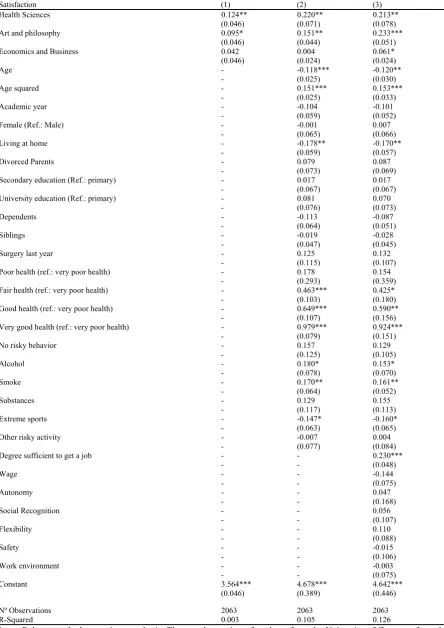
Table 3 shows the results of estimating OLS models on our dependent variable. Column
(1) shows the results of including the field of study only (ref.: Engineering Sciences), Column
(2) shows the results of including the field of study and socio-demographic variables, and
Column (3) shows the results of including the previous factors and the characteristics that the
students value most for their future work, and whether the students consider that the degree
will be sufficient to obtain a job. Column (1) shows that, with respect to students in the field
of Engineering Sciences, students in the fields of Health Sciences (p<0.05) and Art and
Philosophy (p<0.10)report a higher level of satisfaction with university life, as the indicators
of being in those disciplines are positive and highly significant. Furthermore, those who are
the most satisfied are students of Health Sciences. These results allow us to conclude that
students in Engineering Sciences are slightly less satisfied compared to students in other
fields of study.
These results are maintained when we include the socio-demographic characteristics of the
students (Column (2)). We observe that students of Health Sciences (p<0.05) and Arts and
Philosophy (p<0.05) are more satisfied, relative to students in Engineering Sciences, with students in Health Sciences being those who report higher levels of satisfaction. Furthermore,
students in Economics and Business appear to be equally satisfied, relative to students in
Engineering Sciences. Thus, differences in satisfaction across fields of study remain after the
observed heterogeneity of individuals has been controlled for. Considering the remaining
variables, we observe that academic year (p<0.1), living in the family home (p<0.05) and
doing extreme sports (p<0.10) all have negative relationships to the level of satisfaction,
while having fair (p<0.01), good (p<0.01) and very good (p<0.01) health, drinking alcohol
(p<0.10) and smoking (p<0.05) are all positively related to student satisfaction. In the case of
age, we observe a u-shaped relationship with the satisfaction of students.
The relationship to age can be explained because the majority of respondents (between 18
and 25) are in the period of “emerging adulthood” (Arnett, 2001, 2004). According to that
author, students at this age can experience some degree of instability, since their selected
studies may no longer be interesting, or may require more effort and talent than the students
have, or may require a higher initial knowledge than first considered. The negative influence
of living at home indicates that students would prefer not to be living with their parents,
despite that Spanish youth are those who leave home much later than any others in Europe.
This may indicate that there are external conditions operating, such as minimal public
subsidies for rentals to the young, and housing prices that prevent them leaving home.
Regarding the positive significance of alcohol consumption by students, studies such as
Murphy et al. (2005) indicate that alcohol use by male students shows a positive relationship
to social satisfaction, which may be due to the fact that alcohol consumption among youths in
known in Spain to refer to meetings of young people in open public places for alcohol
consumption in groups).
Column (3) in Table 3 shows the results of adding the variables related to the
characteristics that the students value most for their future work, and the variable indicating
whether students feel that their degree will be sufficient to obtain a job (1) or not (0). We find
that students of Health Sciences (p<0.05), Art and Philosophy (p<0.01) and Economics and
Business (p<0.10) are more satisfied than students of Engineering Sciences. We find no
significant changes with respect to the socio-demographic variables. Regarding the new
variables introduced, we find that only the feeling about their future success (expectation) in
getting a job is correlated with their level of satisfaction, with the feeling that the degree will
be enough to obtain a job in the future being positively related (p<0.01) with their level of
satisfaction. Thus, we can conclude that those students with a better expectation regarding
their future work are more satisfied at University. However, here we must recognize that this
effect can be specific to the country, as the period when the survey was done is characterized
by a high level of youth unemployment (INE, 2014), which may make expectations about the
future work of students important in this context. It may be interesting to contrast whether
this relationship is also significant in other countries.
Conclusions
In this paper, we analyze the satisfaction level of students, using data from a survey
carried out at the University of Zaragoza (Spain), which is ranked among the top 20
universities in terms of number of students. In our analysis, we consider how satisfaction
levels vary by field of study, controlling for socio-demographic characteristics, motivations,
and expectations. Our findings indicate that students of Engineering Sciences are less
socio-demographic factors, we find a positive relationship between satisfaction, on the one
hand, and health status, alcohol, and tobacco consumption on the other. These positive
relationships may be explained by the “botellon” phenomenon, where young people meet to
drink in open and public spaces. We additionally find a negative association between living at
home and doing extreme sports, and the level of satisfaction.
Our results allow us to make certain recommendations, for the university and for future
employers. One significant correlate of student satisfaction is the fact that students consider
that pursuing a university degree will be enough to obtain a job in the future. Thus, increasing
the expectations of students regarding the usefulness of their degree may serve to increase the
satisfaction of students, leading to better academic outcomes. One way that universities and
firms can help to make this happen is to generate more agreements with potential employers,
allowing students to participate in professional internships, which would be a more practical
step towards meeting the demands of the labor market.
One limitation of our analysis is that our data is a cross-section of individuals, and thus we
cannot take into account the unobserved heterogeneity of individuals. There may be
unobserved factors at the individual level that correlate with the level of satisfaction, the
choice of the field of study, and the level of motivation. Factors such as attitudes,
monetary/financial status, social value orientation, social incentives, and socio-economic
background may all influence the level of satisfaction and the choice of academic discipline.
Thus, while we cannot identify any causal effect of motivation on the level of satisfaction,
our analysis of the correlational structure of the data may serve as a first step in
understanding the determinants of the satisfaction of undergraduate students. We leave this
References
Aitken, N. D. (1982). College student performance, satisfaction, and retention, Journal of
Higher Education 53: 32
Arnett, J.J. (2000). Emerging adulthood: A theory of development from the late teens
through the twenties,American psychologist,55(5): 469.
Arnett, J.J. (2004).Emerging adulthood: The winding road from the late teens through the
twenties, Oxford University Press.
Bean, J.P., & Bradley, R.K. (1986). Untangling the satisfaction-performance relationship for
college students, Journal of Higher Education 57: 393.
Campbell, A. (1976). Subjective measures of well-being, American Psychologist, 31, 119–
124.
Duarte, R., Escario, J.J., & J.A. Molina (2009). El abuso juvenil de alcohol: estimaciones
count data, Revista de Economía Aplicada 49: 81-104.
Duarte, R., Escario, J.J., & J.A. Molina (2011). Peer effects, unobserved factors and risk
behaviours in adolescence, Revista de Economía Aplicada 55: 125-151.
Ferrer-i-Carbonell, A., & P. Frijters (2004). How Important is Methodology for the estimates
of the determinants of Happiness, Economic Journal 114: 641-659.
Gil, A., & J.A. Molina (2007). Human development and alcohol abuse in adolescence,
Applied Economics 39: 1315-1323.
Giménez-Nadal, J.I. & R. Ortega (2015). Time dedicated to family by university students:
differences by academic area in a case study, Journal of Family and Economic Issues
36(1): 132-142.
Huebner, E. S., Drane, W., & Valois, R. F. (2000). Levels of demographic correlates of
Instituto Nacional de Estadística (INE, 2014). http://www.ine.es/
Lee, G., Jolly, N., Kench, P., & Gelonesi, B. (2000). Factors related to student satisfaction
with university, In Presented at the 4th Pacific Rim—first year in higher education
conference: Creating futures for a new millennium, Brisbane.
Lykken, D., & Tellegen, A., (1996). Happiness in a stochastic phenomenon, Psychological
Science. 7 (3): 186–189.
Molina, J.A. (2013). Altruism in the household: in-kind transfers in the context of kin
selection, Review of Economics of the Household 11 (3): 309-312.
Molina, J.A. (2014). Altruism and monetary transfers in the household: inter- and intra
generation issues, Review of Economics of the Household 12 (3): 407-410.
Murphy, J. G., McDevitt-Murphy, M. E., & Barnett, N. P. (2005). Drink and be merry?
Gender, life satisfaction, and alcohol consumption among college students,
Psychology of Addictive Behaviors 19: 184–191.
Pike, G.R. (1991). The effects of background, coursework, and involvement on students’
grades and satisfaction, Research in Higher Education 32: 15.
Rausch, J.L., & Hamilton, M.W. (2006). Goals and distractions: Explanations of early
attrition from traditional university freshmen, The Qualitative Report 11: 317–334.
Sojkin, B., Bartkowiak, P., & Skuza, A., (2012). Determinants of higher education choices
and student satisfaction: the case of Poland, Higher Education 63: 565-581.
Suhre, C.J.M., Jansen, E.P.W.A., & Harskamp, E.G. (2006). Impact of degree program
satisfaction on the persistence of college students, Higher Education 54: 207-226.
Tinto, V. (1993). Leaving college: Rethinking the causes and cures of student attrition.
Zullig, K. J., Huebner, E. S., & Pun, S. M. (2009). Demographic correlates of domain-based
[image:15.595.136.459.338.441.2]life satisfaction reports of college students,Journal of Happiness Studies,10(2), 229-238
Table 1: Number of surveys, conducted by field of study
Field of study
(1)
Students enrolled
(2)
Students surveyed
(3)
Weighting
Economics and Business 1502 (19.28%) 1121 (50.66%) 0.38
Health Sciences 1751 (22.48%) 468 (21.16%) 1.06
Arts and Philosophy 1321 (16.96%) 287 (12.97%) 1.31
Engineering Sciences 3215 (41.28%) 336 (15.19%) 2.72
Notes: The sample consists of students from the University of Zaragoza from the Faculty
of Economics and Business, Faculty of Medicine, Faculty of Philosophy, School of
Engineering, Faculty of Science, and Faculty of Health Sciences. In parenthesis the
percentage of students corresponding to each academic field, both for the population
Table 2: Sum Stats of variables
(1) (2) (3) (4) (5)
Variables Total Economics and
Business
Health Sciences Arts and
Philosophy
Engineering Sciences
Mean SE Mean SE Mean SE Mean SE Mean SE
Satisfaction 3.620 (0.917) 3.606 (0.862) 3.688 (0.965) 3.659 (0.913) 3.564 (0.906)
Age 20.477 (3.307) 19.811 (2.493) 21.283 (4.199) 20.693 (4.016) 20.122 (2.339)
First course 0.310 (0.462) 0.508 (0.500) 0.297 (0.457) 0.314 (0.465) 0.237 (0.426)
Second course 0.255 (0.436) 0.224 (0.417) 0.000 (0.000) 0.218 (0.414) 0.449 (0.498)
Third course 0.294 (0.455) 0.268 (0.443) 0.165 (0.372) 0.464 (0.500) 0.312 (0.464)
Fourth course 0.142 (0.349) 0.000 (0.000) 0.538 (0.499) 0.004 (0.062) 0.003 (0.056)
Gender 0.535 (0.499) 0.494 (0.500) 0.775 (0.418) 0.716 (0.452) 0.315 (0.465)
Living at home 0.580 (0.494) 0.651 (0.477) 0.600 (0.490) 0.513 (0.501) 0.567 (0.496)
Divorced Parents 0.092 (0.290) 0.116 (0.321) 0.067 (0.250) 0.126 (0.333) 0.084 (0.278)
Primary education/parents 0.127 (0.333) 0.125 (0.331) 0.118 (0.323) 0.172 (0.378) 0.112 (0.316)
Secondary education/parents 0.439 (0.496) 0.477 (0.500) 0.355 (0.479) 0.452 (0.499) 0.474 (0.500)
University education/parents 0.434 (0.496) 0.398 (0.490) 0.527 (0.500) 0.375 (0.485) 0.414 (0.493)
Dependents 0.126 (0.332) 0.161 (0.367) 0.071 (0.258) 0.142 (0.349) 0.140 (0.348)
Siblings 0.807 (0.395) 0.810 (0.392) 0.813 (0.391) 0.759 (0.429) 0.822 (0.383)
Surgery last year 0.059 (0.236) 0.070 (0.255) 0.047 (0.212) 0.046 (0.210) 0.069 (0.253)
Health (very poor) 0.003 (0.053) 0.006 (0.076) 0.000 (0.000) 0.004 (0.062) 0.003 (0.056)
Health (poor) 0.019 (0.136) 0.016 (0.127) 0.011 (0.105) 0.019 (0.137) 0.025 (0.156)
Health (fair) 0.071 (0.258) 0.076 (0.264) 0.058 (0.234) 0.115 (0.320) 0.059 (0.236)
Health (good) 0.431 (0.495) 0.446 (0.497) 0.371 (0.483) 0.479 (0.501) 0.442 (0.497)
Health (very good) 0.476 (0.500) 0.456 (0.498) 0.560 (0.497) 0.383 (0.487) 0.470 (0.500)
Activity no risk 0.459 (0.498) 0.366 (0.482) 0.489 (0.500) 0.506 (0.501) 0.455 (0.499)
Alcohol 0.435 (0.496) 0.516 (0.500) 0.444 (0.497) 0.341 (0.475) 0.439 (0.497)
Smoke 0.098 (0.297) 0.130 (0.336) 0.049 (0.216) 0.115 (0.320) 0.109 (0.312)
Substances 0.039 (0.193) 0.047 (0.213) 0.011 (0.105) 0.054 (0.226) 0.047 (0.211)
Extreme Sports 0.057 (0.231) 0.054 (0.227) 0.038 (0.191) 0.038 (0.192) 0.078 (0.268)
Other risk activity 0.034 (0.182) 0.043 (0.202) 0.018 (0.133) 0.050 (0.218) 0.034 (0.182)
Degree sufficient to get a job 0.657 (0.475) 0.583 (0.493) 0.752 (0.432) 0.375 (0.485) 0.751 (0.433)
Wage 0.629 (0.483) 0.766 (0.424) 0.525 (0.500) 0.621 (0.486) 0.645 (0.479)
Autonomy 0.189 (0.391) 0.155 (0.362) 0.179 (0.383) 0.169 (0.375) 0.218 (0.414)
Social Recognition 0.205 (0.404) 0.190 (0.392) 0.281 (0.450) 0.199 (0.400) 0.165 (0.372)
Flexibility 0.211 (0.408) 0.239 (0.427) 0.112 (0.315) 0.222 (0.417) 0.259 (0.439)
Safety 0.169 (0.375) 0.176 (0.381) 0.192 (0.394) 0.207 (0.406) 0.134 (0.341)
Work environment 0.328 (0.470) 0.273 (0.446) 0.417 (0.494) 0.307 (0.462) 0.302 (0.460)
Other motives 0.096 (0.295) 0.047 (0.213) 0.116 (0.321) 0.123 (0.329) 0.090 (0.287)
Notes: Standard deviations in parenthesis. The sample consists of students from the University of Zaragoza from the Faculty of Economics
and Business, Faculty of Medicine, Faculty of Philosophy, School of Engineering, Faculty of Science, and Faculty of Health Sciences.
Sample weights are computed considering the percentage of students corresponding to each academic field, both for the population
(students enrolled) and the surveyed students. The level of satisfaction is obtained from the question: “What is the current level of
satisfaction with your university life?”, with Possible responses selected on a scale from 1 to 5, with the value “1” referring to very
dissatisfied, and the value 5 referring to very satisfied.
Table 3. OLS regressions for the level of satisfaction
Satisfaction (1) (2) (3)
Health Sciences 0.124** 0.220** 0.213**
(0.046) (0.071) (0.078)
Art and philosophy 0.095* 0.151** 0.233***
(0.046) (0.044) (0.051)
Economics and Business 0.042 0.004 0.061*
(0.046) (0.024) (0.024)
Age - -0.118*** -0.120**
- (0.025) (0.030)
Age squared - 0.151*** 0.153***
- (0.025) (0.033)
Academic year - -0.104 -0.101
- (0.059) (0.052)
Female (Ref.: Male) - -0.001 0.007
- (0.065) (0.066)
Living at home - -0.178** -0.170**
- (0.059) (0.057)
Divorced Parents - 0.079 0.087
- (0.073) (0.069)
Secondary education (Ref.: primary) - 0.017 0.017
- (0.067) (0.067)
University education (Ref.: primary) - 0.081 0.070
- (0.076) (0.073)
Dependents - -0.113 -0.087
- (0.064) (0.051)
Siblings - -0.019 -0.028
- (0.047) (0.045)
Surgery last year - 0.125 0.132
- (0.115) (0.107)
Poor health (ref.: very poor health) - 0.178 0.154
- (0.293) (0.359)
Fair health (ref.: very poor health) - 0.463*** 0.425*
- (0.103) (0.180)
Good health (ref.: very poor health) - 0.649*** 0.590**
- (0.107) (0.156)
Very good health (ref.: very poor health) - 0.979*** 0.924***
- (0.079) (0.151)
No risky behavior - 0.157 0.129
- (0.125) (0.105)
Alcohol - 0.180* 0.153*
- (0.078) (0.070)
Smoke - 0.170** 0.161**
- (0.064) (0.052)
Substances - 0.129 0.155
- (0.117) (0.113)
Extreme sports - -0.147* -0.160*
- (0.063) (0.065)
Other risky activity - -0.007 0.004
- (0.077) (0.084)
Degree sufficient to get a job - - 0.230***
- - (0.048)
Wage - - -0.144
- - (0.075)
Autonomy - - 0.047
- - (0.168)
Social Recognition - - 0.056
- - (0.107)
Flexibility - - 0.110
- - (0.088)
Safety - - -0.015
- - (0.106)
Work environment - - -0.003
- - (0.075)
Constant 3.564*** 4.678*** 4.642***
(0.046) (0.389) (0.446)
Nº Observations 2063 2063 2063
R-Squared 0.003 0.105 0.126
Notes: Robust standard errors in parenthesis. The sample consists of students from the University of Zaragoza from the
Faculty of Economics and Business, Faculty of Medicine, Faculty of Philosophy, School of Engineering, Faculty of Science,