©IJRASET: All Rights are Reserved
3717
Mango Disease Detection by using Image
Processing
Prof. Shripad S.Veling
1, Mr.Rohit S. Kalelkar
2, Miss. Likhita V. Ajgaonkar
3, Miss. Nivedita V. Mestry
4, Mr. Nilesh N.
Gawade
51, 2, 3, 4, 5Department of Electronics and Telecommunication, S.S.P.M’s College of Engineering, kankavali,Mumbai University
Abstract: Mango is the popular delicious fruit and cash crop. When diseases affect the mango plant there is significant decrease in the production of mango due to which farmers suffer in selling their yield. This problem motivated to develop the new techniques to detect and diagnose the diseases affecting the mango plant and devise the expert system to prevent those. To increase production and quality, it is very necessary to control all such harmful disease at the earlier stage. In our country most of the farmers are illiterate. So they cannot get correct information about disease. It requires an expert advisor or agricultural officer. But it is difficult for an expert advisor or an agricultural officer to reach at every farmer. In mentioned system For image enhancement “Imadjust” function is particularly used for contrast enhancement. This is a inbuilt function in MATLAB. Contrast enhanced is done by linearly scaling pixel values and features used are Contrast, Correlation, Energy, Entropy, Homogeneity, Cluster prominence,Cluster shade, Variance and Dissimilarity. Classifier used is SVM. The proposed system gives accuracy of 90% while testing on 92 samples.
Keywords: Mango disease, Production, Image Processing, diseases
I. INTRODUCTION
Now a days, production of mango fruit decreases because of climatic conditions and environmental concerns like heavy raining, high humidity, reduction in soil nutrients, diversity of associated diseases and disorder problems. Typically the detection of mango plant diseases is done by naked eye observation, which provides less accuracy. Low productivity of mango fruit is due to the various diseases affecting mango plant which are not recognized by the farmers as they are illiterate. In some rural areas farmers may have to go long distance to visit experts, this may be too expensive and time consuming and even farmers are unaware of diseases. Kisan call centers are available but do not service 24x7 hours and sometimes communication will be fail. Sometimes response getting from the agricultural officer is delayed. Hence proper disease detection is not done within short time which results in reduction of mango fruit production. This paper gives basic idea about detection and recognition of different diseases occurred on various parts of the mango plant like stem, fruit, leaves, branch etc. also proper preventive care is provided for the affected region of the mango plant so that production of mango fruit will increase as well as quality of the mango fruit will improve.
II. LITERATUREREVIEW
The main reason why we have chosen this idea of detecting mango diseases is to support production of mango fruit in India, that is depleted due to various diseases. This paper illustrates how different diseases affect mango fruit productivity. The main diseases that affect mango fruit productivity are Anthracnose, Powdery Mildew and Red Rust according to paper thus we have chosen this four diseases along with a subsidiary disease called Black Banded. This paper also illustrates preventative ways and cure for disease [1]. This paper proposes MATLAB based disease detection system. This system proves it’s ability to detect leaf based diseases though there are many major diseases that affect the productivity of mango crop. For example Black Band which majorly occurs on barks or stem and still affect productivity. Also some diseases are also there which occurs on fruit itself. Accuracy is also main constrain that needs improvement.
First step of digital image processing is Image Preprocessing which is one of the main steps for retaining originality in an image that may be degraded due to several noises or due to other causes. This paper is a review of several Image Preprocessing techniques that can be employed [2].
©IJRASET: All Rights are Reserved
3718
This paper presents review on features to be extracted. Features that can be extracted from image may of various types like global or local. In that there are subcategories like texture based or color based features etc. [4] [5].
The best and easy way to calculate texture based features in MATLAB based system is by using GLCM(Gray level Co-occurrence Matrix).MATLAB has in-built function for drawing GLCM. This paper provides equations for calculating various texture based features from GLCM matrix. GLCM is matrix function of angle and distance thus computational cost of GLCM is very high. This paper presents directional analysis of gray level images using GLCM. According to this paper, choosing 0 direction yields better results [6].
In feature extraction, for successful disease detection it is necessary to make proper selection of features that best describes the given disease is important. This paper illustrates different features selection algorithms and feature scoring methods. According to this paper Sequential Forward Selection is better method for feature subset selection and reducing dimensionality [7].
III. PROJECTOVERVIEW
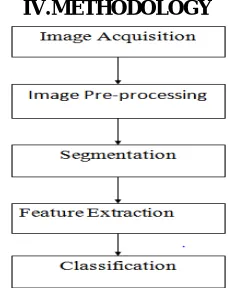
[image:2.595.158.450.432.558.2]In this system, farmer capture picture of the infected leaf, fruit, stem, flower and send it to system via internet. Once system receive the image of infected part of mango plant that image will be input to the system .After this, technical processes will be applied on the image such as Image pre-processing which includes steps like resizing of images, image cropping, image enhancement etc. After that image Segmentation is done which divide the image into small parts for better results. For image segmentation Fast and Robust Fuzzy-C means clustering algorithm is used .Feature extraction is to extract the features from the affected part of the mango plant. Feature Extraction is done by Gray Level Co-occurrence Matrix (GLCM) algorithm. SVM classifier is used to classify the type of disease according to the features extracted. After applying all this technical processes, at the output, system displays name of the disease and preventive care according to the disease identified. This information is send to the farmer as a feedback. In the proposed methodology, several steps are carried out like image acquisition, image pre-processing, image segmentation, feature extraction and classification of images. In the present work several frames, i.e., Images are captured by the farmer with the help of 8 MP camera. Each image is pre-processed in order to enhance and remove the noise from it. The segmentation techniques are applied to detect the affected area. Further, the Feature and Classification are done to extract the defected part of the image and to calculate affected area of the leaf. In proposed system MATLAB R2013a is used and GUI is made on same platform for better user experience.
Fig. 1 Block diagram of mango disease detection
IV. METHODOLOGY
[image:2.595.239.353.585.729.2]©IJRASET: All Rights are Reserved
3719
A. Image Acquisition
Image acquisition is first step in digital image processing. This captures the image through 8 Mega Pixel camera and stores it in digital media for further MATLAB operations. In our work, using digital camera we captured healthy and diseased images of leaves, fruits and stems.
B. Image Pre-Processing
When image resizing is done then interpolation occurs. Image resizing is necessary when there is need to increase or decrease the total number of pixels in image. If number of pixels are less then processing speed will be faster and result is obtained within short period.
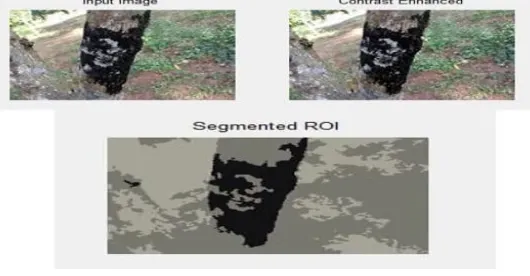
[image:3.595.129.480.265.368.2]Image enhancement is done to enhance the image to get correct region of interest. The main aim of image enhancement is to improve visual quality and brighten the information contents present in the original image before actual processing.in our proposed work, image enhancement is done to easily detect and recognize disease affected area so that proper result will obtain.
Fig 3 Image enhancement
C. Image Segmentation
For image segmentation fast and robust fuzzy c-means clustering algorithm is used. As fuzzy c-means clustering (FCM) algorithm is sensitive to noise, local spatial information is often introduced to an objective function to improve the robustness of the FCM algorithm for image segmentation. The introduction of local spatial information often leads to a high computational complexity, arising out of an iterative calculation of the distance between pixels within local spatial neighbors and clustering centers. An improved FCM algorithm based on morphological reconstruction and membership filtering (FRFCM) that is significantly faster and more robust than FCM, is proposed in this project to address this issue. FRFCM algorithm is simpler and significantly faster.
Fig. 4 Image segmentation
D. Feature Extraction
[image:3.595.170.435.487.625.2]©IJRASET: All Rights are Reserved
3720
1) Contrast: Contrast can be simply explained as difference between maximum and minimum intensity of pixel. It can be formulated as, Contrast= 2 1 0 ,
)
(
)
,
(
i
j
i
j
P
N j i
(1)2) Correlation: A Correlation shows how pixel is correlated to its neibourhood. Its value ranges between -1 to 1.
Correlation=
1 0 , 2)
(
)
(
)
,
(
N j ij
i
j
i
P
(2)3) Energy: Energy measures uniformity with squared elements in GLCM. Range is in between 0 to 1 value of energy is 1 for constant image. Energy= 2 1 0 ,
)
,
(
N j ij
i
P
(3)4) Entropy: Entropy measures disorder in an image and it achieves largest value when all p matrixes are equal.
Entropy =
(
,
)
log[
(
,
)]
1 1
j
i
P
j
i
P
N i N j
(4)5) Homogeneity: Homogeneity gives value that measures closeness of distribution of elements in GLCM to GLCM diagonal.
Homogeneity=
P
i
j
R
N j i
/
)
,
(
1 0 ,
(5)6) Cluster prominence: Cluster prominence measures asymmetry. When value of this feature is high, image is less symmetrical and vice versa.
Cluster Prominence= 4
1 0 1 0
)
(
)
,
(
j
i
j
i
P
N i N j (6)7) Cluster shade: Cluster shade similar to cluster prominence measures skewness.
Cluster shade=
(
)
(
,
)
1 0 1 0 3
j
i
P
j
i
N i N j
(7)8) Variance: It measures dispersion of gray level distribution.
Variance=
(
)
(
,
)
©IJRASET: All Rights are Reserved
3721
9) Dissimilarity: It measures dissimilarity in successive pixels in image.
Dissimilarity=
(
,
)
|
|
1 0 ,
j
i
j
i
P
N
j i
(9)
E. Classification
Classification is most important part in image processing technique which is based on the classifiers. The main function of the classification is to correctly identify the value of a variable that are of discrete class. Classification is done in plant disease detection which depends on whether the image is infected by disease or not. In our proposed work SVM classifier is used for classification. Support Vector Machine is linear model for classification problem and regression problems. SVM algorithm can creates line or a hyperplane which separates the data into classes. SVM’s do a separating line (or hyperplane) between data of two classes. SVM is a algorithm that takes the data as input and outputs a line that separates those classes if possible. Suppose the dataset as shown below and you need to classify the blue triangle from the yellow ellipses. So the task is to find an ideal line that separate this dataset in two classes (blue and yellow).We have infinite lines that can separate these two classes as shown in fig. According to SVM algorithm find the points closest to the line from both the classes. These points are called as support vectors. Then compute the distance between the line and the support vectors. This distance is called as margin. The hyperplane for the margin is maximum in the optimal hyperplane. A hyperplane is an n-dimensional Euclidean space is a flat, n-1 dimensional subset of that space that divide the space into two disconnected parts. SVM tries to make a decision boundary in such a way that separation between the two classes is as wide as possible.
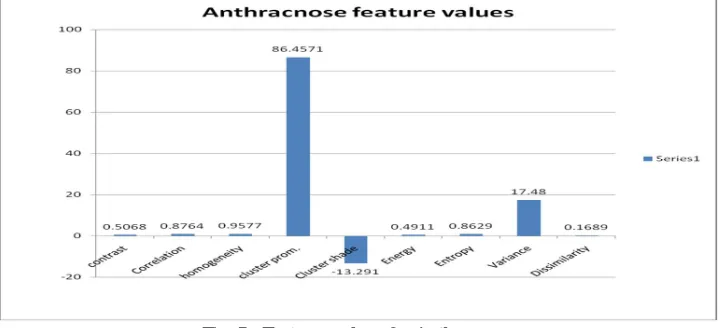
V. RESULTSANDDISCUSSION
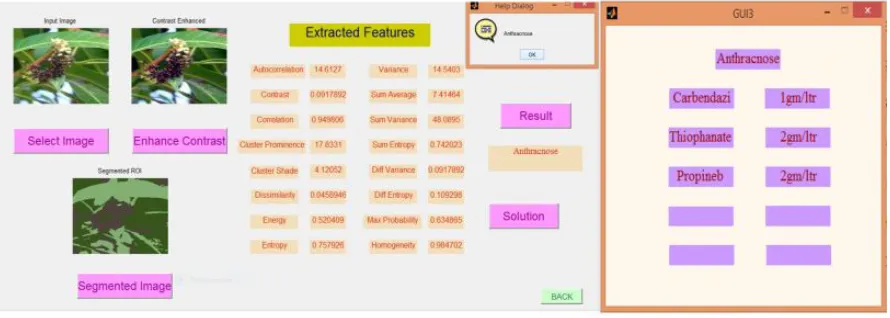
[image:5.595.126.487.474.638.2]The proposed system has built to detect 4 diseases named Anthracnose, Powdery Mildew, Black Banded, Red Rust and to provide solution over them .The GUI and programming is made using MATLAB. The various features selected has following values. Fig. 6 shows Anthracnose disease on mango leaf. By calculating parameters using GLCM algorithm we made training database of 50 samples and determine average value of parameters i.e. Autocorrelation=17.37, Entropy=0.862, Energy=0.49, Variance=17.48, Contrast=0.506 etc. By comparing image sent by farmer with the trained database we get detection of Anthracnose disease on mango plant. Also solution for Anthracnose disease is displayed on the screen.
©IJRASET: All Rights are Reserved
3722
[image:6.595.82.527.314.467.2]Fig. 6 Anthracnose disease detection on mango leaf
Fig. 7 Anthracnose disease detection on mango fruit
Fig. 8 Anthracnose disease detection on mango flower
[image:6.595.78.523.510.669.2]©IJRASET: All Rights are Reserved
3723
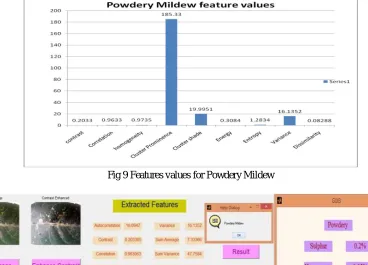
[image:7.595.87.512.306.476.2]Fig 9 Features values for Powdery Mildew
[image:7.595.85.526.558.728.2]Fig.10 Powdery mildew disease detection on leaf
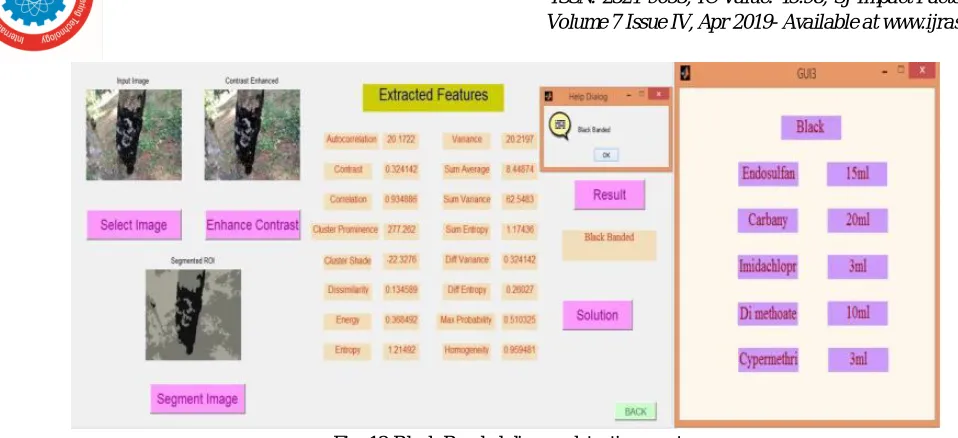
Fig. 12 shows Black Banded disease on mango stem. By calculating parameters using GLCM algorithm we made training database of 50 samples and determine average value of parameters i.e. Autocorrelation=20.17, Entropy=1.214, Energy=0.368, Variance= 20.21, Contrast=0.324 etc. By comparing image sent by farmer with the trained database we get detection of Black Banded disease on mango plant. Also solution for Black Banded disease is displayed on the screen.
©IJRASET: All Rights are Reserved
3724
Fig. 12 Black Banded disease detection on stem
Fig. 14 shows Red Rust disease on mango plant. By calculating parameters using GLCM algorithm we made training database of 50 samples and determine average value of parameters i.e. Autocorrelation=25.03, Entropy=1.264, Energy=0.314, Variance= 25.10, Contrast=0.274 etc. By comparing image sent by farmer with the trained database we get detection of Red Rust disease on mango plant. Also solution for Red Rust disease is displayed on the screen.
[image:8.595.67.525.372.742.2]Fig.13 Features values for Red Rust
©IJRASET: All Rights are Reserved
3725
Above fig 16.shows healthy mango. By calculating parameters using GLCM algorithm we made training database of 50 samples
and determine average value of parameters i.e. Autocorrelation=39.92, Entropy=1.047, Energy=0.401, Variance=27.29, Contrast=0.1343 etc. By comparing image sent by farmer with the trained database we get detection of healthy mango. We take total 10 samples of healthy parts of mango and out of them 7 samples are perfectly detected for healthy parts of mango.
Fig.15 Features value of healthy leaf
Fig.16 Identification of healthy leaf
©IJRASET: All Rights are Reserved
3726
VI. CONCLUSIONS
The proposed system enables us to detect and recognize diseases affected on mango plant and to provide appropriate preventive care and solution for it. The system makes the detection of diseases easier by complete automation and notification of the affected diseases and remedies are sent to the farmer promptly. This system will increase productivity and improve quality of mango fruit. In given system processing speed of segmentation is 3 seconds and results will be displayed after classification in 0.1 seconds. The overall system will worked in 5 seconds.
VII. ACKNOWLEDGMENT
This project work has been carried out under the direct supervision and leadership of Asso. Prof. Mr. S.S.Veling , Head of Electronics and Telecommunication Engineering Department. We are highly indebted to him for his guidance and constant supervision for providing necessary information regarding the project work. We also offer our humble and sincere thanks to Dr. A.C. Gangal, Principal, S.S.P.M’S College of Engineering, Kankavli for his all possible co-operation. We express our sincere thanks to all staff members of Electronics and Telecommunication Department of S.S.P.M’S College of Engineering, Kankavli for their keen interest and encouragement.
REFERENCES
[1] O. Prakash and A. Misra, “Important diseases of mango and their effect on production,”Biol Memoirs, vol. 18, pp. 39–55, 1992.
[2] K. N. Shukla, A. Potnis, and P. Dwivedy, “A review on image enhancement techniques,” International Journal of Engineering and Applied Computer Science
(IJEACS), vol. 2, no. 7, pp. 232–235, 2017.
[3] T. Lei, X. Jia, Y. Zhang, L. He, H. Meng, and A. K. Nandi, “Significantly fast and robust fuzzy c-means clustering algorithm based on morphological reconstruction and membership filtering,” IEEE Transactions on Fuzzy Systems, vol. 26, no. 5, pp.3027–3041, 2018.
[4] J. M. Patel and N. C. Gamit, “A review on feature extraction techniques in content based image retrieval,” in 2016 International Conference on Wireless Communications, Signal Processing and Networking (WiSPNET). IEEE, 2016, pp. 2259–2263.
[5] R. M. Haralick, K. Shanmugam et al., “Textural features for image classification” IEEE Transactions on systems, man, and cybernetics, no. 6, pp. 610–621,
1973.
[6] Y. Hu, C.-x. Zhao, and H.-n. Wang, “Directional analysis of texture images usinggray level co-occurrence matrix,” in 2008 IEEE Pacific-Asia workshop on
computational intelligence and industrial application, vol. 2. IEEE, 2008, pp. 277–281FLEXChip Signal Processor (MC68175/D), Motorola, 1996.
[7] D. L. Padmaja and B. Vishnuvardhan, “Comparative study of feature subset selection methods for dimensionality reduction on scientific data,” in 2016 IEEE
6th International Conference on Advanced Computing (IACC). IEEE, 2016, pp. 31–34.