Abstract— Asthma is a chronic inflammatory lung disease. Globally Asthma is major public health problem due to its incurable nature and misdiagnosis. In this research paper our work is concerned with the intelligent diagnosis of the severity of the Asthma disease. An automated system has been developed using a self-organizing fuzzy rule-based system. It utilizes the intrinsic ability to deal with the uncertainty and rejects the dealing of add-on mechanisms with imperfect data. Five symptoms have been taken (DSF (Day time symptoms frequency) and NSF (Night time symptoms frequency) PEFR (Peak Expiratory Flow Rate), PEFR variability and SaO2 (Saturation of oxygen) as input and one output for the decision of the asthmatic conditions. For designing of fuzzy inference system rule base play major role in its performance and fine tuning process optimizes the membership functions stored in the data base. The results of the manually constructed inference system was found to be correct when compared with the field data output.
Index Terms— Asthma, Chronic inflammation, Inference system, Fuzzy logic.
I. INTRODUCTION
Asthma is a predisposition to chronic inflammation of the lungs in which the airways (bronchi) are reversibly narrowed [12]. Asthma affects 7% of the population and 300 million worldwide and causes 4,000 deaths a year in the U.S [1, 2, 6]. Asthma is a serious public health problem throughout the world, affecting people of all ages. When uncontrolled, asthma can place severe limits on daily life, and is sometimes fatal [3, 4, 7]. The National Heart, Lung and Blood Institute defines asthma as a common chronic disorder of the airways characterized by variable and
Manuscript received October 26, 2011; revised December 27, 2011. This work was supported in part by the Department of Biotechnology, through its Sub Distributed Informatics Center Raipur, Govt. of India. The authors are profoundly grateful to the anonymous people and especially to the Department of Pulmonary Medicine, Chhatrapati Shahuji Maharaj Medical University, Lucknow (UP), India and “Global Initiative for Asthma” agency
Ashish Patel, National Institute of Technology Raipur, Raipur (C.G.), India. Integral University Lucknow (UP), India. (Phone: +91-7714062385; fax: +91-7714062385 (E-mail: [email protected] ).
Jyotsna Choubey. National Institute of Technology Raipur, Raipur (C.G.), India. E-mail: [email protected] ).
Shailendra K Gupta, I. I. T. R (CSIR), Lucknow (U.P), India. (E-mail:
M. K. Verma, National Institute of Technology Raipur, Raipur (C.G.), India. (E-mail: [email protected] )
Qamar Rahaman, Rostock University, Germany, IITR (CSIR), Lucknow (UP), India. Integral University Lucknow (UP), India. (E-mail:
Rajendra Prasad, Rural Institute of Medical Sciences & Research (E-mail: [email protected]).
recurring symptoms, air flow obstruction, bronchial hyper responsiveness (bronchospasm), and an underlying inflammation. Public attention in the developed world has recently focused on asthma because of its rapidly increasing prevalence, affecting up to one in four urban children [8].
Diagnosis of Asthma beforehand can play a vital role in medical treatment [15]. It is a common knowledge that if a patient with a set of certain symptoms goes to different doctors, he may get different opinions regarding the type or grade of the disease. Also, two different persons with similar symptoms going to the same doctor may be diagnosed differently. This indicates that there is a certain degree of fuzziness in the thinking process of a doctor [5, 16, 17].
Fuzzy logic controller (FLC), a successful application of Zadeh’s fuzzy set theory [18], is a potential tool for dealing with uncertainty and imprecision. Thus, the knowledge of a doctor can be modeled using an FLC. The performance of an FLC depends on its knowledge base which consists of a data base and a rule base. It is observed that the performance of an FLC mainly depends on its rule base, and optimizing the membership function distributions stored in the data base is a fine tuning process [13].
For the construction of expert system knowledge acquisition process is one of the most difficult tasks, because some time unavailability of expert in relevant field makes development of such system impossible [10]. Various problems come across in drawing out knowledge from expert. Although the experts are highly skilled in solving problems in their domain, they often have difficulty in articulating their knowledge or sometimes even in understanding their own decision making processes.
Problems with manual knowledge acquisition have directed efforts towards automation of the process. As a result of these numbers of automated knowledge acquisition methods have been developed.
Alternative knowledge acquisition approaches based fuzzy logic has recently attracted considerable attention [9]. The advantage of this method over other approaches is that it can produce good results in situations where data is imprecise, noisy and inconsistent.
Evaluation of imperfect data does not require add-on mechanism as this approach has its inbuilt ability to deal with uncertainty. The recent popularity of fuzzy expert systems, in particular fuzzy controllers, has created the need for automation of not only the process of extraction of fuzzy rules but also the process of generating the parameters of the associated fuzzy sets.
II. METHODOLOGY Collection of Data
All the data related to the symptoms and diagnosis of
Decision Support System for the Diagnosis of
Asthma Severity Using Fuzzy Logic
Asthma was taken from the Department of Pulmonary Medicine, Chhatrapati Shahuji Maharaj Medical University, Lucknow (UP), India and “Global Initiative for Asthma” agency (http://www.ginasthma.org).
Designing of Fuzzy Inference System
The five symptoms which are relevant and mostly used for the diagnosis of asthma are:
1. Peak Expiratory Flow Rate (PEFR) 2. Daytime Symptom Frequency (DSF) 3. Nighttime Symptom Frequency (NSF)
4. Peak Expiratory Flow Rate Variability (PEFR Variability)
5. Oxygen Saturation (SaO2)
These five symptoms were used as an input in fuzzy inference system. Based on these symptoms severity of Asthma was predicted as an output.
Algorithm for the Fuzzy Inference System for Diagnosis of Asthma Severity
[image:2.595.312.556.70.239.2] [image:2.595.320.553.273.447.2]For the five symptoms five input variables and one output variable “Asthma” was created. The input variables (Symptoms) were divided into 4 Membership Functions (except for NSF which was divided into 5 Membership function) based on the frequency (DSF and NSF) or percentage value of the symptoms (PEFR, PEFR variability and SaO2). The output was divided into five Membership Functions. Mainly Trapezium Membership Function and Triangular Membership Function were used. Following tables and figures shows the Membership Function and Membership Function plot for input and output variables [19, 20].
Figure 1: Membership Function Plot for Input Variable PEFR
Table 1: Membership Function for Input Variable PEFR
Figure 2: Membership Function Plot for Input Variable DSF
Table 2: Membership Function for Input Variable DSF
Figure 3: Membership Function Plot for Input Variable NSF
Table 3: Membership Function for Input Variable NSF
[image:2.595.58.286.453.546.2]Figure 4: Membership Function Plot for Input Variable PEFR Variability
Table 4: Membership Function for Input Variable PEFR Variability
[image:2.595.311.554.488.664.2]Figure 5: Membership Function Plot for Input Variable SaO2
Table 5: Membership Function for Input Variable SaO2
Membership Function Type Parameter
Severely Low (SL) Trapmf [0 0 45 60]
Low (L) Trimf [55 65 80]
Moderate (M) Trimf [75 85 95]
Normal (N) Trapmf [90 95 100 100]
Membership Function Type Parameter
No Trapmf [0 0 1 1]
Low (L) Trimf [1 2 4]
Medium (Me) Trimf [3 10 15]
High (H) Trapmf [12 20 30 30]
Membership Function Type Parameter
No Trapmf [0 0 1 1]
Low (L) Trimf [1 2 3]
Medium (Me) Trimf [2 3 10]
High (H) Trimf [8 15 20]
Very High (VH) Trapmf [15 20 30 30]
Membership Function Type Parameter
No Trapmf [0 0 5 10]
Low (L) Trimf [5 10 20]
Medium (Me) Trimf [15 24 30]
High (H) Trapmf [25 50 100 100]
Membership Function Type Parameter
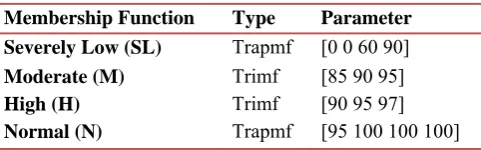
Severely Low (SL) Trapmf [0 0 60 90]
Moderate (M) Trimf [85 90 95]
High (H) Trimf [90 95 97]
[image:2.595.313.554.700.775.2]Figure 6: Membership Function Plot for Output Variable Asthma
Table 6: Membership Function for Output Variable Asthma
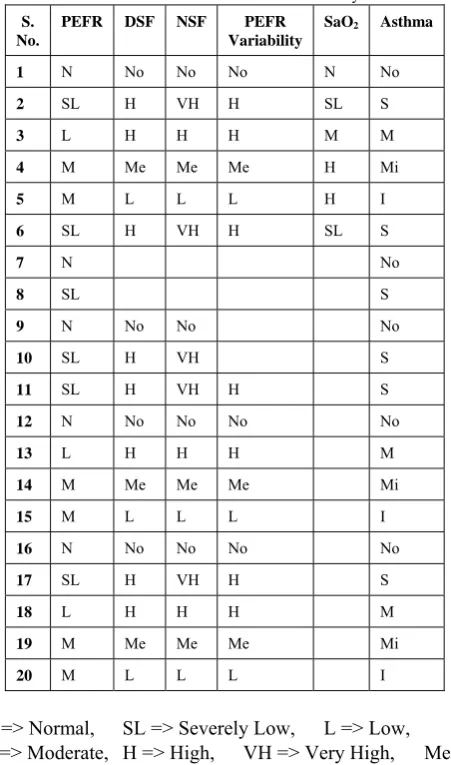
[image:3.595.56.282.378.761.2]On the basis of the input and output variables, 20 rules were constructed by selecting an item in each input and output variable box and one Connection (AND). None was chosen as one of the variable qualities to exclude any of the variables from a given rule. The weight was specified to unity (1). Table 7 shows the rule base for the Asthma inference system.
Table 7: Rule base for Asthma Inference System
S. No.
PEFR DSF NSF PEFR
Variability
SaO2 Asthma
1 N No No No N No
2 SL H VH H SL S
3 L H H H M M
4 M Me Me Me H Mi
5 M L L L H I
6 SL H VH H SL S
7 N No
8 SL S
9 N No No No
10 SL H VH S
11 SL H VH H S
12 N No No No No
13 L H H H M
14 M Me Me Me Mi
15 M L L L I
16 N No No No No
17 SL H VH H S
18 L H H H M
19 M Me Me Me Mi
20 M L L L I
N => Normal, SL => Severely Low, L => Low, M=> Moderate, H => High, VH => Very High, Me => Medium, S => Severe, I => Intermittent Mi => Mild
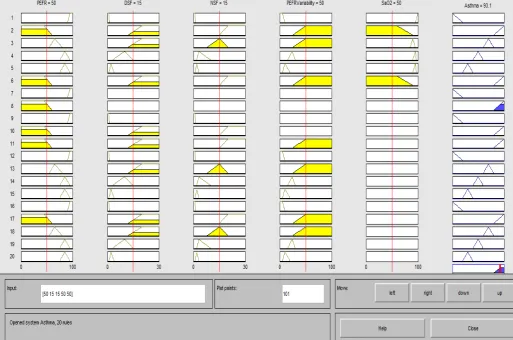
Based on these rules the rule map of the whole fuzzy inference system is shown in figure 7.
There are 121 plots in Figure 7 nested in a single figure window. The six plots across the top of the figure represent the antecedent and consequent of the first rule. Each rule is a row of plots, and each column is a variable. The rule numbers are displayed on the left of each row. The rules can be viewed in the status line by clicking on a rule number. The first five columns of plots (the yellow plots) show the membership functions referenced by the antecedent, or the if-part of each rule. The sixth column of plots (the blue plots) shows the membership functions referenced by the consequent, or the then-part of each rule. The plots which are blank in the if-part of any rule correspond to the characterization of none for the variable in the rule. The last plot in the sixth column of plots represents the aggregate weighted decision for the given inference system. This decision will depend on the input values for the system. The defuzzified output is displayed as a bold vertical line on this plot. The variables and their current values are displayed on top of the columns. In the lower left, there is a text field Input for entering specific input values.
III. RESULTS AND ANALYSIS
Based on the rules the inference system calculated the severity of asthma by following AND connection and then defuzzyfying the generated output using the centroid method. The AND connection was used to perform logical operation (table 8). In fuzzy logic the truth of any statement is matter of degree so the AND connection performed a min operation, i.e. resolved the statement A AND B, where A and B are limited to the range (0, 1) by using the function min (A, B).
Table 8: Logical operation performed by AND Connection in Fuzzy Logic
A B Min (A, B)
0 0 0
0 1 0
1 0 0
1 1 1
The truth table was converted to a plot of two fuzzy sets applied together to create one fuzzy set. Figure 8 displays how the operations work over a continuously varying range of truth values A and B according to the defined fuzzy operations [11].
Figure 8: AND operation over a continuously varying range of truth values A and B
[image:3.595.370.491.664.740.2]Figure 7: Rule Viewer for Asthma Inference System
Table 9: Result of the training set of data
Dat a
PEFR (Percentage)
DSF (Days )
NSF (Days )
PEFR Variability (Percentage)
SaO2
(Percentage)
Asthma Severity (Percentage)
1 90 2 2 10 96 30 (I)
2 95 1 0 5 98 6.33 (No)
3 57 17 16 35 85 80.8 (S)
4 77 7 8 18 88 50 (Mi)
5 77 14 9 29 83 60 (M)
6 55 17 13 30 80 91.8 (S)
7 91 2 1 6 91 8.78 (No)
8 89 2 2 15 93 28.76 (I)
9 75 10 8 22 91 54.6 (Mi)
10 65 20 17 34 88 70 (M)
Defuzzification of the output
As much as fuzziness helps for the rule evaluation during the intermediate steps, the final desired output for each variable is generally a single number. However, the aggregate of a fuzzy set cover a range of output values and defuzzified in order to resolve a single output value from the set [13, 14]. The defuzzification method used the centroid calculation, which returns the centre of area under the curve (figure 9). The defuzzified value was calculated based on the following equation;
[image:4.595.58.572.63.403.2]dCA(C) =
Figure 9: Defuzzification of the aggregate output
Where dCA(C) is the defuzzified value and C is the Membership Function [11].
aggregated and then defuzzified using centroid calculation to generate a single output which was a single number representing the severity of Asthma.
Testing of the Asthma Fuzzy Inference System
The effectiveness of the developed Fuzzy Inference System was tested by providing ten sets of field data. Results of the manually constructed FLC was found to be correct when compared with the field data output .It happened because the rule base of the constructed FLC was designed after a careful study of the effects of deferent inputs on the output i.e. grade of the disease. Based on the output of the FLC which is expressed on a scale of 0-100, decision can be taken on the severity of Asthma for a particular set of input symptoms. Table 9 shows the testing data and the generated output by the Fuzzy Inference System.
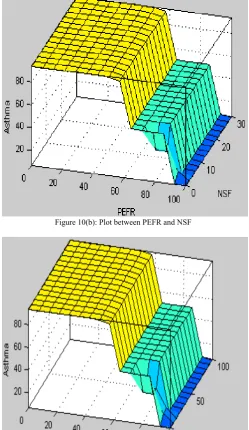
The entire span of the output set based on the entire span of the input set is shown in figure 10.It displays the dependency of one of the output on any one or two of the inputs i.e., it shows the plot of an output surface map for the system based on the rules defined in rule base.
Figure 10 shows the plot for Input Variable DSF, NSF, PEFR Variability, and SaO2 against PEFR. It depicts the dependency of the Output (Asthma) on PEFR and any one of the other Input Variable at a time. In figure 10 (a) when the PEFR is very high (90 to 100) and DSF is low i.e. 0 or 1 day, the output i.e. Asthma severity is No Asthma. As the PEFR is decreasing and DSF is increasing, the severity of Asthma is also increasing. The slope in the plot shows the same situation.
Same thing is shown in the plot between PEFR and NSF (Figure 10 (b)) and between PEFR and PEFR Variability (Figure 10 (c)).
Figure 10 (d) shows the surface viewer plot between PEFR and SaO2. In this plot the slope is steeper than rest of the plot and the severity is increasing continuously with the slight decrease in PEFR or SaO2.
Figure 10(a): Plot between PEFR and DSF
Figure 10(b): Plot between PEFR and NSF
Figure 10(c): Plot between PEFR and PEFR Variability
[image:5.595.192.546.38.798.2] [image:5.595.303.553.67.498.2] [image:5.595.44.556.495.770.2]IV CONCLUSION
This work was undertaken with the aim to design a system for the diagnosis of Asthma severity using Fuzzy Logic, so that common people who suspects little bit of Asthma may use this system and get the result on the severity of Asthma, which will be helpful to guide him to take proper curative measures before the severity increases. The results obtained from the systems reveal that the diagnostic system for Asthma is giving expected results. The efficacy of the system developed is to be endorsed by the doctors in the field observation. Hence, afterwards the system can be made open to all through Internet. With the consultation of the doctors, the curative measures suggested by them can be made available with the system.
REFERENCES
[1] Barnes,P.J., Chung,K.F. and Page,C.P. (1998). “Inflammatory mediators of asthma: an update”.Pharmacol Rev. 50: 515-596.
[2] Bousquet,J., Jeffery,P.K., Busse,W.W., Johnson,M. and Vignola,A.M. (2000). “Asthma: From bronchoconstriction to airways inflammation and remodeling”. Am J. RespirCrit Care Med. 16: 1720-1745.
[3] Bouzigon,E., Corda,E. and Aschard,H. (2008). “Effect of 17q21 Variants and Smoking Exposure in Early-Onset Asthma”.The New England journal of medicine.359: 85- 99.
[4] Chen,E. and Miller,G.E. (2007). “Stress and inflammation in exacerbations of asthma”. Brain Behav Immun. 21: 67-75.
[5] deShazo,R.D. and Stupko,J.E. (2008). “Diagnosing asthma in seniors: An algorithmic approach”.Journal of Respiratory Diseases.43: 77-90.
[6] Gold,D.R. and Wright,R. (2005). “Population disparities in asthma”.Annu Rev Public Health.26: 89-113.
[7] Hargreave,F.E. and Parameswaran,K. (2006). “Asthma, COPD and bronchitis are just components of airway disease”. European Respiratory Journal.28: 264-267. [8] Lilly,C.M. (2005). “Diversity of asthma: evolving
concepts of pathophysiology and lessons from genetics”. J. Allergy Clin. Immunol.115 (4 Suppl): 526-531.
[9] Linkens,D.A. and Nyongesa,H.O. (1996). “Learning systems in intelligent control: an appraisal of fuzzy, neural and genetic algorithm control applications”. IEEProc.Control Theory Appl.143: 367-386.
[10]Mamdani, E. H. and S. Assilian, (1975). “An experiment in linguistic synthesis with a fuzzy logic controller”, International Journal of Man-Machine Studies.7: 1- 13.
[11]Novák,V., Perfilieva,I. and Močkoř,J. (1999). “Mathematical principles of fuzzy logic” Dodrecht: Kluwer Academic. 45-50.
[12]Pinnock,H. and Shah,R. (2007). “Asthma”.BMJ.334: 847-850.
[13]Pratihar,D.K., Deb,K. and Ghosh,A. (1999). “A genetic-fuzzy approach for mobile robot navigation among moving obstacles”.Int. J. Approx. Reason.20: 145-172.
[14]Roychowdhury,A., Pratihar,D.K., Bose,N., Sankaranarayanan,K.P. and Sudhahar,N. (2004). “Diagnosis of the diseases – using GA fuzzy approach”.Information Sciences.162: 105-120.
[15]Thavagnanam,S., Fleming,J., Bromley,A., Shields,M.D. and Cardwell,C.R. (2007). “A meta-analysis of the association between Caesarean section and childhood asthma”. Clin.And Exper.Allergy online ahead of print.629: 44-56.
[16]Tippets,B. and Guilbert,T.W. (2009). “Managing Asthma in Children: Part 1: Making the Diagnosis, Assessing Severity”. Consultant for Pediatricians.8: 89-97.
[17]Yawn,B.P. (2008). “Factors accounting for asthma variability: achieving optimal symptom control for individual patients”. Primary Care Respiratory Journal. 17: 138-147.
[18]Zadeh,L.A. (1965). “Fuzzy sets”. Inform. Contr. 8: 338-353.
[19]Zadeh,L.A. (1973). “Outline of a new approach to the analysis of complex systems and decision processes”. IEEE Transactionson Systems, Man and Cybernetics.3: 28-44.
[20] Zadeh,L.A. (1996). “Fuzzy Sets, Fuzzy Logic, Fuzzy Systems”. World Scientific Press. 57-68.
Ashish Patel