Original citation:
Vermeulen, Marian J., Stukel, Therese A., Guttmann, Astrid, Rowe, Brian H.,
Zwarenstein, Merrick, Golden, Brian, Nigam, Amit, Anderson, Geoff, Bell, Robert S. and
Schull, Michael J.. (2014) Evaluation of an emergency department lean process
improvement program to reduce length of stay. Annals of Emergency Medicine, 64 (5).
pp. 427-438.
Permanent WRAP url:
http://wrap.warwick.ac.uk/74572
Copyright and reuse:
The Warwick Research Archive Portal (WRAP) makes this work of researchers of the
University of Warwick available open access under the following conditions.
This article is made available under the Creative Commons
Attribution-NonCommercial-NoDerivatives 4.0 (CC BY-NC-ND 4.0) and may be reused according to the conditions of
the license. For more details see:
http://creativecommons.org/licenses/by-nc-nd/4.0/
A note on versions:
The version presented in WRAP is the published version, or, version of record, and may
be cited as it appears here.
Evaluation of an Emergency Department Lean Process
Improvement Program to Reduce Length of Stay
Marian J. Vermeulen, MHSc*; Therese A. Stukel, PhD; Astrid Guttmann, MDCM, MSc; Brian H. Rowe, MD, MSc; Merrick Zwarenstein, MBBCh, PhD; Brian Golden, PhD; Amit Nigam, PhD; Geoff Anderson, MD, PhD;
Robert S. Bell, MDCM, MSc; Michael J. Schull, MD, MSc; for the ED Investigator Team†
*Corresponding Author. E-mail:[email protected].
Study objective:In recent years, lean principles have been applied to improve wait times in the emergency department (ED). In 2009, an ED process improvement program based on lean methods was introduced in Ontario as part of a broad strategy to reduce ED length of stay and improve patientflow. This study seeks to determine the effect of this program on ED wait times and quality of care.
Methods:We conducted a retrospective cohort study of all ED visits at program and control sites during 3 program waves from April 1, 2007, to June 30, 2011, in Ontario, Canada. Time series analyses of outcomes before and after the program and difference-in-differences analyses comparing changes in program sites with control sites were conducted.
Results:In before-after models among program sites alone, 90th percentile ED length of stay did not change in wave 1 (–14 minutes [95% confidence interval {CI}–47 to 20]) but decreased after wave 2 (–87 [95% CI–108 to–66]) and wave 3 (–33 [95% CI–50 to–17]); median ED length of stay decreased after wave 1 (–18 [95% CI–24 to–12]), wave 2 (–23 [95% CI–27 to–19]), and wave 3 (–15 [95% CI–18 to–12]). In all waves, decreases were observed in time to physician assessment, left-without-being-seen rates, and 72-hour ED revisit rates. In the difference-in-difference models, in which changes in program sites were compared with controls, the program was associated with no change in 90th percentile ED length of stay in wave 2 (17 [95% CI–0.2 to 33]) and increases in wave 1 (23 [95% CI 0.9 to 45]) and wave 3 (31 [95% CI 10 to 51]), modest reductions in median ED length of stay in waves 2 and 3 alone, and a decrease in time to physician assessment in wave 3 alone.
Conclusion:Although the program reduced ED waiting times, it appeared that its benefits were diminished or disappeared when compared with that of control sites, which were exposed to system-wide initiatives such as public reporting and pay for performance. This study suggests that further evaluation of the effectiveness of lean methods in the ED is warranted before widespread implementation. [Ann Emerg Med. 2014;64:427-438.]
Please see page 428 for the Editor’s Capsule Summary of this article.
Afeedbacksurvey is available with each research article published on the Web atwww.annemergmed.com. Apodcastfor this article is available atwww.annemergmed.com.
0196-0644
Copyright © 2014 by the American College of Emergency Physicians.
http://dx.doi.org/10.1016/j.annemergmed.2014.06.007
INTRODUCTION
Background and Importance
During the past decade, prolonged waiting times in the emergency department (ED) have been recognized as a major barrier to timely and accessible emergency care.1-3Crowding and delays in the ED have been associated with a greater risk of adverse outcomes for patients, including mortality among admitted patients4and both death and subsequent hospital admission for discharged patients.5As a result, policies to address waiting times in the ED have been pursued in many jurisdictions.2,6,7
Lean principles are increasingly being applied as part of efforts to improve quality in health care settings,8including the ED.9
Lean was developed more than 50 years ago by the car maker Toyota to streamline manufacturing processes, primarily through the elimination of waste in work processes.8,10Despite its rapid adoption, rigorous studies to evaluate lean approaches in the ED are lacking. In particular, although many studies report improvements in waiting times before and after lean-type interventions,9,11none are randomized and none compare changes in performance with concurrent comparison sites. It is thus unclear whether improvements can be attributed to these interventions, nor do we know what could be achieved with other methods for which there is some evidence of effect, such as public reporting and performance incentives.12
In 2006, a report commissioned by the Ontario government proposed numerous strategies to reduce ED crowding.13In †All members are listed in theAppendix.
Editor’s Capsule Summary
What is already known on this topic
Lean principles have been demonstrated to increase
manufacturing ef
fi
ciency in industry and are being
applied in health care.
What question this study addressed
Can an emergency department (ED) process
improvement program based on lean principles
improve ED ef
fi
ciency?
What this study adds to our knowledge
The lean intervention was not associated with a
marginal decrease in ED length of stay compared
with broader system-wide interventions.
How this is relevant to clinical practice
New methods of improving ef
fi
ciency in the ED are
needed, but each must be objectively evaluated to
determine it produces the desired results.
October 2007, the government announced that it planned to address the province’s increasing ED waiting times,14
and in April 2008 Ontario’s Emergency Department Wait Time Strategy was announced.15During the next year, various components of the strategy were announced, including provincial ED wait time targets,16public reporting of ED wait times,16a hospital pay-for-results program (which provided certain hospitals with financial incentives if they met individual ED length-of-stay performance improvement targets in a givenfiscal year), and initiatives aimed at easing ambulance offload delays and improving access to care in the community.17In 2009, the ED process improvement program was introduced by the Ministry of Health and Long-Term Care, with the objective of reducing ED length of stay.18The timing of various components of the Wait Time Strategy is illustrated in Figure 1.
Goals of This Investigation
Our comprehensive evaluation of the Ontario ED process improvement program is thefirst controlled large-scale evaluation of such an intervention, to our knowledge. It was developed in collaboration with the Improvement and Compliance Branch, Health System Performance and Accountability Division at the Ontario Ministry of Health and Long-Term Care, health system decisionmakers, and researchers at the Institute for Clinical Evaluative Sciences. As one aspect of the evaluation, this study aimed to determine for each of thefirst 3 implementation periods (waves 1 to 3) the effect and sustainability of the ED process improvement program in reducing ED length of stay, and time to physician initial assessment in the 6 months after the
implementation period. We also sought to determine whether there were unintended consequences in terms of changes in quality care.
MATERIALS AND METHODS
Study Design and Setting
We conducted a retrospective cohort study of all unscheduled ED visits at process improvement program and control sites from April 1, 2007, to June 30, 2011, in Ontario, Canada (population 12 million).
Selection of Participants
The original sample comprised a total of 89 of the 162 EDs in the province, each of which was eligible for the process improvement program. Sites volunteered and were selected by the Ministry of Health and Long-Term Care to participate in the program in each wave according to assessment of their readiness as shown in the expression of interest document submitted by each site.
Among the EDs that did not participate in the program, 7 sites were excluded as potential controls because they had received similar interventions in the 2 years before the official launch of the program as pilot sites for program development. We also excluded 8 sites with low annual ED volumes (<20,000) from among prospective control sites because they were quite different from program participants and lower-volume sites tend to have significantly shorter wait times. Two pediatric hospitals were excluded from among program and prospective control sites because their population differed from that of the other hospitals within the study. From those remaining, the control sites for each wave were frequency-matched according to having a median ED length of stay during the 2 years before ED process improvement program implementation within 0.5 hours of the median ED length of stay of the ED process improvement program sites in that wave. Because the evaluation period for any given wave overlapped with that of subsequent waves, we excluded previous or subsequent wave program participants as prospective controls.
Interventions
The Ontario ED process improvement program was launched at the end of March 2009, with 5 hospitals in a single health region as thefirst wave. The second (beginning in November 2009) and third (May 2010) waves comprised 16 and 15 hospitals, respectively, from across Ontario. The program used a lean improvement approach modeled on pilot programs in several Ontario hospitals. Dedicated hospital improvement teams composed of senior leaders, managers, and staff from a variety of departments within participating hospitals identified improvement opportunities in patientflow from arrival in the ED to discharge from inpatient units. The implementation period was 7 months and included diagnostic, solution design, pilot and control, and rollout phases. The program provided one external lean coach to train and mentor improvement teams at each hospital, on-site support from lean management experts, training on the program methodology and tools for
program. Thus, in the second and third waves, to be eligible for the process improvement program, sites had to be participants in the pay-for-results program, which providedfinancial incentives to hospitals to improve ED waiting times (though not all hospitals in the pay-for-results program became process improvement program sites). The Ministry of Health and Long-Term Care implementation plan was reviewed after each wave, and there were some modifications to the intervention delivery framework and training segments in subsequent waves. In addition, the external lean experts varied from wave to wave.
Methods of Measurement
ED visits were identified through the National Ambulatory Care Reporting System19-21and hospital admissions through the Discharge Abstract Database,22both of which are collected through the Canadian Institute for Health Information. Deaths were identified from the Registered Persons Database, a population-based registry of all legal residents in Ontario.23 Neighborhood income and community type were derived from Statistics Canada 2006 census estimates.
Outcome Measures
The primary outcomes analyzed were 90th percentile and median ED length of stay, 90th percentile and median time to physician, and percentage of admitted and nonadmitted patients
missing provincial ED length-of-stay targets. The Ministry of Health and Long-Term Care had identified 90th percentile ED length of stay as the main measure of improvement targeted through the program. ED length of stay was calculated as the time from triage or registration (whichever was earlier) to the time the patient left the ED. Time to physician was calculated as the time from triage or registration to the time of initial physician assessment. The provincial ED length-of-stay targets were less than or equal to 8 hours for admitted patients and higher-acuity (Canadian Triage and Acuity Scale24levels 1, 2, or 3)
nonadmitted patients, and less than or equal to 4 hours for nonadmitted patients triaged as lower acuity (Canadian Triage and Acuity Scale level 4 or 5). Secondary outcomes represented potential unintended consequences of the program with respect to quality-of-care measures, including left-without-being-seen rate, admission rate, short-term (<48 hours) admission rate, 7- and 30-day mortality, 30-day readmission rate among patients who were admitted from their index ED visit, and 72-hour ED revisit rate among patients who were discharged from their index ED visit.
Primary Data Analysis
[image:4.585.46.542.55.376.2]Because of changes in site selection methods, program design, and implementation over time, separate analyses were conducted for each wave. We compared crude baseline characteristics of ED
process improvement program and control sites during the period before implementation of the program (starting from April 2007) with respect to ED length of stay, physician initial assessment, ED volume, teaching hospital status, admission rates, and percentage of resuscitation or emergent patients (Canadian Triage and Acuity Scale level 1 or 2). We also calculated descriptive statistics of outcomes during the period before implementation as a baseline for comparison with model results.
Data were collapsed into ED, week, age/sex group, and Canadian Triage and Acuity Scale group (high [1 to 3] versus low acuity [4 to 5]) strata, and dependent variables were calculated within each stratum. To model the change in ED length of stay and time to physician initial assessment after the implementation of the process improvement program, we used generalized least squares for serially correlated continuous data,25applying an autoregressive lag 1 (AR1) correlation structure, weighting by stratum population. To model the change in the number of patients meeting ED length-of-stay targets and unintended consequences, we used generalized estimating equations26,27Poisson models for serially correlated count data, applying an AR1 correlation structure, with the logarithm of the stratum population as the offset parameter. Because patients admitted to the same ED have correlated outcomes, we clustered by ED to adjust the standard errors. Separate regression models were used for each outcome.
Initial models were restricted to process improvement program sites to establish changes in outcomes among participating EDs before and after the program. We compared the 6-month period after the intervention to the period from April 2007 to the start of each wave. Thus, the preintervention period was longer in subsequent waves. For the primary analysis, we compared the difference in each outcome pre- versus postimplementation among program sites with the difference among control sites (difference in differences).28
Each model controlled for age/sex group, acuity (high versus low), individual ED, hospital teaching status (teaching versus other), and annual ED volume. We included a variable for annual participation in the Ministry of Health and Long-Term Care pay-for-results program. In addition, we controlled for whether the ED participated in an alternative funding arrangement plan through the Ministry of Health; the
arrangement is a model of physician payment generally based on an hourly rate rather than fee for service. Because both program and control sites may have participated in other lean-type interventions during the study, we determined which hospitals had done so for each month of the study period and controlled for this in the models. The monthly assessment of other lean-type interventions from 2007 to 2010 was determined by a survey of all ED PIP sites and controls (response rate of 100% during the
first 2 waves); the survey did not extend to 2011 and therefore data were not available for the wave 3 follow-up period.
Models included a preprogram linear trend variable to account for any trends in outcomes before the introduction of the process improvement program. Seasonal cyclicalfluctuations were modeled with indicator variables for the 12 calendar months, separately for preprogram and postprogram periods. In
the before-after models, the predicted rate for a specific calendar month postprogram was computed as the adjusted rate for the corresponding preprogram month, incorporating the linear trend. The absolute change in ED length of stay and time to initial physician assessment and the relative change in patients meeting ED length-of-stay targets and rates of unintended consequences pre- versus postprogram were obtained as the linear combination of regression parameters corresponding to the difference in observed and predicted postprogram monthly terms.29In the difference-in-differences models, separate pre-and postprogram calendar month variables were included for program and control sites, allowing us to use this method to compare the difference in pre-post outcomes among program sites with the difference among control sites.
The descriptive analyses for this article were generated with SAS software (version 9.3; SAS Institute, Inc., Cary, NC) of the SAS System for Unix.30We used Stata MP (version 12.1; StataCorp, College Station, TX) for Unix for the multivariable models.31
Research ethics board approval was obtained from Sunnybrook Health Sciences Centre.
RESULTS
Characteristics of Study Subjects
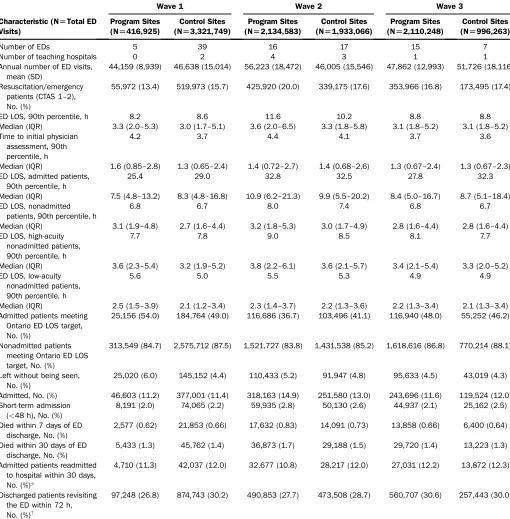
There were 5 program sites and 39 controls in wave 1, 16 program sites and 17 controls in wave 2, and 15 program sites and 7 controls in wave 3.Table 1shows the baseline
characteristics of program sites and controls. Program and control sites were similar in terms of baseline ED length of stay and in most other respects, with the exception of teaching hospital status in wave 1 (there were no teaching hospitals among program sites) and average annual ED volume in waves 2 and 3 (program sites tended to have higher volumes in wave 2, with the opposite in wave 3).
Main Results
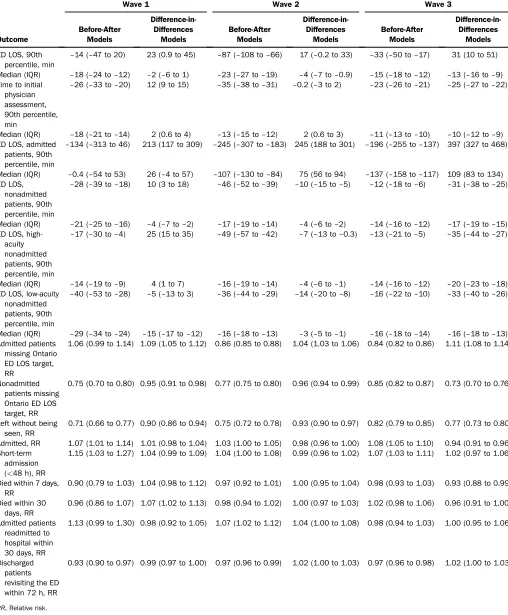
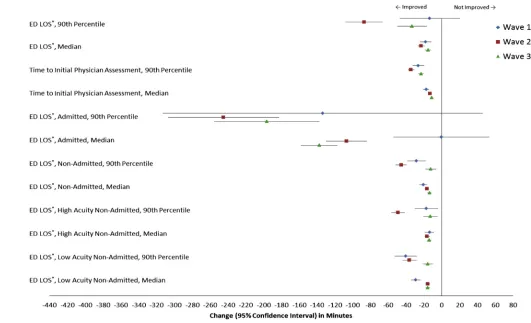
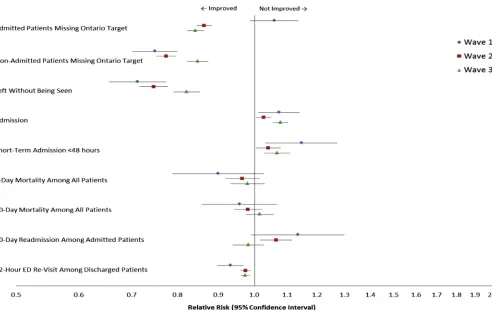
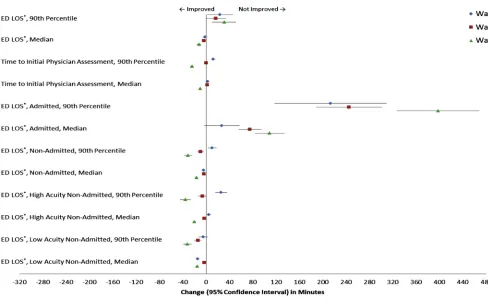
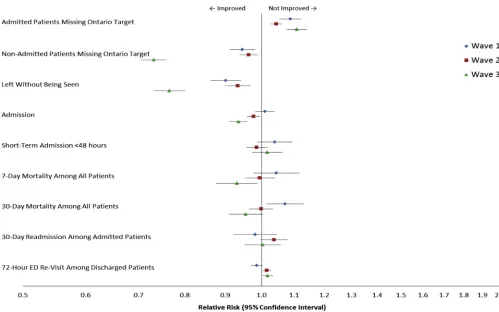
The model results are shown inTable 2. In the initial models (Figures 2 and 3), we examined the differences in outcomes before and after the process improvement program among program sites alone. Both 90th percentile and median ED length of stay and time to physician assessment were significantly lower after the program, with the exception of the 90th percentile ED length of stay among wave 1 sites. ED length of stay decreased among admitted patients for waves 2 and 3 sites and among nonadmitted patients for all waves. The rate of patients missing ED length-of-stay targets was lower for admitted patients in waves 2 and 3 and nonadmitted patients in all waves. There were no unintended consequences of the program with respect to short-term admission, mortality, and readmission; overall, fewer patients left without being seen and 72-hour ED revisit rates were lower after the program. Admission rates, including short-term admission rates, were slightly higher.
process improvement program was associated with increases in 90th percentile ED length of stay in waves 1 and 3 and modest reductions in median ED length of stay in waves 2 and 3. Among admitted patients, however, ED length of stay increased among
[image:6.585.37.547.85.604.2]program sites compared with control sites. There were decreases in ED length of stay among nonadmitted patients, particularly low-acuity patients, at the 90th percentile in waves 2 and 3 and at the median in all waves; reductions among high-acuity nonadmitted
Table 1. Baseline characteristics of process improvement program and control sites in the period before program implementation (starting from April 2007).
Characteristic (N[Total ED Visits)
Wave 1 Wave 2 Wave 3
Program Sites (N[416,925)
Control Sites (N[3,321,749)
Program Sites (N[2,134,583)
Control Sites (N[1,933,066)
Program Sites (N[2,110,248)
Control Sites (N[996,263)
Number of EDs 5 39 16 17 15 7
Number of teaching hospitals 0 2 4 3 1 1
Annual number of ED visits, mean (SD)
44,159 (8,939) 46,638 (15,014) 56,223 (18,472) 46,005 (15,546) 47,862 (12,993) 51,726 (18,116)
Resuscitation/emergency patients (CTAS 1–2), No. (%)
55,972 (13.4) 519,973 (15.7) 425,920 (20.0) 339,175 (17.6) 353,966 (16.8) 173,495 (17.4)
ED LOS, 90th percentile, h 8.2 8.6 11.6 10.2 8.8 8.8
Median (IQR) 3.3 (2.0–5.3) 3.0 (1.7–5.1) 3.6 (2.0–6.5) 3.3 (1.8–5.8) 3.1 (1.8–5.2) 3.1 (1.8–5.2) Time to initial physician
assessment, 90th percentile, h
4.2 3.7 4.4 4.1 3.7 3.6
Median (IQR) 1.6 (0.85–2.8) 1.3 (0.65–2.4) 1.4 (0.72–2.7) 1.4 (0.68–2.6) 1.3 (0.67–2.4) 1.3 (0.67–2.3) ED LOS, admitted patients,
90th percentile, h
25.4 29.0 32.8 32.5 27.8 32.3
Median (IQR) 7.5 (4.8–13.2) 8.3 (4.8–16.8) 10.9 (6.2–21.3) 9.9 (5.5–20.2) 8.4 (5.0–16.7) 8.7 (5.1–18.4) ED LOS, nonadmitted
patients, 90th percentile, h
6.8 6.7 8.0 7.4 6.8 6.7
Median (IQR) 3.1 (1.9–4.8) 2.7 (1.6–4.4) 3.2 (1.8–5.3) 3.0 (1.7–4.9) 2.8 (1.6–4.4) 2.8 (1.6–4.4) ED LOS, high-acuity
nonadmitted patients, 90th percentile, h
7.7 7.8 9.0 8.5 8.1 7.7
Median (IQR) 3.6 (2.3–5.4) 3.2 (1.9–5.2) 3.8 (2.2–6.1) 3.6 (2.1–5.7) 3.4 (2.1–5.4) 3.3 (2.0–5.2) ED LOS, low-acuity
nonadmitted patients, 90th percentile, h
5.6 5.0 5.5 5.3 4.9 4.9
Median (IQR) 2.5 (1.5–3.9) 2.1 (1.2–3.4) 2.3 (1.4–3.7) 2.2 (1.3–3.6) 2.2 (1.3–3.4) 2.1 (1.3–3.4) Admitted patients meeting
Ontario ED LOS target, No. (%)
25,156 (54.0) 184,764 (49.0) 116,686 (36.7) 103,496 (41.1) 116,940 (48.0) 55,252 (46.2)
Nonadmitted patients meeting Ontario ED LOS target, No. (%)
313,549 (84.7) 2,575,712 (87.5) 1,521,727 (83.8) 1,431,538 (85.2) 1,618,616 (86.8) 770,214 (88.1)
Left without being seen, No. (%)
25,020 (6.0) 145,152 (4.4) 110,433 (5.2) 91,947 (4.8) 95,633 (4.5) 43,019 (4.3)
Admitted, No. (%) 46,603 (11.2) 377,001 (11.4) 318,163 (14.9) 251,580 (13.0) 243,696 (11.6) 119,524 (12.0) Short-term admission
(<48 h), No. (%)
8,191 (2.0) 74,065 (2.2) 59,935 (2.8) 50,130 (2.6) 44,937 (2.1) 25,162 (2.5)
Died within 7 days of ED discharge, No. (%)
2,577 (0.62) 21,853 (0.66) 17,632 (0.83) 14,091 (0.73) 13,858 (0.66) 6,400 (0.64)
Died within 30 days of ED discharge, No. (%)
5,433 (1.3) 45,762 (1.4) 36,873 (1.7) 29,188 (1.5) 29,720 (1.4) 13,223 (1.3)
Admitted patients readmitted to hospital within 30 days, No. (%)*
4,710 (11.3) 42,037 (12.0) 32,677 (10.8) 28,217 (12.0) 27,031 (12.2) 13,872 (12.3)
Discharged patients revisiting the ED within 72 h, No. (%)†
97,248 (26.8) 874,743 (30.2) 490,853 (27.7) 473,508 (28.7) 560,707 (30.6) 257,443 (30.0)
CTAS, Canadian Triage and Acuity Scale;IQR, interquartile range;LOS, length of stay.
*Wave 1: N¼41,755 in program sites and N¼350,480 in control sites; wave 2: N¼301,339 in program sites and N¼234,854 in control sites; wave 3: N¼222,020 in program sites and N¼112,478 in control sites.
†Wave 1: N¼363,008 in program sites and N¼2,892,073 in control sites; wave 2: N¼1,770,319 in program sites and N¼1,650,434 in control sites; wave 3: N¼1,833,816 in
Table 2. Change in outcomes before and after a process improvement program among program sites (before-after models) and the change among program sites compared with the change among control sites (difference-in-differences models).
Outcome
Wave 1 Wave 2 Wave 3
Before-After Models
Difference-in-Differences
Models
Before-After Models
Difference-in-Differences
Models
Before-After Models
Difference-in-Differences
Models
ED LOS, 90th percentile, min
–14 (–47 to 20) 23 (0.9 to 45) –87 (–108 to–66) 17 (–0.2 to 33) –33 (–50 to–17) 31 (10 to 51)
Median (IQR) –18 (–24 to–12) –2 (–6 to 1) –23 (–27 to–19) –4 (–7 to–0.9) –15 (–18 to–12) –13 (–16 to–9) Time to initial
physician assessment, 90th percentile, min
–26 (–33 to–20) 12 (9 to 15) –35 (–38 to–31) –0.2 (–3 to 2) –23 (–26 to–21) –25 (–27 to–22)
Median (IQR) –18 (–21 to–14) 2 (0.6 to 4) –13 (–15 to–12) 2 (0.6 to 3) –11 (–13 to–10) –10 (–12 to–9) ED LOS, admitted
patients, 90th percentile, min
–134 (–313 to 46) 213 (117 to 309) –245 (–307 to–183) 245 (188 to 301) –196 (–255 to–137) 397 (327 to 468)
Median (IQR) –0.4 (–54 to 53) 26 (–4 to 57) –107 (–130 to–84) 75 (56 to 94) –137 (–158 to–117) 109 (83 to 134) ED LOS,
nonadmitted patients, 90th percentile, min
–28 (–39 to–18) 10 (3 to 18) –46 (–52 to–39) –10 (–15 to–5) –12 (–18 to–6) –31 (–38 to–25)
Median (IQR) –21 (–25 to–16) –4 (–7 to–2) –17 (–19 to–14) –4 (–6 to–2) –14 (–16 to–12) –17 (–19 to–15) ED LOS,
high-acuity nonadmitted patients, 90th percentile, min
–17 (–30 to–4) 25 (15 to 35) –49 (–57 to–42) –7 (–13 to–0.3) –13 (–21 to–5) –35 (–44 to–27)
Median (IQR) –14 (–19 to–9) 4 (1 to 7) –16 (–19 to–14) –4 (–6 to–1) –14 (–16 to–12) –20 (–23 to–18) ED LOS, low-acuity
nonadmitted patients, 90th percentile, min
–40 (–53 to–28) –5 (–13 to 3) –36 (–44 to–29) –14 (–20 to–8) –16 (–22 to–10) –33 (–40 to–26)
Median (IQR) –29 (–34 to–24) –15 (–17 to–12) –16 (–18 to–13) –3 (–5 to–1) –16 (–18 to–14) –16 (–18 to–13) Admitted patients
missing Ontario ED LOS target, RR
1.06 (0.99 to 1.14) 1.09 (1.05 to 1.12) 0.86 (0.85 to 0.88) 1.04 (1.03 to 1.06) 0.84 (0.82 to 0.86) 1.11 (1.08 to 1.14)
Nonadmitted patients missing Ontario ED LOS target, RR
0.75 (0.70 to 0.80) 0.95 (0.91 to 0.98) 0.77 (0.75 to 0.80) 0.96 (0.94 to 0.99) 0.85 (0.82 to 0.87) 0.73 (0.70 to 0.76)
Left without being seen, RR
0.71 (0.66 to 0.77) 0.90 (0.86 to 0.94) 0.75 (0.72 to 0.78) 0.93 (0.90 to 0.97) 0.82 (0.79 to 0.85) 0.77 (0.73 to 0.80)
Admitted, RR 1.07 (1.01 to 1.14) 1.01 (0.98 to 1.04) 1.03 (1.00 to 1.05) 0.98 (0.96 to 1.00) 1.08 (1.05 to 1.10) 0.94 (0.91 to 0.96) Short-term
admission (<48 h), RR
1.15 (1.03 to 1.27) 1.04 (0.99 to 1.09) 1.04 (1.00 to 1.08) 0.99 (0.96 to 1.02) 1.07 (1.03 to 1.11) 1.02 (0.97 to 1.06)
Died within 7 days, RR
0.90 (0.79 to 1.03) 1.04 (0.98 to 1.12) 0.97 (0.92 to 1.01) 1.00 (0.95 to 1.04) 0.98 (0.93 to 1.03) 0.93 (0.88 to 0.99)
Died within 30 days, RR
0.96 (0.86 to 1.07) 1.07 (1.02 to 1.13) 0.98 (0.94 to 1.02) 1.00 (0.97 to 1.03) 1.02 (0.98 to 1.06) 0.96 (0.91 to 1.00)
Admitted patients readmitted to hospital within 30 days, RR
1.13 (0.99 to 1.30) 0.98 (0.92 to 1.05) 1.07 (1.02 to 1.12) 1.04 (1.00 to 1.08) 0.98 (0.94 to 1.03) 1.00 (0.95 to 1.06)
Discharged patients revisiting the ED within 72 h, RR
0.93 (0.90 to 0.97) 0.99 (0.97 to 1.00) 0.97 (0.96 to 0.99) 1.02 (1.00 to 1.03) 0.97 (0.96 to 0.98) 1.02 (1.00 to 1.03)
patients were less consistent. There were no substantive changes in time to physician assessment except in wave 3. In contrast with the before-after models, the rate of admitted patients missing Ontario ED length-of-stay targets increased significantly among program sites compared with controls; however, there were decreases in nonadmitted patients missing targets. The program was not associated with any unintended consequences, and the rate of patients who left without being seen declined among program sites.
LIMITATIONS
This study had several limitations that warrant mention. Program assignment was not random; sites for each wave were selected by the Ministry of Health according to expressions of interest. As a result, we could not control for unknown confounders, although we did attempt to control for important known confounders that differentially affected program and control sites.
Randomization could have reduced bias because of potential unknown confounders; we recommend that future studies take advantage of this rigor because randomization would have been feasible in this study and would have introduced no extra cost or complexity to the evaluation.32
Because program waves overlapped, there were a limited number of suitable controls available for each wave. Although we
frequency-matched controls with program sites according to ED length of stay, there remained some differences in teaching status and ED volume; however, we did control for these variables in the multivariate models. Because of the overlapping nature of the multiple waves of the process improvement program, as well as the recency of thefinal wave, we were unable to conduct controlled analyses of program sustainability.
Some of the unintended consequences examined in this study may have been too far downstream to reflect problems associated with the program. Our study did not address the effects of the lean program on front-line staff.
Finally, our study focused on a quantitative evaluation of outcomes measured through administrative data and did not take into account specific contextual factors and mechanisms that may have played a role in the success or failure of this complex intervention.33,34Actual implementation of lean initiatives and other factors such as the degree of involvement by management and staff buy-in varies among sites and could not be accounted for in this analysis.35,36
DISCUSSION
[image:8.585.13.544.58.381.2]Among participating hospitals in an ED lean initiative, our uncontrolled before-after analysis revealed improvements in overall length of stay, time to initial physician assessment, and
the percentage of patients meeting wait time targets. However, compared with concurrent controls in our primary analysis, the effects of the lean intervention were attenuated and, for most outcomes, either no longer significantly beneficial or even significantly worse. Thus, it is clear that control sites saw improvements in outcomes that approached or even exceeded those in program sites during the course of the study. In some cases, control sites improved while program sites got worse. This suggests that the lean intervention evaluated here added relatively little to the effect of other changes affecting all study sites.
This may have been due to a number of other system-wide policies that targeted all EDs in the province. First, public reporting, which has been found to have a positive effect on process improvement measures,37,38had been in effect for at least 6 months before thefirst wave of the process improvement program. The launch of public reporting in Ontario was accompanied by the introduction of targets for ED length of stay.16In the United Kingdom, where a 4-hour rule was implemented and targets of 90% and, subsequently, 98% were set, the initial target was associated with a reduction in ED length of stay.39
Second, the Ontario pay-for-results program was implemented in the year before the introduction of the process improvement program, and both program and control sites participated in it during the course of the study. Pay-for-performance initiatives have been associated with improvements in quality-of-care measures, even in the context of public reporting.12
Third, a number of control sites engaged in self-initiated lean-type initiatives during the course of the study period: 49% in wave 1 for an average of 3 months, 41% in wave 2 for an average of 13 months, and 14% in wave 3 for an average of 5 months. Although we controlled for this in our analysis, it is possible that other factors that could not be controlled for, such as the introduction of clinical decision units at some sites,40 played a role in reducing waiting time in the control sites as well. Essentially, the common pressures on all of these hospitals encouraged a wide variety of performance improvement initiatives and these may have contributed to the apparent effect in the before-after analyses, rather than the systematic lean intervention we evaluated.
[image:9.585.47.539.57.367.2]Our results add to those of previous studies, which are scarce and not rigorously designed. These few evaluations have found improvements in the ED length of stay and other outcomes after lean-type interventions,35,41-50but this may be partly due to publication bias because positive evaluations are more likely to be published.51Also, none of the published studies have compared outcomes with comparable controls, most were conducted as a before-after analysis in a single site,41-50and many did not conduct statistical tests of observed differences.35,41,42,49Thus, these previous studies do not provide rigorous evidence for the notion that lean approaches are effective in ED settings. Lean approaches are becoming increasingly popular as EDs attempt to improve quality, efficiency, and patient outcomes,9and some
jurisdictions such as the province of Saskatchewan are
implementing its techniques broadly across the whole health care system.52Consultants are often employed or, more recently, internal staff are trained to conduct lean programs. Despite the interest in the effectiveness of programs, many have not been evaluated. Like any health care intervention, the implementation of lean should be evidence based, with reasonable expectations of benefits, proper evaluation, and an awareness of potential downsides.53,54 Although the specific costs of this particular program were not available, lean initiatives in general are not inexpensive, given need for external consultants, data collection tools, and staff time that must be assigned to quality
improvement teams. Our study suggests that further evaluation of the effectiveness of lean methods in the ED is warranted before widespread implementation on the assumption of effectiveness.
In our before-after analysis, we observed inconsistent effects across different waves of the program, which probably reflected differences in site selection for each wave more than differences in program design. Wave 2 sites, which had the highest ED waiting times at baseline, experienced the greatest improvements in ED length of stay after the process improvement program (and other ED changes described above). It is evident that sites with shorter wait times to begin with had more difficulty attaining significant reductions in overall ED length of stay.
Our data suggest that gains in waiting times may be easier to achieve among nonadmitted patients, particularly those triaged as low acuity. The introduction of targets in the United Kingdom was also associated with a substantial increase in median ED length of stay among admitted patients because more of these patients leave the ED in the last 20 minutes before the target.55Although the lean initiative targeted both the ED and inpatient units, in Ontario, which has the one of the lowest hospital bed per capita levels among the Organization for Economic Co-operation and Development countries,56,57it may have been more challenging to improve wait times for admitted patients. In contrast, improvements in ED length of stay among nonadmitted patients depend primarily on processes and resources within the ED, which were likely to have been moreflexible and amenable to improvement.
Although a number of other studies have suggested that lean-type interventions can reduce time to consult a physician,44,45,47,48,50our study showed little change in time to initial physician assessment associated with the process improvement program, except in wave 3. This may be because the primary focus of the wait times strategy was overall ED length of stay.18In the United Kingdom, where the 4-hour rule was introduced for total time spent in the ED, one study also found that time to consult a physician did not improve.39
[image:10.585.41.529.56.360.2]We did not observe any unintended consequences of the program with respect to admission, short-term admission, mortality,
readmission among admitted patients, or ED revisits among discharged patients. In addition, the process improvement program was associated with a significant reduction in the proportion of patients who left without being seen. A number of other studies have observed reductions in left-without-being-seen rates after lean-type interventions.42,44,48,49Research examining the effects of the 4-hour rule on quality of care, including admissions, mortality, and return visits, also found no adverse effects of these targets.58
Our study highlights the challenges in evaluating interventions in a context in which multiple approaches are being used simultaneously to address health system issues. Although the process improvement program had the effect of reducing ED waiting times, it appears that the benefits of this specific program were relatively modest against the backdrop of public reporting, pay-for-performance initiatives, and an increasing awareness of the need to improve patient flow within hospitals. In some cases, particularly for admitted patients, these other elements of the wait times strategy appeared to provide at least as much benefit as the program itself. These findings demonstrate the value of using rigorous methods to evaluate the true effect of complex health system performance improvement initiatives.
The authors acknowledge the valuable contributions made by Chad Leaver, MSc, in the planning and implementation of the study.
Supervising editor:Brendan G. Carr, MD, MS
Author affiliations:From the Institute for Clinical Evaluative
[image:11.585.40.539.57.369.2]Sciences, Toronto, Ontario, Canada (Vermeulen, Stukel, Guttmann, Anderson, Schull); the Institute for Health Policy, Management and Evaluation (Stukel, Guttmann, Anderson, Schull), the Division of Emergency Medicine, Department of Medicine (Schull), Division of Paediatric and Emergency Medicine, Hospital for Sick Children, Department of Paediatrics (Guttmann), Rotman School of Management (Golden), Department of Family and Community Medicine (Rutledge), and Mechanical and Industrial Engineering (Carter), University of Toronto, Toronto, Ontario, Canada; the Dartmouth Institute for Health Policy and Clinical Practice, Giesel School of Medicine at Dartmouth, Hanover, NH (Stukel); the Department of Emergency Medicine, University of Alberta, Edmonton, Alberta, Canada (Rowe); the Centre for Studies in Family Medicine, Schulich School of Medicine and Dentistry, Western University, London, Ontario, Canada (Zwarenstein); the Emergency Department, Jewish General Hospital, McGill University, Montreal, Quebec, Canada (Afilalo); the North York General Hospital, Toronto, Ontario, Canada (Rutledge); the University Health Network, Toronto, Ontario, Canada (Bell); the Cass Business School, City University, London, UK (Nigam); the Division of Health Sciences, the University of Warwick, Coventry, UK (Cooke); and the Trauma, Emergency and Critical Care Program, Sunnybrook Health Sciences Centre, Toronto, Ontario, Canada (Carew, Schull).
Author contributions:MJV, TAS, AG, and MJS were responsible for the study design. MJV and MJS were responsible for data collection and article preparation. MJV and TAS were responsible for statistical analysis. All authors provided input into the design of the study and interpretation of the results. TAS, AG, BHR, MZ, BG, AN, and GA contributed to the editing of the article. MJV takes responsibility for the paper as a whole.
Funding and support:ByAnnalspolicy, all authors are required to
disclose any and all commercial,financial, and other relationships in any way related to the subject of this article as per ICMJE conflict of interest guidelines (seewww.icmje.org). The authors have stated that no such relationships exist. This study was funded by the Ontario Ministry of Health and Long-Term Care (04601T) and the Canadian Foundation for Healthcare Improvement (RC2-1603-06). Dr. Guttmann is supported by a Canadian Institutes of Health Research Applied Chair in Child Health Policy and Services Research (APR 126377). Dr. Rowe is supported by the CIHR as Tier I Canada Research Chair in Evidence Based Emergency Medicine (950-222864). Dr. Schull is supported by a CIHR Applied Chair in Health Services and Policy Research (200807ACH-190329-52431).
Publication dates:Received for publication August 11, 2013.
Revisions received December 3, 2013, and March 24, 2014. Accepted for publication June 6, 2014. Available online July 3, 2014.
REFERENCES
1. Bond K, Ospina MB, Blitz S, et al. Frequency, determinants and impact of overcrowding in emergency departments in Canada: a national survey.Healthc Q. 2007;10:32-40.
2. Pines JM, Hilton JA, Weber EJ, et al. International perspectives on emergency department crowding.Acad Emerg Med. 2011;18:1358-1370. 3. Pitts SR, Pines JM, Handrigan MT, et al. National trends in emergency department occupancy, 2001 to 2008: effect of inpatient admissions versus emergency department practice intensity.Ann Emerg Med. 2012;60:679-686.
4. Sun BC, Hsia RY, Weiss RE, et al. Effect of emergency department crowding on outcomes of admitted patients.Ann Emerg Med. 2013;61:605-611.
5. Guttmann A, Schull MJ, Vermeulen MJ, et al. Association between waiting times and short term mortality and hospital admission after departure from emergency department: population based cohort study from Ontario, Canada.BMJ. 2011;342:d2983.
6. Alberti KG.Transforming Emergency Care in England. London, England: National Health Service; 2005.
7. McClelland MS, Lazar D, Sears V, et al. The past, present, and future of urgent matters: lessons learned from a decade of emergency departmentflow improvement.Acad Emerg Med. 2011;18:1392-1399. 8. de Souza LB. Trends and approaches in lean healthcare.Leadership
Health Serv. 2009;22:121-139.
9. Holden RJ. Lean thinking in emergency departments: a critical review.
Ann Emerg Med. 2011;57:265-278.
10. Vest JR, Gamm LD. A critical review of the research literature on Six Sigma, lean and StuderGroup’s Hardwiring Excellence in the United States: the need to demonstrate and communicate the effectiveness of transformation strategies in healthcare.Implement Sci. 2009;4:35.
11. Fine BA, Golden B, Hannam R, et al. Leading lean: a Canadian healthcare leader’s guide.Healthc Q. 2009;12:32-41.
12. Lindenauer PK, Remus D, Roman S, et al. Public reporting and pay for performance in hospital quality improvement.N Engl J Med. 2007;356:486-496.
13. Ontario Hospital Association; Ontario Medical Association; Ontario Ministry of Health.Improving Access to Emergency Care: Addressing System Issues. Toronto, Canada: Ontario Ministry of Health and Long-Term Care; 2006.
14. Ontario Ministry of Health and Long-term Care. Reducing emergency room wait times, together. 2007. Available at:http://news.ontario.ca/ opo/en/2007/10/reducing-emergency-room-wait-times-together.html. Accessed June 17, 2013.
15. Ontario Ministry of Health and Long-term Care. McGuinty government reducing ER wait times and improving access to family health care. 2008. Available at:http://news.ontario.ca/mohltc/en/2008/04/ ontario-establishes-two-priorities-to-improve-confidence-in-health-care. html. Accessed June 17, 2013.
16. Ontario Ministry of Health and Long-term Care. McGuinty government launches public reporting of time spent in the ER. 2009. Available at:
http://news.ontario.ca/mohltc/en/2009/02/ontario-targets-shorter-er-times.html. Accessed June 17, 2013.
17. Ontario Ministry of Health and Long-term Care. Ontario tackles ER waits with $109 million investment. 2008. Available at:http://news. ontario.ca/mohltc/en/2008/05/ontario-tackles-er-waits-with-109-million-investment.html. Accessed June 17, 2013.
18. Ontario Ministry of Health and Long-term Care. Ontario’s emergency room wait time strategy. 2009. Available at:http://news.ontario.ca/ mohltc/en/2009/05/ontarios-emergency-room-wait-time-strategy-1. html. Accessed June 17, 2013.
19. Canadian Institute for Health Information.CIHI Data Quality Study of Ontario Emergency Department Visits for 2004-2005: Volume II of IV—Main Study Findings. Ottawa, Canada: CIHI; 2008.
20. Canadian Institute for Health Information.CIHI Data Quality Study of Ontario Emergency Department Visits for 2004-2005: Volume III of IV—Inter-Rater Reliability Study. Ottawa, Canada: CIHI; 2008. 21. Canadian Institute for Health Information.National Ambulatory Care
Reporting System Manual for 2011-2012. Ottawa, Canada: CIHI; 2011. 22. Canadian Institute for Health Information.DAD Abstracting Manual,
2011-2012 Edition. Ottawa, Canada: CIHI; 2011.
23. Iron K, Zagorski BM, Sykora K, et al.Living and Dying in Ontario: An Opportunity for Improved Health Information. Toronto, Canada: ICES; 2008.
24. Bullard MJ, Unger B, Spence J, et al. Revisions to the Canadian Emergency Department Triage and Acuity Scale (CTAS) adult guidelines.CJEM. 2008;10:136-151.
25. Wooldridge JM.Introductory Econometrics: A Modern Approach. 5th ed. Mason, OH: South-Western; 2013.
26. McCullagh P, Nelder JA.Generalized Linear Models. New York, NY: Chapman & Hall; 1989.
27. Zeger SL, Liang KY. Longitudinal data analysis for discrete and continuous outcomes.Biometrics. 1986;42:121-130. 28. Sutton M, Nikolova S, Boaden R, et al. Reduced mortality with
hospital pay for performance in England.N Engl J Med. 2012;367: 1821-1828.
29. Schull MJ, Stukel TA, Vermeulen MJ, et al. Effect of widespread restrictions on the use of hospital services during an outbreak of severe acute respiratory syndrome.CMAJ. 2007;176:1827-1832. 30. SAS Institute Inc.SAS Version 9.3. Cary, NC: SAS Institute Inc.; 2011. 31. Statacorp.Stata Statistical Software: Release 12. College Station, TX:
StataCorp; 2011.
32. Curtis JR, Levy MM. Improving the science and politics of quality improvement.JAMA. 2011;305:406-407.
33. Berwick DM. The science of improvement.JAMA. 2008;299:1182-1184.
34. Greenhalgh T, Humphrey C, Hughes J, et al. How do you modernize a health service? a realist evaluation of whole-scale transformation in London.Milbank Q. 2009;87:391-416.
36. Pines JM, Pilgrim RL, Schneider SM, et al. Practical implications of implementing emergency department crowding interventions: summary of a moderated panel.Acad Emerg Med. 2011;18: 1278-1282.
37. Werner RM, Bradlow ET. Public reporting on hospital process improvements is linked to better patient outcomes.Health Aff (Millwood). 2010;29:1319-1324.
38. Daneman N, Stukel TA, Ma X, et al. Reduction inClostridium difficile
infection rates after mandatory hospital public reporting:findings from a longitudinal cohort study in Canada.PLoS Med. 2012;9: e1001268.
39. Freeman JV, Croft S, Cross S, et al. The impact of the 4 h target on patient care and outcomes in the emergency department: an analysis of hospital incidence data.Emerg Med J. 2010;27: 921-927.
40. Schull MJ, Vermeulen MJ, Stukel TA, et al. Evaluating the effect of clinical decision units on patientflow in seven Canadian emergency departments.Acad Emerg Med. 2012;19:828-836.
41. Alikhan LM, Howard RJ, Bowry R. From a project to transformation: how“going against theflow”led to improved access and patient flow in an academic hospital.Healthc Manage Forum. 2009;22: 20-26.
42. Eller A. Rapid assessment and disposition: applying LEAN in the emergency department.J Healthc Qual. 2009;31:17-22.
43. Ford AL, Williams JA, Spencer M, et al. Reducing door-to-needle times using Toyota’s lean manufacturing principles and value stream analysis.Stroke. 2012;43:3395-3398.
44. Ieraci S, Digiusto E, Sonntag P, et al. Streaming by case complexity: evaluation of a model for emergency department Fast Track.Emerg Med Australas. 2008;20:241-249.
45. Kelly AM, Bryant M, Cox L, et al. Improving emergency department efficiency by patient streaming to outcomes-based teams.Aust Health Rev. 2007;31:16-21.
46. King DL, Ben-Tovim DI, Bassham J. Redesigning emergency department patientflows: application of lean thinking to health care.
Emerg Med Australas. 2006;18:391-397.
47. Mazzocato P, Holden RJ, Brommels M, et al. How does lean work in emergency care? a case study of a lean-inspired intervention at the Astrid Lindgren Children’s Hospital, Stockholm, Sweden.BMC Health Serv Res. 2012;12:28.
48. Murrell KL, Offerman SR, Kauffman MB. Applying lean: implementation of a rapid triage and treatment system.West J Emerg Med. 2011;12: 184-191.
49. Ng D, Vail G, Thomas S, et al. Applying the lean principles of the Toyota production system to reduce wait times in the emergency department.
CJEM. 2010;12:50-57.
50. Piggott Z, Weldon E, Strome T, et al. Application of lean principles to improve early cardiac care in the emergency department.CJEM. 2011;13:325-332.
51. Song F, Parekh S, Hooper L, et al. Dissemination and publication of researchfindings: an updated review of related biases.Health Technol Assess. 2010;14; iii, ix-iii, 193.
52. Saskatchewan Ministry of Health. Saskatchewan’s health care system and lean. 2013. Available at: http://www.health.gov.sk.ca/lean-introduction. Accessed June 17, 2013.
53. Brook RH. The end of the quality improvement movement: long live improving value.JAMA. 2010;304:1831-1832.
54. Vanguard in Health. Does going lean¼going wrong? 2013. Available at: http://vanguardinhealth.blogspot.co.uk/2012/05/does-going-lean-going-wrong.html. Accessed June 24, 2013.
55. Mason S, Weber EJ, Coster J, et al. Time patients spend in the emergency department: England’s 4-hour rule—a case of hitting the target but missing the point?Ann Emerg Med. 2012;59:341-349. 56. OECD. Health data at a glance 2011: OECD indicators. 2011. Available
at:http://www.oecd-ilibrary.org/sites/health_glance-2011-en/04/03/ g4-03-01.html?itemId¼/content/chapter/health_glance-2011-31-en. Accessed June 23, 2014.
57. Ontario Health Coalition. No vacancy: hospital overcrowding in Ontario: impact on patient safety and access to care. 2011. Available at:http:// www.web.net/ohc/hospitalbedsreport.pdf. Accessed June 24, 2014. 58. Weber EJ, Mason S, Freeman JV, et al. Implications of England’s
four-hour target for quality of care and resource use in the emergency department.Ann Emerg Med. 2012;60:699-706.
APPENDIX
The ED Investigator Team includes Marc Afilalo, MD, MCFP(EM), Geoff Anderson, MD, PhD, Robert S. Bell, MDCM, MSc, Debra Carew, Mike Carter, PhD, Matthew Cooke, MB ChB, PhD, Brian Golden, PhD, Astrid Guttmann, MD, MSc, Amit Nigam, PhD, Brian Rowe, MD, MSc, Tim Rutledge, MD, CCFP(EM), Michael Schull, MD, MSc, Therese Stukel, PhD, Marian Vermeulen, MHSc, and Merrick
Zwarenstein, MBBCh, PhD.
Did you know?
Podcasts are available for almost every article inAnnals.