Munich Personal RePEc Archive
Non-Linear Taylor Rule through
Threshold Estimation
Bhaduri, Saumitra and Sethudurai, Raja
Madras School of Economics
8 March 2013
Online at
https://mpra.ub.uni-muenchen.de/44844/
A Note on the Empirical Test of Herding: A Threshold Regression
Approach
Abstract:
The paper applies a threshold regression model developed by Hansen [2000] to standard herding model in order to capture a non-linear effect of extreme market movement on the trading behaviour of the participants. Using the model with threshold effect, the paper finds little evidence for market-wide herding for the Indian equity market.
1. Introduction:
The efficient market hypothesis assumes that investors form rational expectations of
future prices and discount all market information into expected prices. However, these
rationality assumptions underpinning the efficient market hypothesis are often challenged
in reality as the observed stock markets display “herd behaviour” wherein group of
individuals act to imitate the decisions of others or market without paying any attention to
their own belief or information1.
Barring a few exception, most of the empirical models of herding are based on
Christie and Huang (1995) (hereafter referred to as CH) and Chang et al. (2000)
(hereafter referred to as CCK) model which uses the cross sectional standard deviation
(CSSD) and cross sectional absolute standard deviation (CSAD) across stock returns as a
measure of average proximity of individual returns to the realized market return2. CH and
CCK focus their analysis of herding for periods of extreme market movements, as they
argue that traders are more likely to herd at times of heightened uncertainty and extreme
market turbulence.3,4
1
Bhikchandani and Sharma, 1992, Scharfstein and Stein, 1990 and Devenow and Welch, 1996, Chan, Cheng and Khornana 2000, Hwang and Salmon, 2004 and Demirer and Kutan, 2006, Gleason, Mathur and Peterson, 2004, Weiner and Green, 2004 Wermers, 1999.
2
Hwang and Salmon (2004) have used other measure of herding such as cross-sectional dispersion of the factor sensitivity of assets within a given market.
3
Most of the empirical models of herding use the rational asset- pricing model
(CAPM) to arrive at a test for herding under extreme market conditions. These models
postulate that under herding individual returns will converge to the aggregate market
return under extreme condition resulting in decreased dispersion of individual returns
from the market return.
Therefore, empirically, herding is tested during the trading intervals characterized
by large swings in average prices, in which a lower than expected level of cross sectional
variation would indicate herding. Though the theoretical model provides robust
conclusions, most of the empirical models using this approach suffer from the
subjectivity involved in defining the extreme market movements. Therefore, the goal of
this paper is to address this limitation by applying a threshold model which addresses this
issue. The paper applies threshold regression method developed by Hansen [2000] to
standard CSAD regressions to capture a non-linear effect of extreme market movement
on the investor behaviour.
The remainder of the paper is organized as follows: Section two presents the
methodology proposed in the paper to test the herding behaviour in the stock market.
Section 3 describes the data while section 4 reports the empirical results .Section five
concludes the paper.
4
The cross-sectional standard deviation (CSSD) is expressed as:
2 , , 1 ( ) ( 1) N
i t m t i
t
R R CSSD
N
While the cross-sectional absolute deviation is expressed as:
, , 1
1 N
t i t m t
i
CSAD R R N
N is the no. of firms in the portfolio.Ri t, Is the observed stock return of firm i at time t. Rm t, Is the
2. The Empirical model and testing procedure:
Rational asset pricing models and herding behavior propose distinct predictions
regarding the behavior of the cross-sectional standard deviation of returns during periods
of markets stress. Rational asset pricing models predict that during extreme market
movements, large changes in the absolute value of the market return translate into an
increase in dispersion due to the differing sensitivities of individual securities to the
market return. In contrast, the herding behavior suggests that dispersions would reduce in
presence of large market movements. Conventionally, the test for herding, or
alternatively for rational asset pricing, uses the following empirical specification:
t U t U t L t L
t D D
CSSD
where the CSSD is cross-sectional standard deviation at time t, and is defined as
n
i
mt it
t r r
n CSSD 1 2 ) ( 1 1
and DL=1 if the market return on day t lies in the extreme lower tail of the
distribution and zero otherwise; DU=1 if the market return on day t lies in the extreme
upper tail of the return distribution and zero otherwise.
The dummy variables act to capture differences in investor behavior during
extreme up or down versus relatively normal markets. Therefore, the significantly
negative coefficients on dummies would indicate herd behaviour. Typically extreme
market movements are defined arbitrarily as consisting of the upper and lower 1%, 2%
and 5% tails of the market distribution.
However, to avoid the subjective definition of extreme behaviour and also to
account for non-normality of returns and the fat tails of return distributions that affect
standard deviation metrics more than they affect absolute deviation measures, CCK
proposes an alternate model to identify herding. The CCK model predicts that market
participants are more likely to herd during market stress, as characterized by periods of
large price movements. Thus, one would expect a less than proportional increase in
t mt mt
t R R
CSAD 1| | 2 2
The coefficient 2 captures the non-linear relationship that may exist between CSADt and
Rmt.
In contrast to the conventional approach we apply a threshold regression method
developed by Hansen [2000] to standard CSAD regressions, in order to capture a
non-linear effect of extreme market movement on the herding behaviour. The threshold model
allows splitting up of the sample into different regimes and tests the herding for each of
these regimes respectively. Further, the paper also tests herding in up-market and
down-markets conditions separately, where the down-market (up-market) is defined as
comprising all observations for which the return is less than zero (greater than zero). This
specification allows us to capture potential asymmetries in the herding behaviour.
We test the null hypothesis of a linear regression against a threshold model as follows.
) 2 ( | | ) 1 ( | | ' 2 ' 1 t t mt t t t mt t q u R CSAD q u R CSAD
Where CSADt and qtare the dependent variable and the threshold variable respectively,
while |Rmt | is the independent variable capturing the absolute market return. The threshold
variable, which is |Rmt| in our model, is used to split up the sample into two groups called
"regimes". The model allows the regression parameters to differ depending on the value
of q. The random variableutis the regression error.
The model (1)-(2) can be written in a single equation form with the introduction of the
dummy variable dt=I (|Rmt| where I (
.
) denotes the indicator function. If we set thevariable |Rmt( Rmt|.dt, then equations (1)-(2) are equal to
) 3 ( | ) ( | | | ' t mt mt
t R R u
where = 2 and = 1- 2.
Equation (3) allows all regression parameters to differ between the two regimes. Hansen
[2000] develops an algorithm based on a sequential OLS estimation which searches over
all values =q{t} t=1,...,T. The procedure also provides estimates of and . The null
hypothesis of rational asset pricing model is captured as 1> 2>0 against the alternative
of herding behaviour as 2 < 1. A heteroskedasticity-consistent F-test bootstrap procedure
is used to test the null of linearity. Since the threshold value is not identified under the
null, the p-values are computed by a fixed bootstrap method. The independent variables
are supposed to be fixed, and the dependent variable is generated by a bootstrap from the
distribution N(0, et)) where et is the OLS residual from the estimated threshold model.
Hansen [2000] shows this procedure yields asymptotically correct p-values. Therefore, if
the hypothesis of linearity is rejected with 1= 2, one can split the original sample
according to the estimated threshold value and further test for herding using the
restriction 2 < 1 .
3. Data and Sample
Christie and Huang (1995) argued that the herding behavior is often a short-term
phenomenon and can only be captured with a high frequency data. Further, Tan et al
(2008) while analyzing herding behavior in the Chinese stock market also concluded that
the level of herding is more pronounced using daily data than using weekly and monthly
data. Therefore, following the existing literature the paper uses daily stock price data to
test herding behaviour for the Indian equity market.
The daily data on stock prices, market capitalization for all firms listed on BSE-500 has
been collected over the period from January 1, 2003 to 31 March, 2008, constituting 1301
observations5.
5
Since, there have been new firms included in BSE-500 in the sample period for which
only partial data was available we have considered a consistent set of firms in our
analysis leading to a balanced sample of 349 firms. The data is obtained from Capitaline
database. The stock return for all firms is calculated asRt 100*(log( ) log(Pt Pt 1)).
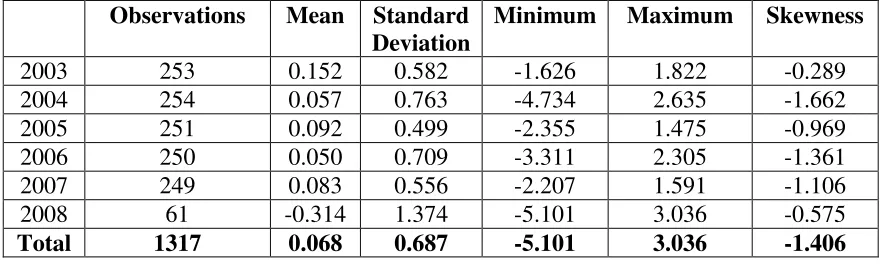
Table 1 contains summary statistics for average daily return for BSE 349 companies. In
2008, the mean value of average daily return is in negative and has a higher standard
deviation which confirms the then turbulence in the Indian Market. The minimum
average daily return for the total sample (-5.101%) also occurs on 21st January 2008. The
second lowest minimum average daily return (-4.734%) was on 17th May 2004 when
SENSEX slumped by 842 points due to political uncertainty in the domestic market as
National Democratic Alliance government went out of power. The average daily return
for the entire sample is 0.06% with a characteristic negative skewness observed in the
return data.
4. Empirical Results:
Table 2 shows the results of global OLS regressions of standard CSAD model and test for
a threshold effect. Using 1000 bootstrap replications, the p-value for the threshold model
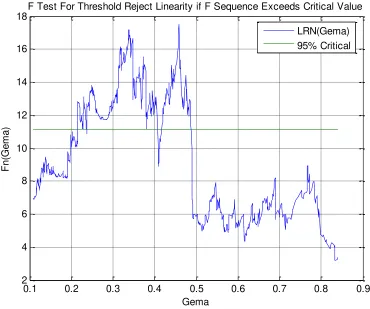
using |Rmt| is significant at 0.001 suggesting a possible sample split based on |Rmt|. Figure
1 displays a graph of the normalized likelihood ratio sequence LR*(n) as a function of the
threshold. The LS estimate of is the value that minimizes this graph, which occurs at
1.413%. The 95% critical value is also plotted in Figure 2 and the asymptotic 95%
confidence interval can be considered as between 0.458% and 1.433%. Therefore, the
results show that there are reasonable evidences for a two-regime and nonlinear effect in
CSAD6.
6
Table 1: Summary Statistics: Average Daily Return (BSE 349 companies)
Table 2: Global OLS Estimation, Without Threshold
Note: The null of no threshold is rejected at 1% level. The heteroskedasticity correction used
for SE
Figure 1: F-test for testing the null of linearity against a threshold specification using |Rmt| as threshold variable.
Observations Mean Standard Deviation
Minimum Maximum Skewness
2003 253 0.152 0.582 -1.626 1.822 -0.289
2004 254 0.057 0.763 -4.734 2.635 -1.662
2005 251 0.092 0.499 -2.355 1.475 -0.969
2006 250 0.050 0.709 -3.311 2.305 -1.361
2007 249 0.083 0.556 -2.207 1.591 -1.106
2008 61 -0.314 1.374 -5.101 3.036 -0.575
Total 1317 0.068 0.687 -5.101 3.036 -1.406
Dependent Variable (CSAD) Estimate Standard Error
Constant 0.719579 0.00745
|Rmt| 0.295904 0.013674
0.1 0.2 0.3 0.4 0.5 0.6 0.7 0.8 0.9 2
4 6 8 10 12 14 16 18
F
n
(G
e
m
a
)
Gema
F Test For Threshold Reject Linearity if F Sequence Exceeds Critical Value
[image:9.612.116.486.80.389.2]LRN(Gema) 95% Critical
0 1 2 3 4 5 6 0 5 10 15 20 25 30 35 40 45 50 Threshold Variable:absmean L ik e lih o o d R a ti o S e q u e n c e i n G e m a
Confidence Interval Construction for Threshold
LRN(Gema) 95% Critical
Fixing at the LS estimate of |Rmt| at 1.413% we split the sample in two regimes where
distribution of observations in normal (|Rmt| <1.413%) and extreme market movements
(|Rmt| >1.413%) is 95.93% and 4.07% respectively. It is important to note that the
extreme tail of the return distribution contains 4% data which is consistent with CH
specification of extreme events. Further, the extreme market returns are 23.5 time higher
than that of an average daily return of 0.06%.
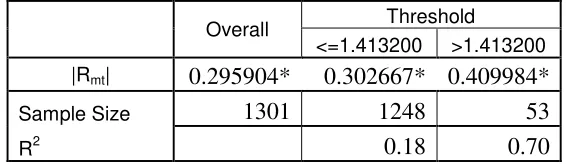
The coefficient of the absolute market return, as reported in table 3, is positive and
significant, indicating that CSAD increases with the absolute market return suggesting
that the Indian traders actually trade away from the market consensus during the periods
of market stress. In other words, the null hypothesis of rational asset- pricing model, i.e.,
Table 3: Regression Estimation with the CSAD as dependent variable.
Overall
Threshold
<=1.413200 >1.413200 |Rmt| 0.295904* 0.302667* 0.409984*
Sample Size 1301 1248 53
R2 0.18 0.70
* Bootstrap p values indicate significance at 1% level.
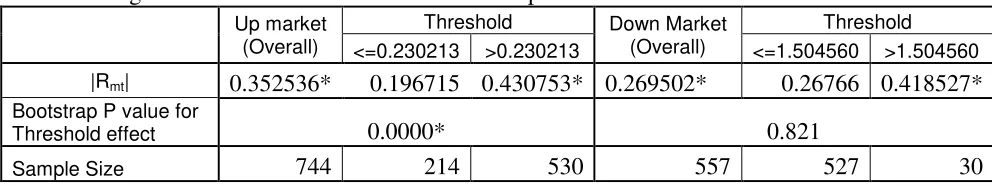
Table 4 explores the potential asymmetries in the herding behaviour. We test herding for
both extreme up-market and down-markets conditions, where the down-market
(up-market) is defined as comprising all observations for which the return is less than zero
(greater than zero). The result reported in table 4 shows a threshold effect in up market
while we do not observe a similar effect during the down market movements.
Regression result presented in table 4 provides strong support for the rational
asset- pricing prediction corroborating that there is a positive relationship between CSAD
and the absolute market return and specifically the level of dispersion increases at the tail
of the market return distribution.
Therefore, the result presented in the paper conforms to the predictions of the
rational asset-pricing model as against herding as the dispersions in returns in the Indian
equity market increase when the market is subject to greater levels of stress. To check the
robustness of the empirical result presented in the paper several alternative specifications
have been tested including the standard CCK model with R2mt and volume as additional
explanatory variables. However, most of these unreported exercises corroborate the basic
Table 4: Regression Estimation with the CSAD as dependent variable.
Up market (Overall)
Threshold Down Market
(Overall)
Threshold <=0.230213 >0.230213 <=1.504560 >1.504560 |Rmt| 0.352536* 0.196715 0.430753* 0.269502* 0.26766 0.418527*
Bootstrap P value for
Threshold effect 0.0000* 0.821
Sample Size 744 214 530 557 527 30
* Bootstrap p values indicate significance at 1% level.
5. Conclusion:
The paper investigates herding behaviour in the India equity market by applying a
threshold model developed by Hansen [2000]. The results presented in this paper show
that the threshold specification does capture the non-linear effect of extreme market
movements on the trading behaviour of the participants. However, the threshold effect
provides no evidence for market-wide herding in the Indian equity market. Even in the
extreme market conditions, participants appear to discriminate between different
References
Bikhchandani S., Sunil. S. (2000). Herd Behavior in Financial Markets . IMF Working Paper WP/00/48.
Chang, E.C., Cheng, J.W., Khorana, A., (2000), “An Examination of Herd Behavior in
Equity Markets: An International Perspective”, Journal of Banking and Finance 24, 1651 -1679.
Christie, W. G., and Huang, R. D., (1995), “Following the pied piper: Do individual
returns herd around the market? Financial Analyst Journal, Vol. 51 (4), pp. 31-37.
Demirer, R. and Kutan, A. M., (2006), “Does herding behavior exist in Chinese stock market?” Journal of International Financial Markets, Institutions and Money, 16, 123-142.
Devenow, A., Welch, I., (1996), “Rational herding in financial economics”, European Economic Review 40, 603–615.
Gleason, K.C., Mathur, I, Peterson, M.A., 2004, Analysis of Intraday Herding Behavior among the Sector ETFs, Journal of Empirical Finance 11, 681-694.
Goetzman, W. (1995). “Discussion: On Fads, Crashes and Asymmetric Information," in Richard Sylla and Mike Bordo, Eds. Anglo-American Finance Systems: Institutions and Markets in the 20th Century, Irwin Publishers, 1995.
Hansen B. (2000) “Sample splitting and threshold estimation”, Econometrica, vol 69, No 1555-1596..
Hong, H., Kubik, J. D., Solomon, A., (2000), “Security Analysts’ Career Concerns and Herding of Earnings Forecasts”, RAND Journal of Economics 31, 121–144.
Hwang, S., and Salmon, M., (2004), “Market stress and herding,” Journal of Empirical Finance, Vol. 11, pp.585-616.
Nofsinger, J.R., and R.W. Sias (2002). “Herding and Feedback Trading by Institutional
and Individual Investors”, Journal of Finance, 54, 2263-2295.
Scharfstein, D.S., Stein, J.C., (1990), Herd Behavior and Investment, American Economic Review 80, 465-479.
Wermers, R., (1999), Mutual Fund Herding and the Impact on Stock Prices, Journal of
Finance 54, 581-622.