Scanpaths in reading are informative about
sentence processing
T itus von der M alsbur g
1Shravan Vasishth
1Reinhold Kliegl
2(1) Department of Linguistics, University of Potsdam (2) Department of Psychology, University of Potsdam
{malsburg vasishth kliegl}@uni-potsdam.de
ABSTRACT
Scanpaths, sequences of fixations of the eyes, have historically played an important role in eyetracking research but their use has remained highly limited until recently. Here, we summarize earlier research and argue that scanpaths are a valuable source of information for reading research, specifically in the study of sentence comprehension. We also discuss a freely available, open source scanpath analysis method that we used to evaluate theoretical claims about human parsing and about how the parser guides the eyes during reading. This scanpath analysis is shown to yield new information that was missed when traditional approaches were used to study theories about eye guidance during garden-pathing. We also show how relatively subtle scanpath effects can be detected when we report the scanpath analysis of a large eyetracking corpus. In sum, we argue that scanpath analyses are likely to serve as an increasingly important tool in reading research, and perhaps also in other areas where eyetracking is used, e.g., in studies using the visual world paradigm.
1 Introduction
Over the last decades, eyetracking has been established as one of the most important tools for studying human language processing. Eyetracking studies contributed to the investigation of the lexical retrieval of words and the processing of syntax, semantics, and discourse. The two dominant experimental paradigms that have been used are reading studies and visual world studies. In reading studies, the movements of the eyes are recorded as sentences are read. Typical dependent variables are word-based duration measures such as the time the eyes dwell on a word before proceeding to the next word or the probability to move backwards from a word (regression probability). Increased dwell times and rates of regressions on a particular word are commonly interpreted as reflecting difficulty to process that word or one of the previous words (Rayner, 1998; Clifton et al., 2007; Vasishth et al., 2012). In visual word experiments, participants hear recordings of sentences while watching visual scenes. Typically, a scene is displayed in which one object is a target that is mentioned in the sentence; other objects serve as distractors. The amount of looks to the target object and their timing can uncover when various types of information come into play during comprehension (Huettig et al., 2011). For instance, if the target word is a pronoun ("him" vs "her"), the speed at which people converge with their gaze to the visual representation of the antecedent of the pronoun and the proportion of looks to distractors can be informative about the mechanisms underlying reference resolution (e.g., Kaiser et al., 2009).
Common to all these approaches is the fact that they considerably reduce the recorded in-formation about eye movements. In reading studies, a word or small region is singled out for which a duration measure or a regression probability is computed, that is, the measure is aggregated across trials and participants. Eye movements that occurred before the eyes entered this region and after they left it are discarded. This approach is entirely reasonable if the effect of the experimental manipulation is focused to a particular critical region and if the effect of the manipulation is expected to be largely the same in all participants. In many cases, these assumptions may be reasonable; in this paper, however, we argue that they can be problematic in certain important situations. The issue is not limited to reading studies; information may be similarly lost in analyses of data acquired in visual world experiments. Eye movements in this type of experiment are most often evaluated using the percentage of looks to a region in the visual stimulus (target or distractor) as a function of time. This involves aggregating the data of all trials in a condition and the individual fixation sequences are lost. If there were several qualitatively different fixation patterns, reflecting different cognitive processes, these would not be identifiable in the aggregate. The purpose of these simplifications of the eyetracking data is (i) to get rid of irrelevant variance which could mask the effects of interest and (ii) to extract a dependent measure that can be analyzed using standard statistical tools. Clearly, simplification of the data is a trade-off: the raw data is difficult to interpret but an over-simplified signal can be misleading.
1.1 Eye movements in reading: What do they look like?
In this paper, we discuss our analyses of two sets of eyetracking data (these analyses are reported in von der Malsburg and Vasishth, 2012; von der Malsburg et al., 2012). The first data set was collected in a reading experiment that investigated the processing of Spanish garden-path sentences (von der Malsburg and Vasishth, 2012). The 70 Spanish native speakers tested in this study came from a relatively homogeneous population and the experimental sentences all followed a particular syntactic construction (average number of words: 18.5). Because of a temporary attachment ambiguity of an adverbial clause these sentences were somewhat difficult to process, but they still constitute an easy type of garden-path sentence. The design of the study resembles that of typical reading studies in sentence processing research: the conditions were minimally different from each other, the sentences had comparable length, and the presentation of items (pseudo-randomly intermixed with fillers) was counterbalanced in the standard manner. The second data set is the Potsdam Sentence Corpus (henceforth, the PSC), a database of eye movements recorded from 230 participants reading a set of 144 sentences (Kliegl et al., 2004). The participants ranged from teenagers to pensioners and came from diverse socioeconomic backgrounds. The sentence material consisted of simple German sentences (ranging from 5 to 11 words, average: 7.9) that were designed to represent a large variety of syntactic constructions. Thus, the PSC can be regarded as a representative sample of how the general population reads common sentence types.
How would a machine direct its eyes when reading a sentence? One obvious strategy would be to scan the words from left to right one at a time, looking on each word until it is fully processed and to move to the next when finished. The spatial pattern of fixations generated by such a reader would not be interesting because it would always be the same regardless of the sentence being read: a monotonic movement in one direction. All information about the underlying processes would be conveyed by the temporal dynamics. While human readers use a similar reading strategy, the targets of their saccades are far from being as predictable as those of our hypothetical reading machine. In the PSC, for instance, 19% of the saccades skip the next word (skipped words are typically short and have high frequency), 17% of the saccades result in another fixation on the current word, and 14% of the saccades are directed at previous words. Hence, only 50% of the saccades target the next word in the sentence. This means that even when people read simple sentences that do not pose any larger difficulties, they deviate considerably from a monotonous left-to-right reading style. Several factors have been shown to causes these deviations from a straight eye movement trajectory. They include oculo-motor constraints, lexical processing, and higher-level language processing (Rayner, 1998; Bicknell and Levy, 2011).
Fig. 1 shows eye movements from the PSC that were recorded when participants read the sentence in (1). This sentence has long words (easy to target) and canonical word order (easy to process). Of all sentences in the PSC, this one elicited the most regular reading patterns. The scanpaths in fig. 1 can therefore be seen as marking the lower bound on irregularity in scanpaths. Although the participants read this sentence mostly from left to right, the plot shows that in almost all trials words were skipped and that in several trials material was revisited.
(1) Wolfgangs
Wolfgang’s
Töchter
daughters
studieren
study
Literatur
literature
und
and
Maschinenbau.
engineering.
Word
Time (sec)
1 2 3 4
1
2 4 6
3 4
2 4 6
5 6
2 4 6
7 8
2 4 6
9
10 11 13 14 15 16 17
1 2 3 4 18
1 2 3 4
2 4 6
19 20
2 4 6
21 22
2 4 6
23 24
2 4 6
[image:4.420.49.351.78.226.2]25 26
Figure 1: Eye movement as recorded in 24 trials in which participants read the sentence “Wolfgang’s daughters study literature and engineering.” Each panel shows how a specific participant read the sentence. Words are on the x-axis, time is on the y-axis, and the lines shows the trajectory of the eyes. In only three trials (7, 17, 20), the eyes proceeded strictly from word to word. In most trials the short word “and” was skipped. In several trials the eyes returned to earlier material (1, 3, 4, 21, 22, 26).
interpretation of the sentence, reading patterns can deviate even more from a straight uni-directional reading pattern. Quite early in psycholinguistic research, Frazier and Rayner (1982) demonstrated that encountering the disambiguating word in a garden-path sentence such as (2) can cause multi-fixation regressive eye movements which they interpreted as reflecting syntactic reanalysis. For instance, when reading the sentence in (2), readers have a tendency to interpret the noun phrase “the sock” initially as the object of “mending”. However, when “fell” is encountered, it becomes clear that this role assignment cannot be maintained and the interpretation of the sentence has to be revised.
(2) While Mary was mending the sock fell off her lap.
Word
Time (sec)
5 10
1
5 10 15
2 3
5 10 15
5 6
5 10 15
7 8
5 10 15
9
10 11 12 13 14 15 16
5 10 17
5 10
5 10 15
18 19
5 10 15
20 21
5 10 15
22 23
5 10 15
[image:5.420.66.366.79.227.2]24 25
Figure 2: Eye movement as recorded in 24 trials in which participants read the sentences in (3) (“El profesor dijo . . . ”). Each panel shows how a specific participant read the sentence. Words are on the x-axis, time is on the y-axis, and the lines shows the trajectory of the eyes.
about 50% of the trials, the participants of this experiment produced regressive eye movements after they read the critical word in the sentence showing that sentence processing can have a dramatic impact on the gaze trajectory. In the vast majority of cases, these regressive eye movements consisted of several fixations, which rules out a trivial numerical representation of the gaze trajectory. The measures devised by earlier authors (Meseguer et al., 2002; Mitchell et al., 2008) reduced these fixation sequences (the scanpaths) to only the first backwards directed saccade following the fixation on the critical word. The benefit of this approach is that the distribution of landing sites of this saccade can be modeled using standard statistical tools; the drawback is that information about eye movement events following this first regressive saccade is lost. One goal of this paper is to show that this loss of information can have a critical impact on the inferences drawn from eye movement data.
Summarizing this section, we can say that, despite the linear nature of text, reading patterns are quite complex, and that they may contain important information about the cognitive processes underlying reading. The next section will describe a method that can be used to leverage that information.
2 Analyzing Scanpaths
we can calculate means, standard deviations, and confidence intervals to make inferences. In contrast to that it is unclear how two measurements should be compared if they consist of scanpaths. What is the mean of a set of scanpaths and how can we describe the variance? These questions could be answered if there was a vector representation of scanpaths in a common vector space but deriving such a representation is not trivial due to the variable length of scanpaths ranging from two fixations to an unbounded number of fixations. One way to derive a vector representation has been proposed by Josephson and Holmes (2002). The procedure is as following: calculate all pair-wise similarities of the scanpaths in a data set. Next, set up an
n-dimensional vector space and for each scanpath randomly place a vector in this space. Then, use an iterative procedure that optimizes the positions of these vectors until their distances in the vector space approximate the previously calculated similarities of the corresponding scanpaths as well as possible (this procedure is called non-metric multidimensional scaling, Kruskal, 1964). These vector representations—we call them maps of scanpath space—have various desirable properties: scanpaths that are similar are located close to each other in the vector space and dissimilar scanpaths are far apart. This property allows us to apply clustering procedures to the map of scanpaths in order to identify categories of scanpath patterns. We can also calculate the variance in the scanpaths, identify an "average" scanpath (i.e., the scanpath in the center of gravity of a set), and locate the areas of highest density in order find scanpath patterns that occurred often.
The missing ingredient for these things to work is an appropriate similarity measure that captures the relevant properties of scanpaths. One proposal has been to use the Levenshtein distance (Brandt and Stark, 1997; Salvucci and Anderson, 2001) which quantifies the (dis)similarity of two sequences of symbols as the number of edit-operations that have to be performed on one sequence to transform it into the other (Levenshtein, 1966). These operations are deletion and insertion of a symbol and substitution of a symbol by another symbol. This measure can be applied to eye movements in the following way: partition the visual stimulus into regions and uniquely label each region with a letter. A sequence of fixations can then be represented by a sequence of letters in which then-th letter specifies the location of then-th fixation (see fig. 3 for an illustration).
The Levenshtein metric has many desirable properties such as the ability to deal with sequences of unequal length and being relatively cheap to compute.1However, it also has some important
A
B
C D
E
F
G H
179
43 64
29 1
0 0
1
100 1
[image:7.420.67.371.68.186.2]Levenshtein distance Scasim
Figure 3: Two graphs illustrating how the Levenshtein metric and the Scasim measure calculate the similarity of two scanpaths. For the Levenshtein metric the stimulus has to be partitioned into regions (A, B, C, . . . ) so that the scanpaths can be represented as symbol sequences. The blue scanpath is represented as AEFCH, the red one as FFGH. For every mismatch in these sequences the Levenshtein metric increases by one. The Scasim measure, on the other hand, does not require a partitioning of the stimulus. The coordinates and durations of the fixations are represented as continuous variables. The mismatch in the two scanpaths can then be quantified as a function of the spatial and temporal differences between the matching fixations. Differences in fixation durations (represented as the size of the circles) and spatial distances both contribute to the overall (dis)similarity of two scanpaths.
fixations that are really far apart. Research on oculo-motor control in reading has found that a word can be processed even if it is not in the center of the fovea (the high-resolution center of the visual field) but also when it is in the parafovea (Rayner, 1975). This means that a fixation close to a word can have similar consequences as a fixationonthe word. Treating fixations close to a word as if they were far apart is therefore undesirable. In sum, the Levenshtein metric is a relatively crude measure for scanpath similarity because it deprives scanpaths of their temporal information and because it uses a very coarse-grained model of space. This situation prompted us to develop a new similarity measure for scanpaths, called Scasim, that is highly sensitive to the spatio-temporal properties of scanpaths (von der Malsburg and Vasishth, 2007, 2011).
2.1 The Scasim measure
two fixations. If they have the same location, the cost of the substitution is simply the difference in their fixation durations. If the two fixations are extremely far apart, the cost is given by the sum of the fixation durations. There are two reasons for this choice. First, if the two fixations are long, this means that the spatial deviation between them is temporally longer and should therefore lead to increased overall dissimilarity. Second, this choice means that substituting two fixations that are extremely far apart amounts to the same dissimilarity as deleting one of the fixation and inserting the other. This property avoids discontinuities in the similarity function, e.g., when the duration of one fixation converges to zero. What is the dissimilarity when the two fixations are neither at the same location nor extremely far apart, i.e., if they are only somewhat spatially separated? In this case, the cost of the substitution is a weighted sum of the difference of the fixation durations and the sum of the fixation durations. The weights are a function of the spatial distance and are determined by a function that mimics the exponential drop in visual acuity of human vision (Daniel and Whitteridge, 1961; Rovamo et al., 1978). Some useful properties of the resulting similarity measure that follow from these definitions are: (i) Partitioning of the stimulus in more or less arbitrary regions is not necessary because the measures is a continuous function of the coordinates and durations of the fixations in two scanpaths. (ii) The measure is theory-agnostic, i.e., it does not make any assumptions about the significance of certain types of eye movements, e.g., a regression in reading is not treated any different than any other eye movement pattern. (iii) Similarity scores can be efficiently computed with a variant of the Needleman-Wunsch algorithm (Needleman and Wunsch, 1970). See von der Malsburg and Vasishth (2011) for a detailed discussion of Scasim. See fig. 3 for an illustration showing how the similarity of two scanpaths is computed with Scasim.
There is not one true similarity measure for scanpaths and our measure constitutes only one possible way to quantify differences between scanpaths. What’s similar and what’s not really depends on the question being asked and while our measure may be useful in one type of analysis it may not be suitable in other types. Given that, it is not surprising that quite a few other similarity measures have recently been proposed which all have different properties and applications (Salvucci and Anderson, 2001; Cristino et al., 2010; Jarodzka et al., 2010; Mathôt et al., 2012; Coco and Keller, 2012). Unfortunately, there is no space here to describe these measures, but some are discussed and compared with Scasim in von der Malsburg and Vasishth (2011).
The next sections will describe two different ways in which we used the Scasim measure to analyze eye movements in reading.
3 Case study 1: Regression patterns during reanalysis
In von der Malsburg and Vasishth (2011, 2012) we investigated scanpaths in response to the disambiguation of Spanish garden-path sentences such as (3) (adapted from Meseguer et al., 2002).
(3) El
The
profesor
teacher
dijo
said
que
that
los
the
alumnos
students
se levantaran
had to stand up
. . .
. . .
a.[Ad vC [Ad vC
cuando
when
los
the
directores
directors
entraron came
en la clase].
into the classroom]. b. [Ad vC
[Ad vC
cuando
c. [Ad vC [Ad vC
si if
los
the
directores
directors
entraban
come
en la clase].
into the classroom].
Sentences (3a) and (3b) contain an adverbial clause (“cuando los directores . . . ”) which can initially be attached to the main verb of the sentence (“dijo”) or to the embedded verb (“levantaran”). The correct attachment site is only determined when the verb of the adverbial phrase is read (“entraron”/“entraran”) because the mood of this verb (indicative or subjunctive) agrees with either the main verb or the embedded verb. Low attachment to the embedded verb is preferred in Spanish in agreement with the late-closure principle (Frazier, 1979). Therefore the sentence processor experiences difficulty at “entraron” in (3a) because this word indicates that the initial attachment was incorrect. A revision of the attachment has to be carried out. In sentence (3c), the attachment is unambiguously clear at all times because the “si”-clause can only attach to “levantaran”.
The main question that we investigated was: which strategy does the parser use to revise the interpretation of the sentence? Three hypotheses about the mechanisms underlying revision have been proposed in the literature (see Frazier & Rayner, 1982, for a detailed discussion). The
forward reanalysis hypothesisstates that reanalysis is carried out by means of normal parsing routines. The parser is assumed to return to the beginning of the sentence and to re-parse the sentence while looking for choice points at which the misanalysis can be prevented. The
backward reanalysis hypothesisstates that the parser switches to reverse gear, undoing parsing decisions word-by-word until the crucial choice point is reached (Kaplan, 1972). Theselective reanalysis hypothesisposits that the parser intelligently identifies the problem and that it deploys targeted repair mechanisms (Frazier and Rayner, 1982). Under the additional assumption that the eyes are tightly coupled to the sentence processor (the eyes look at the word that is currently being processed; Just and Carpenter, 1980) these hypotheses afford clearly distinguishable predictions about scanpath patterns. According to forward reanalysis, the eyes should return to the beginning of the sentence and start a second pass over the material so far. According to backward reanalysis, the eyes should reverse the direction going backwards until the beginning of the ambiguous region is reached (“cuando”) and should then switch back to normal forward operation. According to selective reanalysis, the eyes should perform targeted saccades to words that are affected by the reanalysis: the ambiguous region, the main, and the embedded verb. To test for these patterns, we recorded eye movements from 70 participants who read sentences as in (3). Since no reanalysis is required in (3b) where the critical word (“entraran”) only supports the preferred interpretation, any regressive scanpath patterns that occur more often in (3a) than in (3b) can be interpreted as reflecting reanalysis. Thus, one way to address the question about reanalysis strategies is to perform a cluster analysis of scanpath patters with the goal to identify qualitatively different types of scanpaths and to see if one or several of these types occur more often in condition (3a) than in (3b).
3.1 Analysis
The complete analysis was carried out in GNU-R (R Development Core Team, 2009). We first extracted from all trials regressive scanpaths that occurred after the critical word was read. Next, we used our Scasim measure to calculate the pair-wise similarities of all these regression patterns. This can be done with a function calledScasimwhich is freely available from the authors.2This function takes a data frame (basically a table) as input which contains,
A
B
C
A
A
B
C
B
[image:10.420.50.356.68.165.2]C
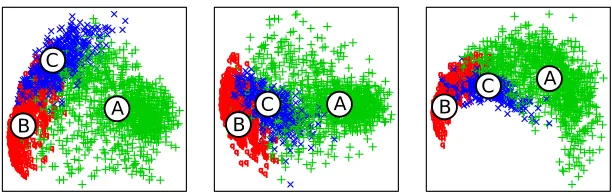
Figure 4: Three projections of the 7-dimensional map of scanpaths calculated for the analysis of scanpaths recorded in our Spanish experiment. Each point is a scanpath. The colors indicate membership to the three clusters (A, B, C) that were identified in the cluster analysis.
chronologically ordered, a line for every fixation in the data set. One column identifies the trial to which a fixation belongs, other columns specify the x and y coordinates and the duration of a fixation. The resulting matrix of similarity scores was then used to fit a map of scanpath space, i.e., an-dimensional vector space with a vector for each regressive scanpath (see fig. 4). This was done using the functionisoMDSfrom the packageMASSwhich performs multidimensional scaling. Once the vector representation of scanpaths is available, a large range of statistical methods can be used to analyze the variance in scanpaths. We chose mixture of Gaussian modeling for the cluster analysis. Mixture models describe the distribution of data points using a set of multivariate Gaussians each of which represents one cluster. One important benefit over other clustering procedures, such as k-means, is that mixture models can identify overlapping clusters based on their distributional properties. The parameters of the Gaussians (position, spread, orientation) were calculated using expectation maximization (packagemclust, Fraley and Raftery, 2002, 2007). A Bayesian information criterion was used to determine the optimal number of clusters (Schwarz, 1978).
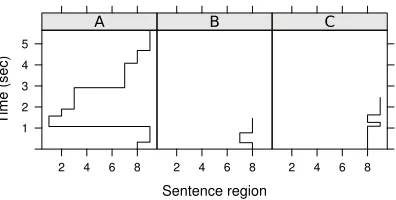
The cluster analysis identified three broad classes of scanpath patterns which can be seen in the map of scanpaths in fig. 4. What scanpath pattern do these classes represent? A distribution of reaction times can be characterized by calculating its mean. Similarly we can characterize a cluster by identifying its center of gravity (the mean of the multivariate Gaussian). The scanpaths that are closest to that center can be seen as being prototypical for that cluster. Fig. 5 shows one prototypical scanpath for each of the three clusters that we found. In one pattern (A), the eyes reread the sentence as predicted by the forward reanalysis hypothesis. In another pattern (B), the eyes returned from the disambiguating region (“entraron/entraran”) to the
ambiguous region. In the third pattern (C), the eyes returned from the spill-over region (“en la clase”) to the disambiguating region.
C B
A
Sentence region
Time (sec) 12
3 4 5
2 4 6 8 2 4 6 8 2 4 6 8
[image:11.420.110.308.70.170.2]A B C
Figure 5: Prototypical scanpaths for three clusters identified in the cluster analysis of the scanpaths recorded in our Spanish study. These scanpaths were located at the center of gravity of the three clusters shown in fig. 4. In A, the eyes returned to the beginning of the sentences after having read the disambiguating word in region 8 and then reread the sentence. In B, the eyes rapidly regressed from the disambiguating word to the ambiguous region 7. In C, the eyes returned from the spill-over region 9 to the disambiguating region.
that study, this was interpreted as showing that high-capacity readers commit more eagerly to an attachment decision—and consequently have to revise these decisions more often—than low-capacity readers who were hypothesized to leave the attachment occasionally unspecified in order to preserve resources. Pattern C (revisiting the disambiguating word) occurred equally often in the temporarily ambiguous conditions (3a,b) but less often in the unambiguous condition (3c). The difference between sentences in conditions (3a) and (3b) was only one letter (“entraron” vs. “entraran”) and it seems likely that type C regressions served to increase the certainty about what has been read in cases were the targeted word was decisive for the attachment of the adverbial clause (c.f. Bicknell and Levy, 2010). See von der Malsburg and Vasishth (2012) for more details.
Various aspects of these results suggest that analyses of scanpath patterns can contribute substantially to the interpretation of eyetracking data. We will briefly discuss two ways in which an analysis of traditional eyetracking measures would have missed important information in the eyetracking record.
interpretation of saccades analysed in isolation can be problematic and it shows that scanpath analyses can help to avoid misinterpretations.
Second, working memory was found to modulate the rate of pattern A scanpaths (rereading) and pattern B scanpaths (regressions to the disambiguating region). However, the effects were different for these two types of scanpaths. There was no effect of working memory on the rate of pattern C scanpaths (revisiting the disambiguating region). A traditional regression measure such as regression probability conflates these effects by aggregating across the three functionally different types of scanpaths. The resulting pattern of effects is difficult to interpret. Indeed, if only regression probability were to be analyzed in the above case, qualitatively different effects of working memory on scanpaths may cancel each other out so that no influence of working memory would be detected at all. This shows that separating qualitatively different eye movement phenomena can in some situations reveal effects that would otherwise go unnoticed.
4 Case study 2: Scanpath variance in general reading
Our scanpath analysis of regressions in response to garden-pathing has shed new light on the mechanisms underlying the processing of ambiguous material. Can scanpaths also be informa-tive about other processes involved in reading? One way to answer this question empirically is to analyze a database containing eye movements for a variety of constructions (e.g., the Potsdam Sentence Corpus, PSC) and to investigate the factors that influence scanpaths. These factors may include oculo-motor, sentence processing constraints, and individual difference in readers. In von der Malsburg et al. (2012), we reviewed the literature and identified three variables that should influence scanpath patterns. The effects of these variables have previously only been shown using simplifying, word-based eyetracking measures such as regression probability. The first variable is the syntactic processing difficulty of a sentence. In a wide range of studies, it has been found that if a word is difficult to integrate with the sentence fragment read so far, the result is often an increased rate of regressive eye movements (see Clifton et al., 2007, for a review). The second variable influencing scanpaths is the length of words. The literature on oculo-motor control in reading has found that short words are skipped more often (Brysbaert and Vitu, 1998; Kliegl et al., 2004; Drieghe et al., 2005) and that the eyes often return to skipped words (Vitu and McConkie, 2000; Engbert et al., 2005). The third variable is the age of readers: older readers skip words more often and also regress more often than young readers (Kliegl et al., 2004; Rayner et al., 2006). The effects of all three variables have also been documented for the PSC (Kliegl et al., 2004; Boston et al., 2008).
● ● ● ● ● ● ● ● ● ● ● ● ● ● ● ● ● ● ● ● ● ● ● ● ● ● ● ● ● ● ● ● ● ● ● ● ● ● ● ● ● ● ● ● ● ● ● ● ● ● ● ● ● ● ● ● ● ● ● ● ● ● ● ● ● ● ● ● ● ● ● ● ● ● ● ● ● ● ● ● ● ● ● ● ● ● ● ●● ● ● ● ● ● ● ● ● ● ● ● ● ● ● ● ● ● ● ● ● ● ● ● ● ● ● ● ● ● ● ● ● ● ● ● ●
−2 −1 0 1 2
−2
−1
0
1
2
"Werners Töchter studieren Literatur und Maschinenbau."
● ● ● ● ● ● ● ● ● ● ● ● ● ● ● ● ● ● ● ● ● ● ● ● ● ● ● ● ● ● ● ● ● ● ● ● ● ● ● ● ● ● ● ● ● ● ● ● ● ● ● ● ● ● ● ● ● ● ● ● ● ● ● ● ● ● ● ● ● ● ● ● ● ● ● ● ● ● ● ● ● ● ● ● ● ● ● ● ● ● ● ● ● ● ● ● ● ● ● ● ● ● ● ● ● ● ● ● ● ● ● ● ● ● ● ● ● ● ● ● ● ●
−2 −1 0 1 2
−2
−1
0
1
2
[image:13.420.91.347.68.198.2]"Den Ton gibt der Künstler seinem Gehilfen."
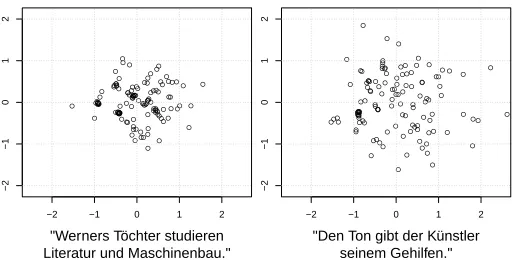
Figure 6: Two maps of scanpaths. For plotting the first two principal components of the 4-dimensional maps were used as the axes. Left, the map for the sentence that elicited the most regular scanpaths (‘Wolfgang’s daughters study literature and engineering’) and on the right for the sentence that elicited the most irregular scanpaths (‘The artist gave the clay to his apprentice’). Each point represents a scanpath that was produced by a different reader. Distances between the points reflect the dissimilarities of the corresponding scanpaths. The first sentence has canonical word order while the second has non-canonical word order and a lexical ambiguity which can lead to garden-pathing (“Ton” can mean sound or clay).
one of 230 readers read the sentence. Fig. 6 shows the maps for the following two sentences:
(4) Wolfgangs Wolfgang’s Töchter daughters studieren study Literatur literature und and Maschinenbau. engineering. (5) Den
The Tonclay gabgave derthe Künstlerartist seinem Gehilfen.to his apprentice. ‘The artist gave the clay to his apprentice.’
In order to calculate density, we again used mixture models, this time however to derive a density function for each of the 144 maps. The density scores of the scanpaths were then modeled as a function of syntactic difficulty of sentences, average word length in sentences, age of readers, and the interactions of these factors (linear mixed models, Bates, 2005). Syntactic difficulty was measured as the average surprisal (Hale, 2001) and the average retrieval cost in a sentence Lewis and Vasishth (2005). Surprisal quantifies the unexpectedness of a word given the preceding words and retrieval cost the difficulty of retrieving dependents of a word from working memory assuming temporal decay and similarity-based interference between memory items. These two measures thus capture different aspects of sentence processing. Both measures were taken from Boston et al. (2011) and added to the model as separate predictors. All predictions were confirmed. Older readers produced more irregular scanpaths than younger readers. Sentences with short words, high surprisal, or high retrieval cost elicited more irregular scanpath patterns. Additionally, both syntactic measures interacted with age to the effect that older readers had weaker effects of syntax than younger readers. The results thus show that our scanpath measure is sensitive to effects attributable to different levels of processing. Also they show that scanpath analyses can be informative not only when the effects are relatively pronounced, as typically seen in garden-path sentences, but also when the eyes move relatively straight from left to right, that is, when the effects are relatively subtle.
How would an analysis based on traditional eyetracking measures have fared? We have not done a formal comparison but it is easy to see how, for instance, an analysis of regression probability could be problematic: a short word length and a high syntactic difficulty both increase the rate of regressions and therefore increase irregularity. The type of regression may be different, though. In the case of word length, we expect a regression back to the skipped word directly following the skip. Thus, at the short word the eyes hit a snag but that leads only to a small detour in the gaze trajectory. In the case of a syntactic obstacle, the detour may be larger—perhaps the eyes revisit earlier material for rereading? Syntax may therefore have a different impact on scanpaths than word length. Yet, this difference would not be reflected in regression probability. Of course, the difference in this particular example can be captured in other measures, e.g., total reading time, but these measures will fail to distinguish other patterns. Thus, classical eyetracking measures present a puzzle that is difficult to solve. Compared to that, our scanpath metric is a compound measure of all aspects in a scanpath. All spatial and temporal deviations from a regular reading pattern are captured and distinguishable.
5 Conclusions
References
Bates, D. (2005). Fitting linear mixed models in R.R News, 5(1):27–31.
Bicknell, K. and Levy, R. (2010). A rational model of eye movement control in reading. In Hajiˇc, J., editor,Proceedings of the 48th Annual Meeting of the Association for Computational Linguistics, pages 1168–1178, Uppsala, Sweden. Association for Computational Linguistics.
Bicknell, K. and Levy, R. (2011). Why readers regress to previous words: A statistical analysis. InProceedings of the 33rd Annual Meeting of the Cognitive Science Society, Boston, Massachusetts. Cognitive Science Society.
Boston, M. F., Hale, J. T., Kliegl, R., Patil, U., and Vasishth, S. (2008). Parsing costs as predictors of reading difficulty: An evaluation using the Potsdam Sentence Corpus.Journal of Eye Movement Research, 2(1):1–12.
Boston, M. F., Hale, J. T., Vasishth, S., and Kliegl, R. (2011). Parallel processing and sentence comprehension difficulty.Language and Cognitive Processes, 26(3):301–349.
Brandt, S. A. and Stark, L. W. (1997). Spontaneous eye movements during visual imagery reflect the content of the visual scene.Journal of Cognitive Neuroscience, 9(1):27–38.
Brysbaert, M. and Vitu, F. (1998).Word skipping: Implications for theories of eye movement control in reading, chapter 6, pages 125–148. Elsevier, Oxford, England.
Clifton, C., Staub, A., and Rayner, K. (2007).Eye Movements in Reading Words and Sentences, chapter 15, pages 341–374. Elsevier Science Ltd., Amsterdam, Netherlands.
Coco, M. I. and Keller, F. (2012). Scan patterns predict sentence production in the cross-modal processing of visual scenes.Cognitive Science, 36(7):1204–1223.
Cristino, F., Mathôt, S., Theeuwes, J., and Gilchrist, I. D. (2010). ScanMatch: A novel method for comparing fixation sequences.Behavior Research Methods, 42(3):692.
Daniel, P. M. and Whitteridge, D. (1961). The representation of the visual field on the cerebral cortex in monkeys.The Journal of Physiology, 159:203–221.
Drieghe, D., Rayner, K., and Pollatsek, A. (2005). Eye movements and word skipping during reading revisited. Journal of Experimental Psychology: Human Perception and Performance, 31(5):954–969.
Engbert, R., Nuthmann, A., Richter, E. M., and Kliegl, R. (2005). Swift: A dynamical model of saccade generation during reading.Psychological Review, 112(4):777–813.
Fraley, C. and Raftery, A. E. (2002). Model-based clustering, discriminant analysis, and density estimation.Journal of the American Statistical Association, 97(458):611–632.
Fraley, C. and Raftery, A. E. (2007). MCLUST version 3 for R: Normal mixture modeling and model-based clustering. Technical Report 504, Department of Statistics University of Washington, Seattle, WA 98195-4322 USA.
Frazier, L. and Rayner, K. (1982). Making and correcting errors during sentence comprehension: Eye movements in the analysis of structurally ambiguous sentences. Cognitive Psychology, 14(2):178–210.
Hale, J. (2001). A probabilistic Earley parser as a psycholinguistic model. In Kehler, A., Levin, L., and Marcu, D., editors,Proceedings of NAACL 2001, pages 1–8, Morristown, NJ, USA. Association for Computational Linguistics.
Huettig, F., Rommers, J., and Meyer, A. S. (2011). Using the visual world paradigm to study language processing: A review and critical evaluation.Acta Psychologica, 137(2):151–171.
Jarodzka, H., Holmqvist, K., and Nyström, M. (2010). A vector-based, multidimensional scanpath similarity measure. InProceedings of the 2010 Symposium on Eye-Tracking Research & Applications, pages 211–218. ACM.
Josephson, S. and Holmes, M. E. (2002). Attention to repeated images on the world-wide web: Another look at scanpath theory.Behavior Research Methods, 34(4):539–548.
Just, M. A. and Carpenter, P. A. (1980). A theory of reading: From eye fixations to comprehen-sion.Psychological Review, 87(4):329.
Kaiser, E., T. Runner, J., S. Sussman, R., and Tanenhaus, M. K. (2009). Structural and semantic constraints on the resolution of pronouns and reflexives.Cognition, 112(1):55–80.
Kaplan, R. M. (1972). Augmented transition networks as psychological models of sentence comprehension.Artificial Intelligence, 3(1–3):77–100.
Kliegl, R., Grabner, E., Rolfs, M., and Engbert, R. (2004). Length, frequency, and predictability effects of words on eye movements in reading. European Journal of Cognitive Psychology, 16(1/2):262–284.
Kruskal, J. (1964). Multidimensional scaling by optimizing goodness of fit to a nonmetric hypothesis.Psychometrika, 29(1):1–27.
Levenshtein, V. (1966). Binary Codes Capable of Correcting Deletions and Insertions and Reversals.Soviet Physics Doklady, 10(8):707–710.
Lewis, R. L. and Vasishth, S. (2005). An activation-based model of sentence processing as skilled memory retrieval.Cognitive science, 29(3):1–45.
von der Malsburg, T., Kliegl, R., and Vasishth, S. (2012). Determinants of scanpath regularity in reading. Manuscript under revision. Available on request from the first author.
von der Malsburg, T. and Vasishth, S. (2007). A time-sensitive similarity measure for scanpaths. InProceedings of European Conference on Eye Movements, Potsdam, Germany.
von der Malsburg, T. and Vasishth, S. (2011). What is the scanpath signature of syntactic reanalysis? Journal of Memory and Language, 65(2):109–127.
Mathôt, S., Cristino, F., Gilchrist, I. D., and Theeuwes, J. (2012). A simple way to estimate similarity between pairs of eye movement sequences. Journal of Eye Movement Research, 5(1):1–15.
Meseguer, E., Carreiras, M., and Clifton, C. (2002). Overt reanalysis strategies and eye movements during the reading of mild garden path sentences.Memory & Cognition, 30(4):551– 561.
Mitchell, D. C., Shen, X., Green, M. J., and Hodgson, T. L. (2008). Accounting for regressive eye-movements in models of sentence processing: A reappraisal of the Selective Reanalysis hypothesis.Journal of Memory and Language, 59(3):266–293.
Needleman, S. B. and Wunsch, C. D. (1970). A general method applicable to the search for similarities in the amino acid sequence of two proteins. Journal of Molecular Biology, 48(3):443–453.
R Development Core Team (2009).R: A Language and Environment for Statistical Computing. R Foundation for Statistical Computing, Vienna, Austria. ISBN 3-900051-07-0.
Rayner, K. (1975). The perceptual span and peripheral cues in reading.Cognitive Psychology, 7(1):65–81.
Rayner, K. (1998). Eye movements in reading and information processing: 20 years of research.
Psychological Bulletin, 124(3):372–422.
Rayner, K., Reichle, E. D., Stroud, M. J., Williams, C. C., and Pollatsek, A. (2006). The effect of word frequency, word predictability, and font difficulty on the eye movements of young and older readers.Psychology and Aging, 21(3):448–465.
Rovamo, J., Virsu, V., and Näsänen, R. (1978). Cortical magnification factor predicts the photopic contrast sensitivity of peripheral vision.Nature, 271(5640):54–56.
Salvucci, D. D. and Anderson, J. R. (2001). Automated eye-movement protocol analysis.
Human-Computer Interaction, 16(1):39–86.
Schwarz, G. (1978). Estimating the dimension of a model.The Annals of Statistics, 6(2):461– 464.
Vasishth, S., von der Malsburg, T., and Engelmann, F. (2012). What can eye-tracking tell us about sentence processing?WIREs Cognitive Science. In press.
Vitu, F. and McConkie, G. W. (2000).Regressive saccades and word perception in adult reading., chapter 12, pages 301–326. Elsevier, Amsterdam, Netherlands.