The Permutation Test as an Ancillary Procedure for
Comparing Zero-Inflated Continuous Distributions
Jixiang Wu1, Lei Zhang2*, William D. Johnson3
1Departments of Plant Science and Mathematics & Statistics, South Dakota State University, Brookings, USA
2Office of Health Data and Research, Mississippi State Department of Health, Jackson, USA 3Pennington Biomedical Research Center, Louisiana State University System, Baton Rouge, USA
Email: [email protected]
Received January 10,2012; revised February 12, 2012; accepted February 28,2012
ABSTRACT
Empirical estimates of power and Type I error can be misleading if a statistical test does not perform at the stated rejec-tion level under the null hypothesis. We employed the permutarejec-tion test to control the empirical type I errors for zero-inflated exponential distributions. The simulation results indicated that the permutation test can be used effectively to control the type I errors near the nominal level even when the sample sizes are small based on four statistical tests. Our results attest to the permutation test being a valuable adjunct to the current statistical methods for comparing dis-tributions with underlying zero-inflated data structures.
Keywords: Central Limit Theorem; Likelihood Ratio Test; Modified Central Limit Theorem; Permutation Test; Wald Test; Zero-Inflated Distribution
1. Introduction
Statistical analysts sometimes encounter data that have an excessive number of zeros and these data often pre-sent analytical difficulties because traditional methods rely on assumptions that may be unrealistic and plausible transformations may not be found. Many studies have reported on statistical methods for analyzing count data with excessive zeros [1-6]. Some zero inflated data may be viewed as having a mixed distribution where zeros have a point distribution and the distribution of non-zero observations is positive and continuous. This distribution has not been investigated adequately and statistical meth- ods with favorable Type I and Type II errors for com- paring these non-traditional distributions are desired.
Testing equivalence of zero-inflated populations in the context of underlying mixed distributions is equivalent to testing equality of the probabilities of zeros and simulta-neously equality of the parameters of the non-zero ob-servations [7]. The likelihood ratio (LR) [8] and Wald [9] tests are two widely used methods. These two methods typically perform well if the probability density function that applies under the null hypothesis is known. Recently, Monte Carlo simulations were employed to compare several approaches including the LR, Wald, central limit
theorem (CLT), modified central limit theorem (MCLT) tests with respect to their empirical Type I errors and testing powers for three zero-inflated continuous distri-butions [7]. The LR, Wald, and MCLT tests were found to be preferable to the tests based on central limit theory.
There are two important issues when several popula-tions with zero-inflated data structure are compared. First, the underlying distribution is usually unknown and, there-fore, the assumptions of specific distributions can be eas-ily violated by using assumption-constrained methods. Second, empirical Type I errors and testing powers are difficult to determine because the relevant parameters are almost always unknown even if the assumed distribution is correct. Moreover, a small sample size may contribute to higher Type I and Type II errors. Thus, a test that con-trols the empirical Type I errors and yields valid esti-mates of testing powers is helpful.
Permutation tests are advocated for data analysis when assumptions required to validate parametric procedures are violated [10-13]. Unlike parametric tests, permutation tests can generate probabilities by repeatedly “resam-pling” the data and evaluating the obtained results with reference to an empirically derived distribution [14,15]. Permutation tests have two major advantages: 1) they can be used to adjust the empirical Type I errors and the testing powers and, 2) they can be used when some as-sumptions required to justify parametric tests are violated.
Hence, their use may lead to more appropriate statistical conclusions.
The purpose of this study was to investigate the issues raised above pertaining to the use of ancillary permuta-tion tests to compare several populapermuta-tions when the ran-dom variable of interest has either a known or unknown zero-inflated continuous distribution. Four statistical tests were compared with respect to both their empirical type I errors and testing powers. First we assumed the data fol-lowed a zero-inflated exponential distribution as reported by Zhang et al. [7]. Empirical Type I errors and testing powers for these tests were compared with and without adjunct permutation tests by empirical estimates obtained using Monte Carlo simulations. Section 2 describes a general permutation test that generates an empirical prob-ability for each test. Simulated results for four carefully selected parameter configurations are presented in Sec-tion 3. Finally, SecSec-tion 4 demonstrates the results with the permutation test for a data set reported by Koopmans [16].
2. Statistical Methods
2.1. Four Testing Methods
Performances of four tests including the likelihood ratio (LR) [8], Wald [9], central limit theorem (CLT), and modified central limit theorem (MCLT) tests [7] were evaluated. The CLT test considers only the population means calculated over all zero and non-zero observations while the MCLT test considers both the probability of zeros and simultaneously the mean of non-zero observa-tions. The first two tests are distribution-based while the other two are distribution-free based. Maximum likeli-hood (ML) estimators [17] are required for both the LR and Wald tests. For the CLT and MCLT tests, the Wald test was incorporated to derive the probability for each test [7]. These methods were detailed in one of our pre-vious papers [7] and were not repeated in this study.
2.2. Permutation Test
The procedures of using the permutation test in zero- inflated data are:
Step 1: Calculate the p-value using each of the above mentioned four tests (e.g. LR) to analyze the original data;
Step 2: Reshuffle the original data and randomly as-sign the data to different populations without replace-ment;
Step 3: Calculate the p-values by the same method used in Step 1 for the reshuffled data obtained in Step 2;
Step 4: Repeat Steps 2 and 3 “N times”;
Step 5: Construct the sampling distribution of p-values
obtained in Steps 2 through 4;
Step 6: Locate the p-value in this distribution that cor-responds to each p-value calculated in Step 1. If the p- value from the original data is in the main body of the distribution (α/2 to (1 −α/2)), then there is no significant difference at probability level α among populations. Oth-erwise, there is evidence that the difference between (among) populations is significant.
The above procedures from Steps 1 to 6 were applied to all four tests in this study.
3. Simulation Study
3.1. Simulation Procedure
In our empirical investigation we assumed interest was in testing the hypothesis that three zero-inflated distribu-tions had identical means. We simulated data from three zero-inflated distributions with sample sizes ranging from 25 to 300 and performed each of four tests repeatedly using the replicate samples to test the null hypothesis. We tabulated the number of rejections of the hypothesis under each known scenario to estimate Type I errors and powers. Twelve sample sizes (n = 25 × s, where s = 1, 2, ···, 12) were considered and the nominal probability level was set at 0.05 throughout. Although different configura-tions were considered only one was listed for the null distributions and three for alternative distributions as described in Table 1. The first configuration in Table 1 was designed to estimate the empirical Type I errors and the remaining three configurations were designed to es-timate the empirical testing powers. Each set of simu-lated data was analyzed by the four tests with and with-out employment of the permutation test. Repetitions of 1000 simulated samples were used for each case. All simulations were conducted by a C++ program written by the authors of this paper.
3.2. Simulation Results
First the number of permutations sufficient for statistical tests at a given probability level is determined. The Type I errors and testing powers from 100 to 2000 different permutations for configurations 1 and 2 with sample size 200 are summarized in Figures 1 and 2, respectively. These figures clearly demonstrate that both empirical Type I errors and testing powers became reasonably sta-ble after the sample size surpassed 100 permutations. Results from additional simulations for various different sample sizes and configurations showed similar trends. Thus samples of 500 permutations were chosen for all the remaining simulations.
Table 1. Four parameter configurations for the simulation study under zero-inflated exponential distribution.
Design 1, 1 †
2, 2
3, 3
1 0.35, 1.00 0.35, 1.00 0.35, 1.00
2 0.25, 0.75 0.25, 1.00 0.25, 1.25
3 0.15, 0.20 0.35, 0.25 0.55, 0.30
4 0.15, 0.75 0.25, 1.00 0.35, 1.25
Design 1 is for null hypothesis and 2 to 4 are alternative hypotheses. †: δ j
and βj are zero probability level and mean of exponential distribution for jth
population.
Figure 1. Empirical type I errors obtained by 20 different numbers of permutations. (LR = likelihood ratio, CLT = central limit theorem, and MCLT = modified central limit theorem).
Figure 2. Empirical testing powers obtained by 20 different numbers of permutations. (LR = likelihood ratio, CLT = central limit theorem, and MCLT = modified central limit theorem).
differences between observed Type I errors and the nominal 0.05 level tend to be smaller as the sample size increases for all four tests without permutation tests, in-dicating that all these tests tend to perform better as the sample size increases. However, with the permutation tests, the empirical Type I errors are close to the nominal 0.05 level for different methods and various sample sizes including small sample sizes (Table 2). The results indi-cate that the permutation tests can reduce the high Type I
errors that are prevalent with small sample sizes. When the sample sizes are large, i.e., at least 100, the empirical Type I errors for the four statistical methods are almost identical irrespective of using the permutation tests.
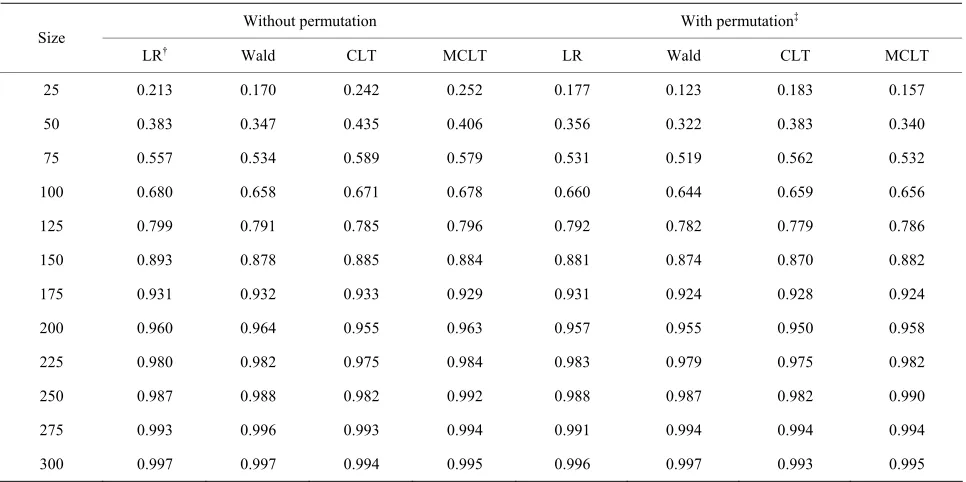
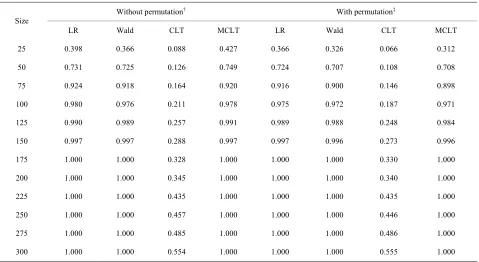
Tables 3-5 present the empirical powers of the four tests for three parameter configurations as defined in Table 1. As expected, the testing power increased for all four tests as the sample size increased. The testing pow-ers obtained without permutation tests were typically lower than those obtained with permutation tests for all methods when the sample size is small (100 and below). However, as the sample size increases, the testing powers were similar irrespective of using permutation tests. As for parameter configuration 2 described in Table 1, the CLT test and the other three tests have similar testing powers because only means for the non-zero observa-tions contributed the differences (Table 3). As for de-signs 3 and 4, the CLT test has an extremely low testing power compared with other three tests (Tables 4 and 5). The increase or decrease of both zero probability level and the non-zero mean made the differences among popu-lations hard to detect with the CLT method, while the other three tests are sensitive and maintain desirable test-ing powers. This indicates that the LR, Wald, and the MCLT tests are better than the CLT test in general. When the zero probability levels among populations are similar, the CLT test is still a good option.
Table 2. Empirical Type I errors for zero-inflated exponential distribution based on 1000 simulations.
Without permutation With permutation‡
Size
LR† Wald CLT MCLT LR Wald CLT MCLT
25 0.060 0.060 0.082 0.101 0.050 0.044 0.061 0.056
50 0.062 0.056 0.060 0.073 0.056 0.051 0.050 0.056
75 0.047 0.048 0.059 0.059 0.047 0.047 0.047 0.046
100 0.046 0.046 0.064 0.062 0.051 0.049 0.061 0.050
125 0.051 0.048 0.055 0.055 0.054 0.054 0.054 0.053
150 0.039 0.038 0.048 0.047 0.045 0.043 0.053 0.041
175 0.042 0.040 0.057 0.043 0.041 0.039 0.054 0.045
200 0.042 0.044 0.052 0.045 0.043 0.044 0.052 0.043
225 0.048 0.054 0.053 0.053 0.043 0.051 0.050 0.050
250 0.049 0.047 0.042 0.051 0.049 0.045 0.038 0.049
275 0.050 0.051 0.055 0.054 0.048 0.048 0.054 0.050
300 0.052 0.053 0.053 0.053 0.055 0.052 0.052 0.051
[image:4.595.57.540.381.622.2]†:LR = likelihood ratio, CLT = central limit theorem, and MCLT = modified central limit theorem; ‡: 500 permutations were used.
Table 3. Empirical testing power for zero-inflated exponential distribution based on 1000 simulations for configuration 2.
Without permutation With permutation‡
Size
LR† Wald CLT MCLT LR Wald CLT MCLT
25 0.213 0.170 0.242 0.252 0.177 0.123 0.183 0.157
50 0.383 0.347 0.435 0.406 0.356 0.322 0.383 0.340
75 0.557 0.534 0.589 0.579 0.531 0.519 0.562 0.532
100 0.680 0.658 0.671 0.678 0.660 0.644 0.659 0.656
125 0.799 0.791 0.785 0.796 0.792 0.782 0.779 0.786
150 0.893 0.878 0.885 0.884 0.881 0.874 0.870 0.882
175 0.931 0.932 0.933 0.929 0.931 0.924 0.928 0.924
200 0.960 0.964 0.955 0.963 0.957 0.955 0.950 0.958
225 0.980 0.982 0.975 0.984 0.983 0.979 0.975 0.982
250 0.987 0.988 0.982 0.992 0.988 0.987 0.982 0.990
275 0.993 0.996 0.993 0.994 0.991 0.994 0.994 0.994
300 0.997 0.997 0.994 0.995 0.996 0.997 0.993 0.995
†:LR = likelihood ratio, CLT = central limit theorem, and MCLT = modified central limit theorem; ‡: 500 permutations were used.
inappropriate distribution was assumed. However, with the permutation tests, the chance to make Type I errors can be greatly decreased, yet the testing powers can be desirable in many cases.
4. Application
Koopmans [16] reported results of a study of seasonal
Table 4. Empirical testing power for zero-inflated exponential distribution based on 1000 simulations for configuration 3.
Without permutation With permutation‡
Size
LR† Wald CLT MCLT LR Wald CLT MCLT
25 0.766 0.810 0.161 0.828 0.771 0.795 0.121 0.746
50 0.984 0.988 0.143 0.988 0.982 0.987 0.125 0.981
75 1.000 1.000 0.151 1.000 0.999 0.999 0.142 0.999
100 1.000 1.000 0.206 1.000 1.000 1.000 0.192 1.000
125 1.000 1.000 0.215 1.000 1.000 1.000 0.203 1.000
150 1.000 1.000 0.270 1.000 1.000 1.000 0.251 1.000
175 1.000 1.000 0.264 1.000 1.000 1.000 0.260 1.000
200 1.000 1.000 0.307 1.000 1.000 1.000 0.299 1.000
225 1.000 1.000 0.330 1.000 1.000 1.000 0.326 1.000
250 1.000 1.000 0.325 1.000 1.000 1.000 0.314 1.000
275 1.000 1.000 0.367 1.000 1.000 1.000 0.351 1.000
300 1.000 1.000 0.398 1.000 1.000 1.000 0.388 1.000
[image:5.595.61.540.401.663.2]†:LR = likelihood ratio, CLT = central limit theorem, and MCLT = modified central limit theorem; ‡: 500 permutations were used.
Table 5. Empirical testing power for zero-inflated exponential distribution based on 1000 simulations for configuration 4.
Without permutation† With permutation‡
Size
LR Wald CLT MCLT LR Wald CLT MCLT
25 0.398 0.366 0.088 0.427 0.366 0.326 0.066 0.312
50 0.731 0.725 0.126 0.749 0.724 0.707 0.108 0.708
75 0.924 0.918 0.164 0.920 0.916 0.900 0.146 0.898
100 0.980 0.976 0.211 0.978 0.975 0.972 0.187 0.971
125 0.990 0.989 0.257 0.991 0.989 0.988 0.248 0.984
150 0.997 0.997 0.288 0.997 0.997 0.996 0.273 0.996
175 1.000 1.000 0.328 1.000 1.000 1.000 0.330 1.000
200 1.000 1.000 0.345 1.000 1.000 1.000 0.340 1.000
225 1.000 1.000 0.435 1.000 1.000 1.000 0.435 1.000
250 1.000 1.000 0.457 1.000 1.000 1.000 0.446 1.000
275 1.000 1.000 0.485 1.000 1.000 1.000 0.486 1.000
300 1.000 1.000 0.554 1.000 1.000 1.000 0.555 1.000
†:LR = likelihood ratio, CLT = central limit theorem, and MCLT = modified central limit theorem; ‡: 500 permutations were used.
Various LR tests were used to identify which parameter(s) were associated with the seasonal differences by assum-ing the data followed a mixture of zero-inflated log- snormal distributions [18]. To illustrate our approach, we
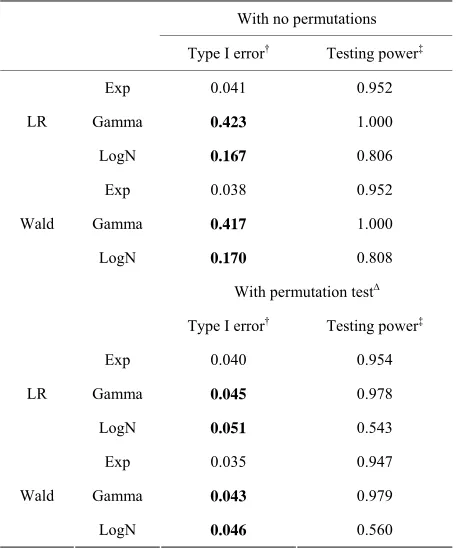
Table 6. Empirical type I errors and testing powers esti-mated by the LR and Wald tests by assuming three differ-ent distributions (expondiffer-ential, Exp, Gamma, and log nor-mal, LogN) as zero-inflated exponential distribution with and without permutation tests based on 1000 simulations for population size 200.
With no permutations
Type I error† Testing power‡
Exp 0.041 0.952
Gamma 0.423 1.000
LR
LogN 0.167 0.806
Exp 0.038 0.952
Gamma 0.417 1.000
Wald
LogN 0.170 0.808
With permutation test∆
Type I error† Testing power‡
Exp 0.040 0.954
Gamma 0.045 0.978
LR
LogN 0.051 0.543
Exp 0.035 0.947
Gamma 0.043 0.979
Wald
LogN 0.046 0.560
† and ‡:Based on design 1 and design 2 in
[image:6.595.59.287.153.427.2]Table 1, respectively; ∆: 500 permutations were used.
Table 7. P-values obtained by different methods by assum-ing zero-inflated exponential distribution for the Koop-mans’s data (1981) with and without permutation tests.
Method† No permutations With permutations
CLT 0.033 0.050
MCLT 0.031 0.041
LR 0.052 0.024
Wald 0.043 0.018
Note: 1000 permutation tests were used; †: LR = likelihood ratio, CLT =
central limit theorem, and MCLT = modified central limit theorem.
employment of the permutation tests, indicated that the mice distances differed significantly among the three seasons.
5. Discussion
It is desired that a statistical method sustains a preset nominal Type I error and a high testing power. Many methods are based on the appropriate statistical assump-tions and require a large sample size. In some situaassump-tions,
the sample size may be very small and test statistics may yield unfavorable Type I errors and testing powers. In addition, the real distribution is often unknown so desir-able testing properties cannot be expected on employing distribution-based tests. In this study, we investigated statistical properties of the permutation tests integrated with four distribution-based tests to compare populations with zero-inflated data structures. Based on the results from the simulated zero-inflated exponential data, several conclusions can be made on use of the permutation test: 1) high Type I error caused by the appropriate statistical tests without the permutation test for small sample sizes can be adjusted to the preset nominal level when the permutation test is used; 2) high Type I errors caused by the inappropriate assumptions can be adjusted to the pre-set nominal level; and 3) for a large data pre-set, both the type I errors and testing powers are similar regardless the use of the permutation test for appropriate distribution assumptions. The same conclusions applied for the other two types of zero-inflated continuous distributions includ- ing gamma and lognormal distributions (results not shown).
As reported by Zhang et al. [7] and in results of this study, the LR and Wald tests hold similar type I errors and testing powers but they are distribution dependent. If an inappropriate distribution is assumed, both inflated Type I errors and low testing powers can occur (Table 6). The CLT test is data structure dependent because it con-siders only the population mean including zeros. When the population means are similar (because the popula-tions have similar probabilities of observapopula-tions equal to zero) and their non-zero observations have similar dis-tributions, then the CLT test may have statistical proper-ties similar to the other three tests. The MCLT test con-siders two parameters: the zero probability and non-zero mean and thus is better than the CLT test and robust for most cases. In addition, high Type I errors caused by the MCLT test can be adjusted by the permutation test for small sample size. Therefore, the MCLT test can be recommended for general use regardless whether the data distribution is known or unknown. Numerical investiga-tion on other types of distribuinvestiga-tions should help gain more information regarding the MCLT method.
Even though the permutation test showed several ma-jor advantages, the LR and Wald test still sustain desir-able Type I errors and testing powers and are not as computationally intensive when the distribution for a large data set is known or the assumed distributions are appropriate. Nevertheless, the permutation test could be a valuable addition to the current statistical tests especially when a data set is small or the distribution is unknown.
REFERENCES
[image:6.595.59.286.498.584.2]tical Analysis of Finite Mixture Distributions,” John Wiley and Sons, New York, 1985.
[2] J. Lawless, “Negative Binomial and Mixed Poisson Re- gression,” Canadian Journal of Statistics, Vol. 15, No. 3, 1987, pp. 209-225. doi:10.2307/3314912
[3] D. C. Heibron, “Generalized Linear Models for Altered Zero Probability and Overdispersion in Count Data,” SIMS Technical Report No. 9, University of California, San Francisco, 1989.
[4] R. Schall, “Estimation in Generalized Linear Models with Random Effects,” Biometrika, Vol. 78, No. 4, 1991, pp. 719-727. doi:10.1093/biomet/78.4.719
[5] C. E. McCulloch, “Maximum Likelihood Algorithms for Generalized Linear Mixed Models,” Journal of American Statistical Association, Vol. 92, No. 437, 1997, pp. 162- 170.
[6] D. B. Hall, “Zero-Inflated Poisson and Binomial Regres- sion with Random Effects: A Case Study,” Biometrics, Vol. 56, No. 4, 2000, pp. 1030-1039.
doi:10.1111/j.0006-341X.2000.01030.x
[7] L. Zhang, J. Wu and W. D. Johnson, “Empirical Study of Six Tests for Equality of Populations with Zero-Inflated Continuous Distributions,” Communications in Statistics
—Simulation and Computation, Vol. 39, No. 6, 2010, pp. 1196-1211. doi:10.1080/03610918.2010.489169
[8] G. Casella and R. L. Berger, “Statistical Inference,” Dux- bury Inc., San Francisco, 2002.
[9] A. Wald, “Tests of Statistical Hypotheses Concerning Several Parameters When the Number of Observations Is Large,” Transactions in American Mathematical Society, Vol. 54, No. 3, 1943, pp. 426-482.
[10] E. S. Edgington, “Statistical Inference and Nonrandom Samples,” Psychological Series A, Vol. 66, No. 6, 1966, pp. 485-487. doi:10.1037/h0023916
[11] B. E. Wampold and N. L. Worsham, “Randomization Tests for Multiple Baseline Designs,” Behavioral As- sessment, Vol. 8, 1986, pp. 135-143.
[12] R. C. Blair and W. Karniski, “An Alternative Method for Significance Testing of Waveform Difference Potentials,”
Psychophysiology, Vol. 30, No. 5, 1993, pp. 518-524. doi:10.1111/j.1469-8986.1993.tb02075.x
[13] D. C. Adams and C. D. Anthony, “Using Randomization Techniques to Analyze Behavioural Data,” Animal Be- haviour, Vol. 61, No. 1, 1996, pp. 733-738.
doi:10.1006/anbe.2000.1576
[14] J. Ludbrook and H. Dudley, “Why Permutation Tests Are Superior to t and F Tests in Biomedical Research,”
American Statistician Association, Vol. 52, No. 2, 1998, pp. 127-132.
[15] A. F. Hayes, “Randomization Tests and Equality of Vari- ance Assumption When Comparing Group Means,” Ani- mal Behaviour, Vol. 59, No. 3, 2000, pp. 653-656. doi:10.1006/anbe.1999.1366
[16] L. H. Koopman, “Introduction of Contemporary Statisti-cal Methods,” 2nd Edition, Duxbury Press, Boston, 1981. [17] J. Aitchison, “On the Distribution of a Positive Random
Variable Having a Discrete Probability Mass at the Ori- gin,” Journal of American Statistical Association, Vol. 50, No. 271, 1995, pp. 901-908.