GRAIN SIZE ANALYSIS AND CHARACTERIZATION OF SEDIMENTARY ENVIRONMENT ALONG
MANAKUDY ESTUARY, TAMIL NADU, INDIA
Sheela, M. S. and
Department of Chemistry and Research
ARTICLE INFO ABSTRACT
Grain size analysis of Manakudy
and textural parameters namely mean, sorting, skewness and kurtosis. Textural pattern shows complicated profile as a result of the fluctuation in the physicochemical conditions due to the sediments and the marine inter
prevalence of comparatively moderate
monsoon the abundance of fine sand shows high energy condition. LDF results show the dominance of shallow marine deposits in the Aeolian beach and the influence of turbidity. The granulometric and CM pattern indicates most of the grains from by bottom suspension rolling to graded suspension condition. The comparison with the tractive current diagram, al
environment, that is by interaction with wave actions.
Copyright © 2015 Sheela and Sugirtha Kumar. This
unrestricted use, distribution, and reproduction in any medium, provided the original work is properly cited.
INTRODUCTION
The complex coastal processes operated in the past and operating today have left their imprints in the sediments. In this regard, the sediment logy of beach sediments plays a vital role in documenting the depositional history of a region (Angusamy and Rajamanickam, 2007).The difference in size distribution is mainly due to variation in wave energy reaching the point of sampling and extent of turbulence affecting the environment. Tidal flats are defined as “sandy to muddy or marshy flats emerging during low tide and submerging during high tide (Reineck, 1972). The particle size analysis is one of the most powerful tools available for the interpretation of any population of sedimentary particles and is a prerequisite to understand their roles in a set of sedimentary processes (Swift
et al., 1972). Tubbs (1977) found that the organic and nutrient contents in intertidal sediments got negative correlation to particle size. The contaminant concentration is related to the spatial variation of sediment grain size.
Wall et al., (1978) found that the sediment samples not pre treated before particle size analysis, the percentage of total clay found in the silt and sand size aggregates can range from 15 to 60%. Unconsolidated sedimemts were mapped by grain size and percent calcium carbonate and the sand was classified
*Corresponding author: Sugirtha Kumar, P.
Department of Chemistry and Research centre, Women’s Christian College, Nagercoil, Tamil Nadu, India.
ISSN: 0975-833X
Article History:
Received 27th December, 2014
Received in revised form 18th January, 2015
Accepted 27th February, 2015
Published online 17th March,2015
Key words:
Sediment, Grain size, Manakudy, Tamil Nadu, Estuary.
RESEARCH ARTICLE
GRAIN SIZE ANALYSIS AND CHARACTERIZATION OF SEDIMENTARY ENVIRONMENT ALONG
MANAKUDY ESTUARY, TAMIL NADU, INDIA
Sheela, M. S. and *Sugirtha Kumar, P.
Department of Chemistry and Research Centre, Women’s Christian College, Nagercoil, Tamil Nadu, India
ABSTRACT
Grain size analysis of Manakudy estuary around mangrove forest, Tamil Nadu, India has been studied and textural parameters namely mean, sorting, skewness and kurtosis. Textural pattern shows complicated profile as a result of the fluctuation in the physicochemical conditions due to the sediments and the marine interactions. Abundance of the medium sand to fine sand shows the prevalence of comparatively moderate- to low-energy condition in the Mankudy mangrove area. In monsoon the abundance of fine sand shows high energy condition. LDF results show the dominance allow marine deposits in the Aeolian beach and the influence of turbidity. The granulometric and CM pattern indicates most of the grains from by bottom suspension rolling to graded suspension condition. The comparison with the tractive current diagram, al
environment, that is by interaction with wave actions.
This is an open access article distributed under the Creative Commons Att use, distribution, and reproduction in any medium, provided the original work is properly cited.
The complex coastal processes operated in the past and operating today have left their imprints in the sediments. In of beach sediments plays a vital role in documenting the depositional history of a region
The difference in size distribution is mainly due to variation in wave energy reaching the point of sampling and extent of turbulence affecting the environment. Tidal flats are defined as “sandy to muddy or tide and submerging during high tide (Reineck, 1972). The particle size analysis is one of the most powerful tools available for the interpretation of any population of sedimentary particles and is a prerequisite to entary processes (Swift 1972). Tubbs (1977) found that the organic and nutrient contents in intertidal sediments got negative correlation to particle size. The contaminant concentration is related to the
(1978) found that the sediment samples not pre treated before particle size analysis, the percentage of total clay found in the silt and sand size aggregates can range from 15 to 60%. Unconsolidated sedimemts were mapped by grain ent calcium carbonate and the sand was classified
Department of Chemistry and Research centre, Women’s Christian College,
according to biogenic constituents. Sediment play an impo role in controlling the water chemistry of rivers and it often dominates the flux of many contaminants through river systems. In particular fine grained suspended particulate material (<0.63 mm) is an important transport vector of phosphorus in rivers. Compared to larger grain size fractions, sediment <0.63 mm is generally more active geochemically (Ongley et al.,1982) and can remain suspended for longer periods of time (Lick, 1982) thus promoting the transport of surface bound P. Macrophytes have the
nitrogen and phosphorus thereby accelerating the nutrient turnover in the aquatic ecosystems (Brock
More over the quantum of transported toxic substances such as heavy metals, radio nuclides, nutrients etc. are controlled to a large extent by the grain size of the riverine sediments (Salomons and Forstner, 1984). There are also vast amounts of colloids and clay aggregates circulating in the basin, which is characteristics of the wash load (Ko
Mudroch (1989) reported the sorption data for individual grain size fractions of summer sediment with the results obtained for sediment grain size fractions collected during autumn. They also noted that the shaking of the composite se
may have resulted in the further breakdown of water stable aggregates into constituent smaller grain size fractions. The increased mass of smaller size fractions in solution would potentially result in an increased release of phosphate into solution. Mud (silt and clay) in the marine environment is
Available online at http://www.journalcra.com
International Journal of Current Research Vol. 7, Issue, 03, pp.13265-13275, March, 2015
INTERNATIONAL
GRAIN SIZE ANALYSIS AND CHARACTERIZATION OF SEDIMENTARY ENVIRONMENT ALONG
, Women’s Christian College, Nagercoil, Tamil Nadu, India
, Tamil Nadu, India has been studied and textural parameters namely mean, sorting, skewness and kurtosis. Textural pattern shows complicated profile as a result of the fluctuation in the physicochemical conditions due to the actions. Abundance of the medium sand to fine sand shows the energy condition in the Mankudy mangrove area. In monsoon the abundance of fine sand shows high energy condition. LDF results show the dominance allow marine deposits in the Aeolian beach and the influence of turbidity. The granulometric and CM pattern indicates most of the grains from by bottom suspension rolling to graded suspension condition. The comparison with the tractive current diagram, all the season fall in tractive current
is an open access article distributed under the Creative Commons Attribution License, which permits
according to biogenic constituents. Sediment play an important role in controlling the water chemistry of rivers and it often dominates the flux of many contaminants through river systems. In particular fine grained suspended particulate material (<0.63 mm) is an important transport vector of s. Compared to larger grain size fractions, sediment <0.63 mm is generally more active geochemically 1982) and can remain suspended for longer periods of time (Lick, 1982) thus promoting the transport of surface bound P. Macrophytes have the ability to accumulate nitrogen and phosphorus thereby accelerating the nutrient turnover in the aquatic ecosystems (Brock et al., 1983).
easily dispersed by currents and waves and may serve as good tracers for their sources. Inorganic and organic chemicals from different sources tend to concentrate in the mud fraction as particulate matter or be absorbed onto particulate mineralogical particles. The composition of the mud fraction in the sea may be of environmental significance (Behiary et al.,1991). The smaller the size of the sediment fraction, the higher the content of contaminant accumulates in sediments (Whitney, 1975; Martincic et al., 1990). Studying grain size distribution of sediment is needed due to particular benefit to environmental management of estuarine area which is sensitive to natural processes and human activities. The grain size of the sediments in the basin is determinate by silt and clay sizes (Orfeo, 1999).
The grain size distribution is an important property to understand the hydrodynamic condition, biogeochemical cycle and contaminated process. Deposition is generally associated with low energy environments where fine grained material tends to accumulate. Whereas, where erosion dominates, sediment is over- consolidated (Dyer et al., 2000). The grain size properties can suggest sources and hydrodynamic conditions of marine sediments (Carranza – Edwards et al.,
2005). Based on a number of environmental variables the grain size distribution of suspended sediment in fluvial systems can vary both on an event basis (Horowitz et al., 1989) or on a seasonal basis (Walling and Moorehead, 1989; Stone and Saunderson, 1992). Intertidal area exhibits heterogeneous sediments in regard to grain size distribution from land to the sea ward, which resulted from environment of sediment transportation and deposition and hydrodynamic conditions (tidal energy, wave and tidal current) in the estuarine area.
Erema et al. (2013) reported, grain size analysis show that sediments from the Azuabie creek were generally sandy mud in nature with textural characteristics being fairly constant over the study period. Sediments with fine particles provide better surface areas for pollutants to adsorb than those with coarse particles. The nature of the sediment and the organic matter composition also determine the benthic community structure found in particular sediments.
MATERIALS AND METHODS
Study location
Kanyakumari District is located on the Southern extremity of the Indian Peninsula between lat 802’ and 804’N and between long 77026’ and . 77030’E The district receives heavy rains during the South West (June to August) and North East monsoons (October to December). Pazhayar is one of the main river systems in the District and this river takes its origin at the Western ghats. From the place of its origin it traverses 23.1km before entering the Arabian Sea through the Manakudy estuary.
The Manakudy estuary is the confluence of river Pazhayar and has an area of about 150ha. It is a sand built estuary connected to the sea during the rainy season. During the period of total occlusion of the river mouth, the estuarine water swells due to heavy inflow of water from the head of the estuary and also by the land drainage. During heavy inflow into the estuary the
sand bar opens up under the force of gravity. Compared to the expanse of the estuarine area, the bar mouth is relatively small and even during summer months the local people cut open the bar mouth and the estuary has open access to the sea. Manakudy estuary abounds with fishery resources and has neighbouring fishing helmets. There are no major industries, however three small-scale industries, viz coconut husk retting, lime shell dredging and salt works are well established on the banks of the estuary. Further there is large scale sand mining at the head of the estuary.
The Manakudy estuary has a luxuriant growth of mangrove forests on the mudflats. However due to pollution from industrial effluents and domestic sewage from the fishermen settlements, there is a threat to this ecosystem. The increase and spred of salt pans have also adversely affects the mangroves. This Manakudy mangrove was also devastated by the Indian Ocean Tsunami. The baseline information on the nutrients and trace metal concentrations, the patterns as well as on linkages and interrelationship between the ecosystem is still lacking. The present investigation is proposed to understand and assess the nutrients, trace metals in sediments and water and primary productivity of the Manakudy mangrove ecosystem.
In order to study the state of health of the Manakudy estuary seven stations were selected around the mangrove forest of the estuary. The results of the present investigation are based on the analyses of month (February 2013, May 2013 and October 2013) collections of sediments from seven stations.
Seasonal study
Based on the duration of the monsoon three seasons are recognized and the data are grouped into three categories viz. Pre monsoon season , monsoon season and post monsoon season.
Description of study area
The bulk sample was reduced by coning and quartering, and a 100-g portion of the sample was selected for laboratory analysis. Organic matter and ferruginous coatings were removed from the samples by treatment with 30 % by volume H2O2 and SnCl2. After this pre treatment, the samples were sifted at 0.50 ø intervals through ASTM sieve (from +18 to +230 mesh sizes)sets using a Ro-Tap sieve shaker for 15 min. The sieved materials were collected and weighed. The carbonates present in the sediments were estimated after sieving by treatment with 1:10 HCl. Weight percentage frequencies and cumulative weight percentage frequencies were computed (Folk and Ward 1957). The sieved materials were weighed separately. Then the fractions were properly tabulated and the sands of the respective fractions were kept for further studies. The grain size parameters like graphic mean (Mz), inclusive graphic standard deviation (SD), inclusive graphic skewness (Sk1) and graphic kurtosis (KG) were determined using the software package (Fig. 2). The various graphic and moment measures were calculated with the formulae of Folk and Ward (1957).
Fig. 1. Location map of study area in water
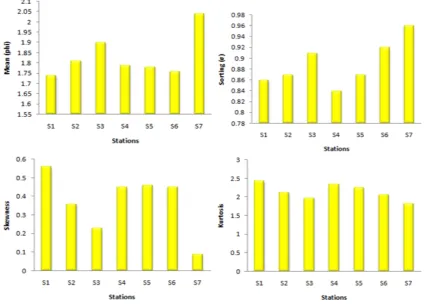
Fig. 2. Average values of grain size statistical parameters, Manakudy estuary: a mean vs sorting; b sorting vs skewness; c skewness and kurtosis
[image:3.595.87.512.455.759.2]RESULTS AND DISCUSSION
Textural attributes of sediments, viz. mean (Mz), sorting (SD), skewness (Ski) and kurtosis (KG) are widely used to reconstruct the depositional environment of sediments (Angusamy and Rajamanickam 2006). Correlation between size parameters and transport processes/depositional mechanisms of sediments has been established by exhaustive studies from many modern and ancient sedimentary environments (Folk and Ward 1957; Mason and Folk 1958; Friedman 1967; Visher 1969; Valia and Cameron 1977; Wang
et al., 1998; Asselman 1999; Malvarez et al., 2001; Ramamohanarao et al., 2003; Suresh Gandhi et al., 2008; Ramanathan et al., 2009; Anithamary et al., 2011).
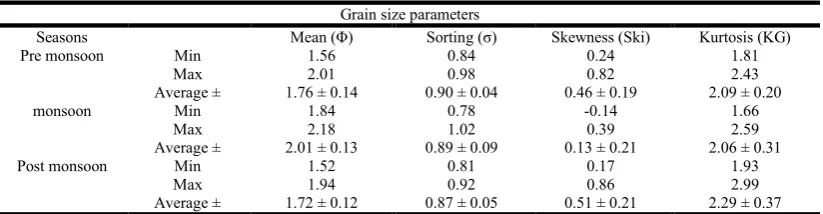
Table 1 shows the descriptive statistics of the different grain size parameters. Table 2 summarises parameters for the different sampling sectors. Friedman (1962) suggested that the extreme high or low values of kurtosis imply that part of sediment achieved its sorting elsewhere in high-energy environment.
Variation in the kurtosis values is a reflection of the flow characteristic of the depositing medium (Baruah et al., 1997; Ray et al., 2006), and the dominance of finer size of platykurtic nature of sediments reflects the maturity of the sand. This may be due to the aggregation of sediment particle size by compaction, and the variation in the sorting values are likely due to continuous addition of finer/coarser materials in varying proportions (Ramanathan et al., 2009).
CS coarse sand, MS medium sand, FS fine sand, WS well sorted, MWS moderately well sorted, MS moderately sorted, PS poorly sorted, VFS very fine skew, FS fine skew, NS near symmetry, CS coarse skewed, VPK very platykurtic, PK platykurtic, MK mesokurtic, LK leptokurtic, VLK very leptokurtic
Bivariate scatter graphs of grain size parameters
[image:4.595.97.509.324.431.2]Sedimentalogists have attempted to use scatter graphs of grain size parameters to distinguish between different depositional settings, via bivariate plots, which are based on the assumption
Table 1. Descriptive statistical analysis for the grain size parameters
Grain size parameters
Seasons Mean (Φ) Sorting (σ) Skewness (Ski) Kurtosis (KG)
Pre monsoon Min 1.56 0.84 0.24 1.81
Max 2.01 0.98 0.82 2.43
Average ± 1.76 ± 0.14 0.90 ± 0.04 0.46 ± 0.19 2.09 ± 0.20
monsoon Min 1.84 0.78 -0.14 1.66
Max 2.18 1.02 0.39 2.59
Average ± 2.01 ± 0.13 0.89 ± 0.09 0.13 ± 0.21 2.06 ± 0.31
Post monsoon Min 1.52 0.81 0.17 1.93
Max 1.94 0.92 0.86 2.99
[image:4.595.34.572.464.543.2]Average ± 1.72 ± 0.12 0.87 ± 0.05 0.51 ± 0.21 2.29 ± 0.37
Table 2. Descriptive statistic sediment remarks - Pre monsoon
Stations Mean (phi) Remarks Sorting (σ) Remarks Skewness (Ski) Remarks Kurtosis (KG) Remarks
S1 1.65 Medium sand 0.92 Moderately sorted 0.59 Very fine skewed 2.08 Very leptokurtic
S2 1.76 Medium sand 0.84 Moderately sorted 0.35 Very fine skewed 2.09 Very leptokurtic
S3 1.81 Medium sand 0.90 Moderately sorted 0.32 Very fine skewed 1.94 Very leptokurtic
S4 1.80 Medium sand 0.90 Moderately sorted 0.51 Very fine skewed 2.26 Very leptokurtic
S5 1.75 Medium sand 0.92 Moderately sorted 0.45 Very fine skewed 2.04 Very leptokurtic
S6 1.56 Medium sand 0.89 Moderately sorted 0.82 Very fine skewed 2.43 Very leptokurtic
[image:4.595.40.568.576.655.2]S7 2.01 Fine sand 0.98 Moderately sorted 0.24 Fine skewed 1.81 Very leptokurtic
Table 3. Descriptive statistic sediment remarks – Monsoon
Stations Mean (phi) Remarks Sorting (σ) Remarks Skewness (Ski) Remarks Kurtosis (KG) Remarks
S1 2.05 Fine sand 0.86 Moderately sorted 0.23 Fine skewed 2.23 Very leptokurtic
S2 1.90 Medium sand 0.88 Moderately sorted 0.28 Fine skewed 2.09 Very leptokurtic
S3 2.16 Fine sand 0.92 Moderately sorted -0.14 Coarse skewed 1.93 Very leptokurtic
S4 1.93 Medium sand 0.82 Moderately sorted 0.24 Fine skewed 2.16 Very leptokurtic
S5 1.84 Medium sand 0.78 Moderately sorted 0.39 Very fine skewed 2.59 Very leptokurtic
S6 2.02 Fine sand 1.02 Poorly sorted 0.07 Near symmetry 1.66 Very leptokurtic
[image:4.595.44.566.686.767.2]S7 2.18 Fine sand 0.99 Moderately sorted -0.14 Coarse skewed 1.77 Very leptokurtic
Table 4. Descriptive statistic sediment remarks - Post monsoon
Stations Mean (phi) Remarks Sorting (σ) Remarks Skewness (Ski) Remarks Kurtosis (KG) Remarks
S1 1.52 Medium sand 0.81 Moderately sorted 0.86 Very fine skewed 2.99 Very leptokurtic
S2 1.77 Medium sand 0.88 Moderately sorted 0.45 Very fine skewed 2.19 Very leptokurtic
S3 1.74 Medium sand 0.9 Moderately sorted 0.51 Very fine skewed 2.09 Very leptokurtic
S4 1.64 Medium sand 0.81 Moderately sorted 0.6 Very fine skewed 2.62 Very leptokurtic
S5 1.75 Medium sand 0.92 Moderately sorted 0.55 Very fine skewed 2.12 Very leptokurtic
S6 1.71 Medium sand 0.86 Moderately sorted 0.45 Very fine skewed 2.12 Very leptokurtic
S7 1.94 Medium sand 0.91 Moderately sorted 0.17 Fine skewed 1.93 Very leptokurtic
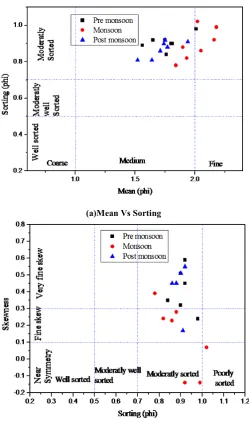
that these statistical parameters reliability reflect differences in the fluid-flow mechanisms of sediment transportation and deposition (Sutherland and Lee 1994). Figure 3a shows the relationship between mean grain size and sorting for the Manakudy estuary. There is a clustering in coarse and moderately well sorted. Griffths (1967) explained that both mean grain size and sorting are hydraulically controlled, so that in all sedimentary environments the best-sorted sediments have mean size in the fine sand size range. Figure 3b shows the relationship between sorting and skewness for the Manakudy estuary. Sediments are well sorted and fine skew towards very fine skew fractions.
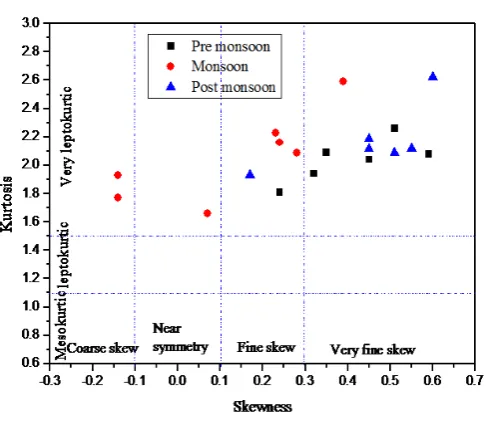
By contrast, well sorted sediments are mainly clustered around the very fine skew range and have positive skewness values. Plotting of skewness against kurtosis is a powerful tool for interpreting the genesis of sediment, by quantifying the degree of normality of its size distribution (Folk 1966) Fig. 3c shows that the sediments from Manakudy estuary lie within the positively skewed/ leptokurtic range. This suggests that the dominance of medium grain size population and the subordinate of coarse and fine grain size which gives positive skewness. However, most of the sediments from the Manakudy estuary show mixing of different size-range sediment populations, with one predominant population and a very subordinate population.
Generally, most beach sediments are slightly negative skewed because of a small proportion of coarse grains (Folk 1966). Friedman (1962) showed that most sands are leptokurtic and are either positively or negatively skewed. This could be explained by the fact that most sands consist of two populations: one predominant population and one very subordinate, coarse (leading to negative skewness) to fine (leading to positive skewness). In Manakudy estuary, both pre and post monsoon all stations had positively skewed but in monsoon S3 and S7 had negatively skewed other stations had positively skewed (Table 2-4).
(a)Mean Vs Sorting
[image:5.595.309.559.309.731.2](b) Sorting Vs Skewness
Table 5. Summery of grain size statistical parameters (in percentage of the total number at each sector)
Summary of grain size statistical parameters
Mean (Φ) S1 S2 S3 S4 S5 S6 S7
CS 0 0 0 0 0 0 0
MS 66.67 100 66.67 100 100 66.67 33.33
FS 33.33 0 33.33 0 0 33.33 67.67
Sorting (σ)
WS 0 0 0 0 0 0 0
MWS 0 0 0 0 0 0 0
MS 100 100 100 100 100 66.67 100
PS 0 0 0 0 0 33.33 0
Skewness (Ski)
VFS 66.67 66.67 66.67 66.67 100 66.67 33.33
FS 33.33 33.33 0 33.33 0 0 33.33
NS 0 0 0 0 0 33.33 0
CS 0 0 33.33 0 0 0 33.33
Kurtosis(KG)
VPK 0 0 0 0 0 0 0
PK 0 0 0 0 0 0 0
MK 0 0 0 0 0 0 0
LK 0 0 0 0 0 0 0
VLK 100 100 100 100 100 100 100
(c)Skewness Vs Kurtosis
Fig. 3 Sector plot showing the bivariate relationship between (a) the grain size (phi) and sorting (b) sorting and skewness, (c)
skewness and kurtosis
Linear discriminate function
According to Sahu (1964), the statistical method of analysis of the sediments to interpret the variations in the energy and fluidity factors seems to have excellent correlation with the different processes and the environment of deposition. Linear discriminate function (LDF) analysis of the sediment samples was carried out using the following equations:
Aeolian/beach
Y1 (A:B) = -3.5688 M + 3.7016 r2 – 2.0766 SK + 3.1135 KG
If Y is >−2.7411, the environment is ‘Beach’ but if Y is <−2.7411, the environment is ‘Aeolian’.
Beach/shallow agitated water
Y2 (B:SM) = 15.6534 M + 65.7091 r
2
+ 18.1071 SK + 18.5043 KG
If Y is <63.3650, the environment is ‘Beach’ but if Y is >63.3650, the environment is ‘Shallow marine’.
Shallow marine/fluvial environment
Y3(SM:F) = 0.2852 M – 8.7604 r2 – 4.8932SK + 0.0482KG
If Y is >−7.4190, the environment is ‘Shallow marine’ but if Y is <−7.4190, the environment is ‘Fluvial’.
Fluvial/turbidity
Y4 (F:Turb) = 0.7215M + 0.403r2 + 6.7322SK + 5.2927KG
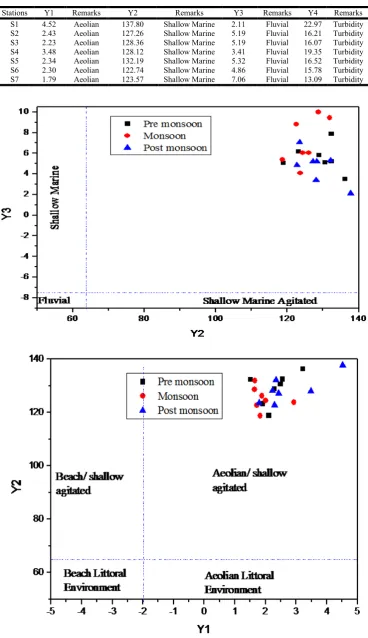
If Y is >10.000, the environment is ‘Turbidity’ but if Y is <10.000, the environment is ‘Fluvial’. (Y1 = aeolian/beach, Y2 = beach/shallow marine, Y3 = shallow marine/fluvial, Y4 = fluvial/turbidity)
The process and environment of deposition were deciphered by Sahu’s linear discriminate functions of Y1 (aeolian, beach), Y2 (beach, shallow agitated water), Y3 (shallow marine, fluvial) and Y4 (turbidity, fluvial). With reference to the Y1 and Y2 values, all the samples fall (100 %) in an aeolian process (Y1) and all the samples (100 %) fall in shallow marine waters (Y2) respectively. Further, all the samples (100 %) fall in the (Y3) fluvial, Y4 values show that about 100 % of the samples were deposited by turbidity action (Fig. 4).
CM pattern
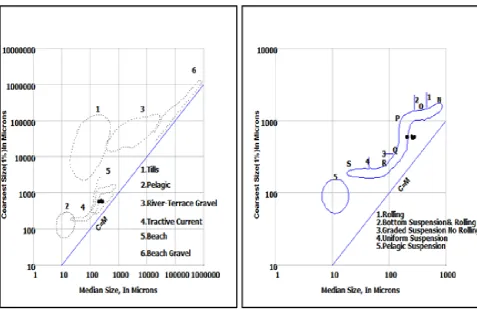
Grain size parameters and the plots of CM patterns help to distinguish between the sediments of different environments of fluvial and deltaic deposits (Passega, 1964; Visher, 1969). In the present study, an attempt has been made to identify the modes of deposition of sediments of the Manakudy estuary by CM pattern. Parameter C (one percentile of the grain size distribution) and M (the median) were plotted with phi values of the C and M obtained from cumulative curves in microns (Fig. 5-7). The relation between C and M is the effect of sorting by bottom turbulence. CM pattern is subdivided into three segments namely, NO (rolling), OPQ (bottom suspension and rolling), QR (graded suspension no rolling), RS (uniform suspension), S (pelagic suspension). The plotted results of Manakudy estuary sediments (pre monsoon, monsoon and post monsoon) shows that all the samples fall in bottom suspension rolling to graded suspension condition. The comparison with the tractive current diagram, the samples fall in beach and tractive current environment, that is by interaction with wave actions (Fig. 5-7).
Table 6. LDF sediment remarks - Pre monsoon
Stations Y1 Remarks Y2 Remarks Y3 Remarks Y4 Remarks
S1 2.49 Aeolian 130.61 Shallow Marine 5.09 Fluvial 16.51 Turbidity
S2 2.11 Aeolian 118.92 Shallow Marine 5.07 Fluvial 14.97 Turbidity
S3 1.91 Aeolian 123.24 Shallow Marine 6.13 Fluvial 14.05 Turbidity
S4 2.55 Aeolian 132.45 Shallow Marine 5.22 Fluvial 17.02 Turbidity
S5 2.30 Aeolian 128.90 Shallow Marine 5.81 Fluvial 15.43 Turbidity
S6 3.22 Aeolian 136.28 Shallow Marine 3.48 Fluvial 19.82 Turbidity
[image:6.595.114.485.724.805.2]S7 1.51 Aeolian 132.40 Shallow Marine 7.89 Fluvial 13.03 Turbidity
Table 7. LDF sediment remarks – Monsoon
Stations Y1 Remarks Y2 Remarks Y3 Remarks Y4 Remarks
S1 1.88 Aeolian 126.11 Shallow Marine 6.04 Fluvial 15.12 Turbidity
S2 2.01 Aeolian 124.37 Shallow Marine 6.05 Fluvial 14.62 Turbidity
S3 1.72 Aeolian 122.60 Shallow Marine 8.81 Fluvial 11.17 Turbidity
S4 1.82 Aeolian 118.70 Shallow Marine 5.37 Fluvial 14.71 Turbidity
S5 2.93 Aeolian 123.76 Shallow Marine 4.07 Fluvial 17.90 Turbidity
S6 1.66 Aeolian 131.96 Shallow Marine 9.42 Fluvial 11.13 Turbidity
S7 1.64 Aeolian 128.74 Shallow Marine 9.97 Fluvial 10.39 Turbidity
Table 8. LDF sediment remarks - Post monsoon
Stations Y1 Remarks Y2 Remarks Y3 Remarks Y4 Remarks
S1 4.52 Aeolian 137.80 Shallow Marine 2.11 Fluvial 22.97 Turbidity
S2 2.43 Aeolian 127.26 Shallow Marine 5.19 Fluvial 16.21 Turbidity
S3 2.23 Aeolian 128.36 Shallow Marine 5.19 Fluvial 16.07 Turbidity
S4 3.48 Aeolian 128.12 Shallow Marine 3.41 Fluvial 19.35 Turbidity
S5 2.34 Aeolian 132.19 Shallow Marine 5.32 Fluvial 16.52 Turbidity
S6 2.30 Aeolian 122.74 Shallow Marine 4.86 Fluvial 15.78 Turbidity
S7 1.79 Aeolian 123.57 Shallow Marine 7.06 Fluvial 13.09 Turbidity
Fig. 4. LDF values plot for Manakudy estuary samples
Fig. 5. CM diagram (Passega 1957, 1964) and tractive current deposit plot for Pre monsoon
[image:8.595.69.543.364.711.2]Fig. 6. CM diagram (Passega 1957, 1964) and tractive current deposit plot for Monsoon
Fig. 7. CM diagram (Passega 1957, 1964) and tractive current deposit plot for Post monsoon
Conclusion
Textural analysis indicates the dominance of medium to fine grained in premonsoon samples. Fine to medium grained sediments dominant in monsoon samples. Medium sand in post monsoon samples due to high energy condition.LDF results show the dominance of shallow marine deposits in the Aeolian beach and the influence of turbidity. The granulometric and CM pattern indicates most of the grains from by bottom suspension rolling to graded suspension condition. The comparison with the tractive current diagram, all the season fall in tractive current environment, that is by interaction with wave actions.
Acknowledgement
The second author (SPK) is thankful to UGC for financial support through major research project. The authors thank the authorities of Women’s Christian College for providing necessary facilities.
REFERENCES
Angusamy, N. G, Rajamanickam V. 2006. Depositional environment of sediments along the southern coast of Tamil Nadu, India. Oceanologia 48(1):87–102
Angusamy, N. G, Rajamanickam, V. 2007. Coastal processes of Central Tamil Nadu, India: clues from grain size studies. Oceanologia 49 (1):41–57
Anithamary, I., Ramkumar, T. and Venkatramanan, S. 2011. Grain size characteristics of the coleroon estuary sediments, Tamilnadu, east coast of India. Carpathian J
Earth Environ Sci. 6(2):151– 157
Asselman, N. E. M. 1999. Grain size trends used to assess the effective discharge for flood plain sedimentation. River Waal, the Netherlands. J Sediment Res 69:51–61
Baruah, J., Kotoky, P. and Sarma, J. 1997. Textural and geochemical study on river sediments: a case study on the Jhanji River, Assam. J Indian Assoc Sedimental 16:195– 206
Behairy, A .K. A., Durgaprasada Rao, N. V. N., El-shater, A. 1991, A siliciclastic coastal sabkha, Red Sea Coast, Saudi Arabia, JKAV Mar. Sci., 65-77.
Brock, T. H. and Bongaerts, G. J. Herijinen M.A and Haijthujsen J.H., 1983. Nitrogen and Phosphorus accumulation and cycling by Nymphoides peltata (Gmel.) O. Kuntze (Menyanthaceae). Aquat. Bot., 17, 189-214. Carranza – Edwards, A., Rosales – Hoz, L., Urrutia-
Fucugauchi, J., Sandoval- Fortanel, A., Morales de la Garza, E. and Lozano Santa Cruz, R.. 2005. Geochemical distribution pattern of sediments in an active continental shelf in Southern Mexico. Continental Shelf Research, 25: 521-531.
Dyer, K. R., Christie, M. C. and Manning, A. J. 2000. The effect of suspended sediment on turbulence within an estuarine turbidity maximum.Estuary.Cost. Shelf Sci., 59(2): 237-248.
Erema, R. Daka and Miebaka Moslen. 2013. Spatial and temporal variation of physico chemical parameters of sediment from Azuabie creek of the Upper Bonny
Estuary, Niger Delta. Research J.Envn.and Earth Sci., 5(4): 219-228.
Folk, R. L. 1966. A review of the grain size parameters. Sedimentology 6:73–93
Folk, R. L., Ward ,M. C. 1957 Brazos River bars: a study in the significance of grain ize parameters. J Sediment Petrol
27:3– 27
Friedman, G. M. 1962. On sorting, sorting coefficient and the lognormality of the grain size distribution of sandstones. J Geol 70:734–753
Friedman, G. M. 1967 Dynamic processes and statistical parameters compared for size frequency distribution of beach river sands. J Sediment Petrol 37:327–354
Griffths, I .C. 1967 Scientific methods in the analysis of sediments. McGraw-Hill, New York
Horowitz, A. J., Rinella, F. A., Lamothe, P., Miller, T. L., Edwards, T. K., Roche, R. L. and Rickert, D. A. 1989. Cross-sectional variability in suspended sediment and associated trace element concentrations in selected rivers in the US.In : Sediment in the Environment ed.R.F. Hadley and E.D. Ongley, 57-66. IAHS Publ.no.184. Konta, J. 1985. Crystalline materials and chemical maturity of
suspended solids of some major world rivers.
Mineralogical and Petographical Acta 29:121-133. Lick, W. 1982. Entrainment, deposition and transport of fine-
grained sediment in lakes. Hydrobiologia 91: 31-40.
Malvarez, G. C, Cooper, J. A. G, Jackson, D. W. T. 2001. Relationship between waves induced currents and sediment grain size on a sandy tidal flat. J Sediment Res
71:705–712
Martincic, D., Kwokal Z. and Branica, M. 1990. Distribution of Zinc, lead, cadmium and copper between different size fractions of sediments in the Limski Kanal(North Adriatic Sea). Journal of Science of the Total Environment, 95 : 201-215.
Mason, C., Folk, R. L. 1958. Differentiation of beach, dune and Aeolian flat environments by size analysis, Mustang Island, Texas. J Sed Petrol 28:211–226
Ongley, E. D., Bynoe, M. C., and Percival, J. B. 1982. Physical and geochemical characteristics of suspended soilds, Wilton creek, Ontario.Can. J. Earth Sci.18: 1365-1379. Orfeo, O. 1999. Sedimentological characteristics of small
rivers with loessic headwaters in the chaco, south America Quaternary International 62:69-74.
Passega 1957. Texture as characteristic of clastic deposition.
Bull Am Assoc Petrol Geol 69:1952–1984
Passega, R. 1964 Grain size representation by CM patterns as a geological tool. J Sediment Petrol 34:830–847
Ramamohanarao, T., Sairam, K., Venkateswararao, Y., Nagamalleswarara,o B. and Viswanath, K. 2003 Sedimentological characteristics and depositional environment of Upper Gondwana rocks in the Chintalapudi sub-basin of the Godavari valley, Andhra Pradesh, India. J Asian Earth Sci 21:691–703
Ramanathan, A. L., Rajkumar, K., Majumdar, J., Singh, G., Behera, P.N., Santra, S.C. and Chidambaram, S. 2009. Textural characteristics of the surface sediments of a tropical mangrove Sundarban ecosystem India. Indian J
Mar Sci 38(4):397–403
Ray, A. K., Tripathy, S.C., Patra, S., Sarma, V. V. 2006. Assessment of Godavari estuarine mangrove ecosystem through trace metal studies. Environ Int 32:219–223
Reineck, H. E., and Singh. 1972. Tidal flats. Journal of society of Ecnomic Paleontologists and Mineralogists, Special Publication, 16: 146-159.
Sahu, B. K. 1964. Depositional mechanisms from the size analysis of clastic sediments. J sed petrol 34:73–83
Salomons, W. and Forstner, U. 1984. Metals in the hydrocycle. Springer-Verlag, N.Y. 349.
Stone, M. and Mudroch, A. 1989. The effect of particle size, chemistry and mineralogy of river sediments on phosphate adsorption. Environ.Tech.Lett. 10: 501-510.
Stone, M. and Saunderson, H. 1992. Particle size characteristics of suspended sediment in southern Ontario rivers tributary to the Great Lakes.Hydrol. Processes 6: 189-198.
Suresh Gandhi, M., Solai, A., Chandrasekaran, K. and Rammohan, V. 2008. Sediment characteristics and heavy mineral distribution in Tamiraparani estuary and off Tuticorin, Tamil Nadu—SEM studies. e-J Earth Sci India
I(III):102–118
Sutherland, R. A., Lee, C. T. 1994. Discrimination between coastal sub environments using textural characteristics. Sedimentalogy 41:1133–1143
Swift, D. J. P., Schubel, J. R. and Sheldon, R. E. 1972. Size analysis of the grained suspended sediment-a review.
Journal of Sedimentary Petrology, 42(10):122-134. Tubbs, C. R. 1977. Muddy Foreshores, In: Barnes, R.S.
K.(Ed.), The Coastline, Wiley, New York, 82-103.
Valia, H. S., Cameron, B. 1977. Skewness as paleo environmental indicators. J Sed Petrol 4:784–793
Visher, G. S. 1969. Grain size distribution and depositional process. J Sed Petrol 39:1074–1106
Wall, G. J., Wilding, L. P. and Smeck, N. E. 1978. Physical, chemical and mineralogical properties of fluvial unconsolidated bottom sediments in Northwestern Ohio.
J.Enviru.Qual. 7,319-325.
Walling, D. E and Moorehead, P. W. 1989. The particle size characteristics of fluvial suspended sediment: An overview. Hydrobiologia, 176/177: 125-149.
Wang, P., Davis, R .A and Kraus, N. C. 1998 Cross shore distinction of sediment texture under breaking waves along low energy coasts. J Sediment Res 68:497–506
Whitney, P. R. 1975. Relationship of Manganese- iron oxides and associated heavy metals to grain size in stream sediment. Journal of Geochemical Exploration, 4:251-263.