Facial Gesture Recognition using Surface EMG and Multiclass Support
Vector Machine (SVM)
Amol R. Nikam
1, Dr. R. N. Awale
21
M.Tech, Electronics, VJTI, H. R. Mahajani Road, Matunga, Mumbai 400019, INDIA
2Professor, Electrical Department, VJTI, H. R. Mahajani Road, Matunga, Mumbai 400019, INDIA
---***---
Abstract-
Electromyography (EMG) based facial gesturerecognition using different machine learning techniques is seen as potential medium in assistive technology and rehabilitation. The aim of this paper is to contribute this field of study by enabling system to recognize different facial expressions using EMG. It includes the comprehensive study on analysis of mutual action potential signals generated for four different expressions with most discriminative features. Different statistical features are derived in time domain like Root mean square (RMS), variance (VAR), etc. for feature classification. Finally, statistical features are classified using Support vector machine (SVM) and k- nearest neighbor (KNN). The results of the system are presented and methodology used is efficient for predicting different expressions which gives 92.76% accuracy using support vector machines.
Key-words
:
Electromyography (EMG), Root Mean Square (RMS), Variance (VAR) Standard Deviation (SD), Support Vector Machines (SVM), k-Nearest Neighbor (KNN)1.
INTRODUCTION
Facial gestures are most visible and expressive communication channels which contains complicated muscles capable of generating delicate movements. These facial gestures could convey non-verbal expressions, which are important in interpersonal relations. Efficient analysis of facial neuromuscular signals generated by different facial expression can be used for characterization of different facial gestures using surface electromyography (sEMG). [1,2]
EMG signals are non-stationary and stochastics signals which makes their analysis too complex. The recognition of facial gestures depends on the effectiveness of the feature selected and classification algorithm applied. Thus, in order to discriminate the muscle movements i. e. facial gestures ample amount of information is needed to be gather from the selected features. The features of EMG signals can be grouped in different categories based on the type of analysis technique used: time, frequency, spatial
and time- frequency domain features. In our studies we have focused on various times domain features which provides the most discerning characteristic of different movements. [3,7]
There are various techniques used for facial gestures identification. Image processing is widely used technique but it is ineffective to identify the movement of delicate muscles. Electromyography provides upper edge to this technique as it detects the tiny variations in signals for different muscles movement for facial gestures. Thus, it is helpful in many human machine interface (HMI) applications where we can control applications like robot or wheelchair using different facial expressions.[7]
In these studies, we have designed a system which provides one more dimension to available techniques in this field.
2.
METHODOLOGY
2.1 System Overview
Figure-1: System Block Diagram
2.2 Collecting Dataset
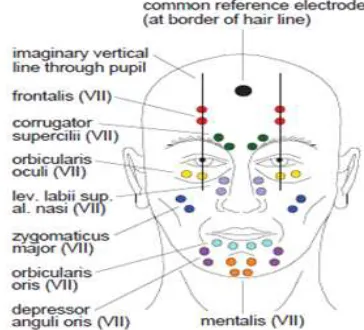
[image:2.612.62.244.382.547.2]The data consists of facial surface EMG signals from the muscle’s corrugator supercilia, zygomaticus major, orbicularis oris, orbicularis oculi, and masseter. Fifteen participants (8 females, 7 males) participated in the experiments for data collection. [9]. The above muscles are most active muscles which provides ample variations in signals for unlike expressions. Fig-2. Represents the anatomy of human face and location of different active muscles in facial expressions.
Figure-2: Electrode location for measuring facial EMG activity
3.
FEATURE EXTRACTION AND CLASSIFICATION.
3.1
Feature Extraction
Feature extraction is one of the best methods for reducing the dimensions of the large datasets. Here, we convert an initial set of data in a specific derived values or features which plays an important role in EMG signal analysis.
There are three types of features in which a raw EMG signal can be analyzed for feature extraction: time domain features, frequency domain features and time-frequency
domain features. Here time domain features like root mean square (RMS), mean absolute value (MAV), standard deviations (SD) and Variance (VAR) are derived. Root mean square (RMS) feature shows the energy content in signal. Variance (VAR) and standard deviation (SD) gives an idea about the variation or dispersion of data from mean or spread out of the data. As EMG signals are non-stationary and non-periodic signals a lot of variations are observed for different gestures. Thus, the above defined features provide more discerning variations in the range of statistical value for different expressions.
Table I, represents the mathematical expressions for mentioned statistical features.
Table-1
Mean Absolute
Value (MAV)
| |
Variance (VAR) ( )
Standard
Deviation (SD) √
( )
Root mean
Square (RMS) √ ( )
3.2
Classifications
Features extracted need to be classified in distinct classes for recognition of the different facial expressions. Classifiers used must be fast and proficient with better sensitivity and accuracy. The selected classifiers for the above experiments are Support vector machine (SVM) and k- nearest neighbor(k-NN).
3.2.1
Support Vector Machine (SVM)
sigmoid kernel is available. Here, polynomial kernel of degree 3 i.e. cubic SVM is been deployed for classification of expressions. The mathematical expression for polynomial regression is,
( ) ( )
Where d is the degree of the polynomial.
3.2.2
k-Nearest Neighbor (k-NN)
nearest neighbor (NN) finds the cluster of k-data points in the training set close to the class object based on the dominant class. Accuracy of k-NN depends k- value as the classification depends on k-values and also on the distance matrix name like Chebyshev, Euclidean, Hamming etc.
4.
RESULTS AND DISCUSSIONS
4.1
Raw EMG signals and Preprocessing
Fig-3, shows the plot of raw EMG signals for facial expressions like frowning and its filtered signal. For pre-processing the band pass filter of 5-450 Hz is used.
Figure-3: Signal plot and filtering
4.2 Classifier Results: SVM and k-NN
For the classification of data, confusion matrix a table briefing the classification algorithm is used.
Fig-4, shows the confusion matrix for SVM. The accuracy achieved is 92.76% for SVM for the polynomial regression of degree 3. The 5- fold validation is used for data prediction with 80-20% training -testing method. Similarly, overall accuracy achieved for cubic k-NN is 91.20%.
Figure-4: Confusion Matrix for SVM
Figure-5: Confusion Matrix for k-NN
Receiver operating curve (ROC) is the true positive rate (Sensitivity) is plot against the function of the false positive rate (100-Specificity) for different cut-off points of a parameter. Area under ROC curve indicates the usefulness of the classification tests.
Fig-6 and Fig-7 are ROC curve for SVM and k-NN respectively.
Figure-7: ROC curve for K-NN
The class wise accuracy table for SVM and k- NN is given below. Table-2 is accuracy table for SVM and Table-3 is accuracy table for k-NN.
Table-2
Accuracy
(%) Precision Recall ratio
F-Class 1 93.76 0.95 0.93 0.94
Class 2 95.37 0.85 0.86 0.86
Class 3 96.78 0.88 0.92 0.90
Class 4 99.20 0.98 0.98 0.98
Table-3
Accuracy
(%) Precision Recall ratio
F-Class 1 94.77 0.96 0.93 0.95
Class 2 90.58 0.85 0.93 0.89
Class 3 96.78 0.90 0.90 0.90
Class 4 94.7 0.98 0.91 0.98
4.3
Comparison of SVM and k-NN Classifier
Table-4
Parameter SVM k-NN
Accuracy 93.76 91.20
Sensitivity 92.25 91.40
Specificity 91.50 92
F-ratio 92 90.75
5.
CONCLUSION
The main aim of this paper is to recognize facial expressions from facial EMG signals. Features like root mean square (RMS), standard deviation (SD) and Mean average value (MAV) are used for classification using support vector machine (SVM) and k-nearest neighbor (k-NN). The best classification accuracy is 92.76% for cubic SVM to detect facial gesture using 80-20 training testing method.
REFERENCES:
[1] Mahyar Hamedi, Sh-Hussain Salleh, Kamarulafizam Ismail, Alias Mohd Noor, “Time-Frequency Facial Gestures EMG Analysis using Bilinear Distribution”, in IEEE International Conference on Signal and Image Processing Applications (ICSIPA), Oct 2015.
[2] Ç. Topçu et al., "Entropy analysis of surface EMG for classification of face movements," 2015 23nd Signal Processing and Communications Applications Conference
(SIU), Malatya, 2015,
pp.1647-1650.doi:10.1109/SIU.2015.7130167
[3] M. Hamedi, I. Mohammad Rezazadeh, and M. P. Firoozabadi, “Facial Gesture Recognition using Two-Channel Biosensors Configuration and Fuzzy Classifier: a Pilot Study,” in International Conference on Electrical, Control and Computer Engineering (INECCE), pp. 338–343, June 2011.
[4] L.B.P. Ang ; E.F. Belen ; R.A. Bernardo ; E.R.
Boongaling ; G.H. Briones ; J.B. Coronel, “Facial expression recognition through pattern analysis of facial muscle
movements utilizing electromyogram sensors. ” in 2004
IEEE Region 10 Conference TENCON 2004, Nov 2004
[5] Mahyar Hamedi, Sh-Hussain Salleh, Chee-Ming Ting, Mehdi Astaraki and Alias Mohd Noor , “Robust Facial Expression Recognition for MuCI: A Comprehensive
Neuromuscular Signal Analysis.” DOI
10.1109/TAFFC.2016. 2569098, IEEE Transactions on Affective Computing.
[6] Meredith J. Cler, and Cara E. Stepp, “Discrete Versus Continuous Mapping of Facial Electromyography for Human–Machine Interface Control: Performance and Training Effects.”, IEEE Transaction on Neural Systems and Rehabilitation Engineering, VOL. 23, NO. 4, JULY 2015.
Packet Transform and SVM,” International Conference on Machine Intelligence and Signal Processing (MISP 2017), IIT-Indore, India, 2017. (DOI: 10.1007/978-981-13-0923-6_21)
[8 ]Kehri V, Awale R. N. EMG Signal Analysis for Diagnosis of Muscular Dystrophy Using Wavelet Transform, SVM and ANN. Biomed Pharmacol J 2018;11(3).
[9] Mimetic Interfaces: Facial Surface EMG Dataset 2015, 2016-05-19, Ville Rantanen (author), Ville Rantanen
(distributor), Etsin research data
finder,2019. urn:nbn:fi:csc-kata20160519232206569792
[10] Hend Ab. ELLaban , A. A. Ewees , “A Real-Time System for Facial Expression Recognition using Support Vector Machines and k-Nearest Neighbor Classifier”, in International Journal of Computer Applications (0975 – 8887) Volume 159 – No 8, February 2017
[11] Mahyar Hamedi, Sh-Hussain Salleh, Mehdi Astaraki, “EMG-based facial gesture recognition through versatile
elliptic basis function neural network”, Hamedi et al.
BioMedical Engineering OnLine 2013, 12:73