Proceedings of the 2011 Conference on Empirical Methods in Natural Language Processing, pages 433–443, Edinburgh, Scotland, UK, July 27–31, 2011. c2011 Association for Computational Linguistics
Timeline Generation through Evolutionary Trans-Temporal Summarization
Rui Yan†, Liang Kong†, Congrui Huang†, Xiaojun Wan‡, Xiaoming Li\, Yan Zhang†∗ †School of Electronics Engineering and Computer Science, Peking University, China
‡Institute of Computer Science and Technology, Peking University, China
\State Key Laboratory of Virtual Reality Technology and Systems, Beihang University, China
{r.yan,kongliang,hcr,lxm}@pku.edu.cn,
[email protected],[email protected]
Abstract
We investigate an important and challeng-ing problem in summary generation, i.e., Evolutionary Trans-Temporal Summarization (ETTS), which generates news timelines from massive data on the Internet. ETTS greatly facilitates fast news browsing and knowl-edge comprehension, and hence is a neces-sity. Given the collection of time-stamped web documents related to the evolving news, ETTS aims to return news evolution along the time-line, consisting of individual but correlated summaries on each date. Existing summariza-tion algorithms fail to utilize trans-temporal characteristics among these component sum-maries. We propose to model trans-temporal correlations among component summaries for timelines, usinginter-dateandintra-date sen-tence dependencies, and present a novel com-bination. We develop experimental systems to compare 5 rival algorithms on 6 instinctively different datasets which amount to 10251 doc-uments. Evaluation results in ROUGE metrics indicate the effectiveness of the proposed ap-proach based on trans-temporal information.
1 Introduction
Along with the rapid growth of the World Wide Web, document floods spread throughout the Inter-net. Given a large document collection related to a news subject (for example, BP Oil Spill), readers get lost in the sea of articles, feeling confused and powerless. General search engines can rank these
∗Corresponding author.
news webpages byrelevanceto a user specified as-pect, i.e., a query such as “first relief effort for BP Oil Spill”, but search engines are not quite capable of ranking documents given the whole news subject without particular aspects. Faced with thousands of news documents, people usually have a myriad of in-terest aspects about the beginning, the development or the latest situation. However, traditional infor-mation retrieval techniques can only rank webpages according to their understanding of relevance, which is obviously insufficient (Jin et al., 2010).
Even if the ranked documents could be in a satis-fying order to help users understand news evolution, readers prefer to monitor the evolutionary trajecto-ries by simply browsing rather than navigate every document in the overwhelming collection. Summa-rization is an ideal solution to provide an abbrevi-ated, informative reorganization for faster and bet-ter representation of news documents. Particularly, a timeline (see Table 1) can summarize evolutionary news as a series of individual but correlated com-ponent summaries (items in Table 1) and offer an option to understand the big picture of evolution.
With unique characteristics, summarizing time-lines is significantly different from traditional sum-marization methods which are awkward in such sce-narios. We first study a manual timeline of BP Oil Spill in Mexico Gulf in Table 1 from Reuters News1
to understand why timelines generation is observ-ably different from traditional summarization. No traditional method has considered to partition corpus into subsets by timestamps for trans-temporal cor-relations. However, we discover two unique
trans-1http://www.reuters.com
Table 1: Part of human generated timeline about BP Oil Spill in 2010 from Reuters News website.
April 22, 2010
The Deepwater Horizon rig, valued at more than $560 million, sinks and a five mile long (8 km) oil slick is seen.
April 25, 2010
The Coast Guard approves a plan to have remote underwater vehi-cles activate a blowout preventer and stop leak. Efforts to activate the blowout preventer fail.
April 28, 2010
The Coast Guard says the flow of oil is 5,000 barrels per day (bpd) (210,000 gallons/795,000 litres) – five times greater than first esti-mated. A controlled burn is held on the giant oil slick.
April 29, 2010
U.S. President Barack Obama pledges “every single available re-source,” including the U.S. military, to contain the spreading spill. Obama also says BP is responsible for the cleanup. Louisiana de-clares state of emergency due to the threat to the state’s natural resources.
April 30, 2010
An Obama aide says no drilling will be allowed in new areas, as the president had recently proposed, until the cause of the Deepwater Horizon accident is known.
temporal characteristics of component summaries from the handcrafted timeline. Individuality. The component summaries are summarizedlocally: the component item on datetis constituted by sentences with timestamp t. Correlativeness. The compo-nent summaries are correlative across dates, based on the globalcollection. To the best of our knowl-edge, no traditional method has examined the rela-tionships among these timeline items.
Although it is profitable, summarizing timeline faces with new challenges:
• The first challenge for timeline generation is to deliver important contents and avoid information overlaps among component summaries under the trans-temporal scenario based on global/local source collection. Component items are individual but not completely isolated due to the dynamic evolution.
• As we have individuality and correlativeness
to evaluate the qualities of component summaries, both locally and globally, the second challenge is to formulate the combination task into a balanced op-timization problem to generate the timelines which satisfy both standards with maximum utilities.
We introduce a novel approach for the web min-ing problem Evolutionary Trans-Temporal Summa-rization (ETTS). Taking a collection relevant to a news subject as input, the system automatically out-puts a timeline with items of component summaries
which represent evolutionary trajectories on specific dates. We classify sentence relationships as inter-date andintra-datedependencies. Particularly, the inter-date dependency calculation includes temporal decays to project sentences from all dates onto the same time horizon (Figure 1 (a)). Based on intra-/inter-date sentence dependencies, we then model affinity and diversity to compute the saliency score of each sentence and merge local and global rank-ings into one unified ranking framework. Finally we select top ranked sentences. We build an experimen-tal system on 6 real datasets to verify the effective-ness of our methods compared with other 4 rivals.
2 Related Work
Multi-document summarization (MDS) aims to pro-duce a summary delivering the majority of informa-tion content from a set of documents and has drawn much attention in recent years. Conferences such as ACL, SIGIR, EMNLP, etc., have advanced the tech-nology and produced several experimental systems.
Generally speaking, MDS methods can be either extractive or abstractive summarization. Abstractive summarization (e.g. NewsBlaster2) usually needs
information fusion, sentence compression and refor-mulation. We focus on extraction-based methods, which usually involve assigning saliency scores to some units (e.g. sentences, paragraphs) of the docu-ments and extracting the units with highest scores.
To date, various extraction-based methods have been proposed for generic multi-document summa-rization. The centroid-based method MEAD (Radev et al., 2004) is an implementation of the centroid-based method that scores sentences centroid-based on fea-tures such as cluster centroids, position, and TF.IDF, etc. NeATS (Lin and Hovy, 2002) adds new features such as topic signature and term clustering to select important content, and use MMR (Goldstein et al., 1999) to remove redundancy.
Graph-based ranking methods have been pro-posed to rank sentences/passages based on “votes” or “recommendations” between each other. Tex-tRank (Mihalcea and Tarau, 2005) and LexPageR-ank (Erkan and Radev, 2004) use algorithms similar to PageRank and HITS to compute sentence impor-tance. Wan et al. have improved the graph-ranking
2http://www1.cs.columbia.edu/nlp/newsblaster/
algorithm by differentiating intra-document and inter-document links between sentences (2007b), and have proposed a manifold-ranking method to utilize sentence-to-sentence and sentence-to-topic relationships (Wan et al., 2007a).
ETTS seems to be related to a very recent task of “update summarization” started in DUC 2007 and continuing with TAC. However, update summariza-tion only dealt with a single update and we make a novel contribution with multi-step evolutionary up-dates. Further related work includes similar timeline systems proposed by (Swan and Allan, 2000) us-ing named entities, by (Allan et al., 2001) measured in usefulness and novelty, and by (Chieu and Lee, 2004) measured ininterestandburstiness. We have proposed a timeline algorithm named “Evolution-ary Timeline Summarization (ETS)” in (Yan et al., 2011b) but the refining process based on generated component summaries is time consuming. We aim to seek for more efficient summarizing approach.
To the best of our knowledge, neither update sum-marization nor traditional systems have considered the relationship among “component summaries”, or have utilized trans-temporal properties. ETTS ap-proach can also naturally and simultaneously take into account global/local summarization with biased information richness and information novelty, and combine both summarization in optimization.
3 Trans-temporal Summarization
We conduct trans-temporal summarization based on the global biased graph usinginter-datedependency and local biased graph usingintra-datedependency. Each graph is the complementary graph to the other.
3.1 Global Biased Summarization
The intuition for global biased summarization is that the selected summary should be correlative with sen-tences from neighboring dates, especially with those informative ones. To generate the component sum-mary on datet, we project all sentences in the collec-tion onto the time horizon oftto construct a global affinity graph, using temporal decaying kernels. 3.1.1 Temporal Proximity Based Projection
[image:3.612.317.539.72.197.2]Clearly, a major technical challenge in ETTS is how to define the temporal biased projection func-tion Γ(∆t), where ∆t is the distance between the
Figure 1: Construct global/local biased graphs. Solid cir-cles denote intra-date sentences on the pending datetand
dash ones represent inter-date sentences from other dates.
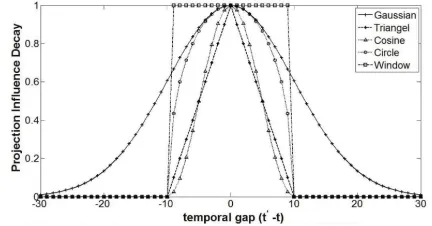
Figure 2: Proximity-based kernel functions, whereσ=10.
pending datet and neighboring date t0, i.e., ∆t =
|t0 −t|. As in (Lv and Zhai, 2009), we present 5 representative kernel functions: Gaussian, Triangle, Cosine, Circle, and Window, shown in Figure 2. Dif-ferent kernels lead to difDif-ferent projections.
1. Gaussian kernel
Γ(∆t) =exp[−∆t
2
2σ2 ]
2. Triangle kernel
Γ(∆t) = (
1− ∆t
σ if ∆t≤σ
0 otherwise
3. Cosine (Hamming) kernel
Γ(∆t) = (
1
2[1 +cos(∆σt·π)] if ∆t≤σ
0 otherwise
4. Circle kernel
Γ(∆t) = (q
1−(∆σt)2 if ∆t≤σ
0 otherwise
[image:3.612.318.534.259.372.2]5. Window kernel
Γ(∆t) = (
1 if ∆t≤σ
0 otherwise
All kernels have one parameter σ to tune, which controls the spread of kernel curves, i.e., it restricts the projection scope of each sentence. In general, the optimal setting ofσ may vary according to the news set because sentences presumably would have wider semantic scope in certain news subjects, thus requiring a higher value ofσand vice versa.
3.1.2 Modeling Global Affinity
Given the sentence collectionCpartitioned by the timestamp setT,C = {C1, C2, . . . , C|T|}, we ob-tainCt={st
i|1≤i≤ |Ct|}wheresi is a sentence
with the timestampt=tsi. When we generate com-ponent summary ont, we project all sentences onto time horizon t. After projection, all sentences are weighted by their influence ont. We use an affinity matrixMtwith the entry of the inter-date transition probability on datet. The sum of each row equals to 1. Note that for the global biased matrix, we mea-sure the affinity between local sentences fromtand global sentences from other dates. Therefore, intra-date transition probability between sentences with the timestamptis set to 0 for local summarization.
Mi,jt is the transition probability ofsitosj based
on the perspective of datet, i.e.,p(si →sj|t):
p(si →sj|t) =
( f(si→sj|t)
P
|C|f(si→sk|t) if P
f 6= 0
0 if tsi =tsj =t (1) f(si → sj|t)is defined as the temporal weighted
cosine similarity between two sentences:
f(si →sj|t) = X
w∈si∩sj
π(w, si|t)·π(w, sj|t) (2)
where the weightπassociated with termwis calcu-lated with the temporal weightedtf.isf formula:
π(w, s|t) = Γ|t−ts| ·tf(w, s)(1 +log( |C| Nw)) qP
|s|(tf(w, s)(1 +log(| C| Nw)))
2
.
(3) where ts is the timestamp of sentence s, and
tf(w, s)is the term frequency ofwins. ts can be
any date from T. |C| is the sentences set size and Nwis the number of sentences containing termw.
We let p(si → si|t)=0 to avoid self transition.
Note that although f(.) is a symmetric function,
p(si → sj|t) is usually not equal top(sj → si|t),
depending on the degrees of nodessiandsj.
Now we establish the affinity matrixMi,jt and by using the general form of PageRank, we obtain:
~λ=µM−1~λ+1−µ
|C| ~e (4)
where~λ is the selective probability of all sentence nodes and ~e is a column vector with all elements equaling to 1. µ is the damping factor set as 0.85. Usually the convergence of the iteration algorithm is achieved when difference between the scores com-puted at two successive iterations for any sentences falls below a given threshold (0.0001 in this study). 3.1.3 Modeling Diversity
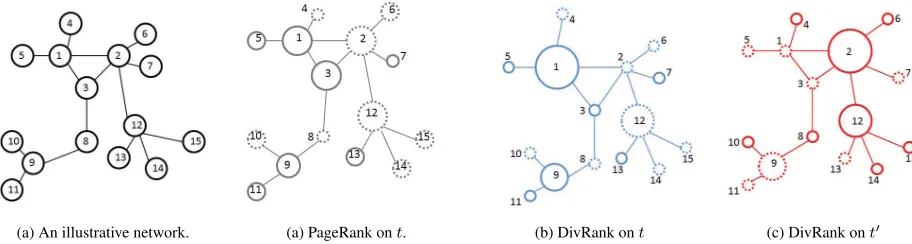
Diversity is to reflect both biased information richness and sentence novelty, which aims to reduce information redundancy. However, using standard PageRank of Equation (4) will not result in diver-sity. The aggregational effect of PageRank assigns high salient scores to closely connected node com-munities (Figure 3 (b)). A greedy vertex selection algorithm may achieve diversity by iteratively se-lecting the most prestigious vertex and then penal-izing the vertices “covered” by the already selected ones, such as Maximum Marginal Relevance and its applications in Wan et al. (2007b; 2007a). Most re-cently diversity rankDivRank is another solution to diversity penalization in (Mei et al., 2010).
We incorporate DivRank in our general ranking framework, which creates a dynamicM during each iteration, rather than a static one. After ztimes of iteration, the matrixM becomes:
M(z) =µM(z−1)·~λ(z−1)+1−µ
there emerges arich-gets-richerphenomenon (Fig-ure 3 (c) and (d)). By incorporating DivRank, we obtain rankr†i and the global biased ranking score Gifor sentencesifrom datetto summarizeCt.
3.2 Local Biased Summarization
Naturally, the component summary for datetshould be informative within Ct. Given the sentence
col-lectionCt ={sti|1 ≤i ≤ |Ct|}, we build an affin-ity matrix for Figure 1 (b), with the entry of intra-date transition probability calculated from standard cosine similarity. We incorporate DivRank within local summarization and we obtain the local biased rank and ranking score forsi, denoted asr‡i andLi.
3.3 Optimization of Global/Local Combination We do not directly add the global biased ranking score and local biased ranking score, as many previ-ous works did (Wan et al., 2007b; Wan et al., 2007a), because even the same ranking score gap may indi-cate different rank gaps in two ranking lists.
Given subsetCt, letR = {ri}(i = 1,. . . ,|Ct|),ri
is the final ranking of si to estimate, optimize the
following objective cost functionO(R),
O(R) =α
|Ct| X
i=1 Gik
ri Ψi −
ri† Gik
2
+β
|Ct| X
i=1 Likri
Ψi −
ri‡ Lik
2
(6)
whereGiis the global biased ranking score whileLi
is the local biased ranking score. Ψi is expected to
be the merged ranking score, namely sentence im-portance, which will be defined later. Among the two components in the objective function, the first component means that the refined rank should not deviate too much from the global biased rank. We usekri
Ψi − r†i Gik
2instead ofkr
i−ri†k2in order to
dis-tinguish the differences between sentences from the same rank gap. The second component is similar by refining rank from local biased summarization.
Our goal is to findR =R∗ to minimize the cost function, i.e.,R∗=argmin{O(R)}.R∗is the final rank merged by our algorithm. To minimizeO(R), we compute its first-order partial derivatives.
∂O(R)
∂ri
= 2α Ψi
(Gi Ψi
ri−ri†) + 2β
Ψi (Li
Ψi
ri−r‡i) (7)
Let ∂O(R)
∂ri = 0, we get
r∗i = αΨir †
i +βΨir‡i
αGi+βLi (8)
Two special cases are that if (1) α = 0, β 6= 0: we obtainri= Ψiri‡/Li, indicating we only use the
local ranking score. (2)α6= 0,β= 0, indicating we ignore local ranking score and only consider global biased summarization using inter-date dependency.
There can be many ways to calculate the sen-tence importance Ψi. Here we define Ψi as the
weighted combination of itself with ranking scores from global biased and local biased summarization:
Ψ(iz)= αGi+βLi+γΨ
(z−1)
i
α+β+γ . (9)
To save one parameter we letα+β+γ= 1. In thez -th iteration,ri(z)is dependent onΨi(z−1)andΨ(iz)is indirectly dependent onri(z) viaΨi(z−1). Ψ(0)i = 0. We iteratively approximate finalΨifor the ultimate
rank listR∗. The expectation of stableΨiis obtained
whenΨ(iz)= Ψ(iz−1). FinalΨiis expected to satisfy Ψi=αGi+βLi+γΨi:
Ψi=
αGi+βLi 1−γ =
αGi+βLi
α+β (10)
FinalΨi is dependent only on original global/local
biased ranking scores. Equation (8) becomes more concise with noΨorγ: r∗ is a weighted combina-tion of global and local ranks byα
β (α6= 0,β6= 0):
ri∗ = α
α+βr
† i +
β α+βr
‡ i
= 1
1 +β/αr
† i +
1 1 +α/βr
‡ i
(11)
4 Experiments and Evaluation
4.1 Datasets
(a) An illustrative network. (a) PageRank ont. (b) DivRank ont (c) DivRank ont0
Figure 3: An illustration of diverse ranking in a toy graph (a). Comparing (b) from general PageRank with (c),(d) from DivRank, we find a better diversity by selecting{1,9} in (c) rather than{1,3}in (b). Moreover, (c) and (d) reflect temporal biased processes ont{1,9}in (c) andt0{2,12}in (d).
[image:6.612.73.302.362.525.2]is in China and the rest are in the US. We choose these sites because many of them provide timelines edited by professional editors, which serve as refer-ence summaries. The news belongs to different cate-gories of Rule of Interpretation (ROI) (Kumaran and Allan, 2004). More detailed statistics are in Table 3.
Table 2: News sources of 6 datasets News Sources Nation News Sources Nation
BBC UK Fox News US Xinhua China MSNBC US CNN US Guardian UK ABC US New York Times US Reuters UK Washington Post US
Table 3: Detailed basic information of 6 datasets. News Subjects #size #docs #stamps #RT AL
1.Influenza A 115026 2557 331 5 83 2.Financial Crisis 176435 2894 427 2 118
3.BP Oil Spill 63021 1468 135 6 76 4.Haiti Earthquake 12073 247 83 2 32 5.Jackson Death 37819 925 168 3 64 6.Obama Presidency 79761 2160 349 5 92 size: the whole sentence counts; #stamps: the number of timestamps; Noteaverage sizeof subsets is calculated as: avg.size=#size/#stamps; RT: reference timelines; AL: avg. length of RT measured in sentences.
4.2 Experimental System Setups
•Preprocessing. As ETTS faces with much larger corpus compared with traditional MDS, we apply further data preprocessing besides stemming and stop-word removal. We extract text snippets repre-senting atomic “events” from all documents with a toolkit provided by Yan et al. (2010; 2011a), by which we attempt to assign more fine-grained and accurate timestamps for every sentence within the text snippets. After the snippet extraction procedure, we filter the corpora by discarding non-event texts.
• Compression Rate and Date Selection. After
preprocessing, we obtain numerous snippets with fine-grained timestamps, and then decompose them into temporally tagged sentences as the global col-lectionC. We partition Caccording to timestamps of sentences, i.e., C = C1 ∪ C2 ∪ · · · ∪ C|T|. Each component summary is generated from its cor-responding sub-collection. The sizes of component summaries are not necessarily equal, and moreover, not all dates may be represented, so date selection is also important. We apply a simple mechanism that users specify the overall compression rateφ, and we extract more sentences for important dates while fewer sentences for others. Theimportanceof dates is measured by theburstiness, which indicates prob-able significant occurrences (Chieu and Lee, 2004). The compression rate ontiis set asφi = |C
i| |C|.
4.3 Evaluation Metrics
The ROUGE measure is widely used for evaluation (Lin and Hovy, 2003): the DUC contests usually of-ficially employ ROUGE for automatic summariza-tion evaluasummariza-tion. In ROUGE evaluasummariza-tion, the summa-rization quality is measured by counting the num-ber of overlapping units, such as N-gram, word se-quences, and word pairs between the candidate time-linesCT and the reference timelinesRT. There are several kinds of ROUGE metrics, of which the most important one is ROUGE-N with 3 sub-metrics:
1 ROUGE-N-R is an N-gram recall metric:
ROUGE-N-R=
P
I∈RT
P
N-gram∈ICountmatch(N-gram)
P
I∈RT
P
2 ROUGE-N-P is an N-gram precision metric:
ROUGE-N-P=
P
I∈CT
P
N-gram∈ICountmatch(N-gram)
P
I∈CT
P
N-gram∈ICount (N-gram)
3 ROUGE-N-F is an N-gramF1 metric:
ROUGE-N-F=2×ROUGE-N-P×ROUGE-N-R
ROUGE-N-P+ROUGE-N-R
Idenotes a timeline. N in these metrics stands for the length of N-gram and N-gram∈RT denotes the
N-grams in reference timelines while N-gram∈CT
denotes the N-grams in the candidate timeline. Countmatch(gram) is the maximum number of
N-gram in the candidate timeline and in the set of ref-erence timelines. Count(N-gram)is the number of
N-grams in reference timelines or candidate timelines. According to (Lin and Hovy, 2003), among all sub-metrics, unigram-based ROUGE (ROUGE-1) has been shown to agree with human judgment most and bigram-based ROUGE (ROUGE-2) fits summa-rization well. We report three ROUGE F-measure scores: ROUGE-1, ROUGE-2, and ROUGE-W, where ROUGE-W is based on the weighted longest common subsequence. The weight W is set to be 1.2 in our experiments by ROUGE package (version 1.55). Intuitively, the higher the ROUGE scores, the similar the two summaries are.
4.4 Algorithms for Comparison
We implement the following widely used sum-marization algorithms as baseline systems. They are designed for traditional summarization without trans-temporal dimension. The first intuitive way to generate timelines by these methods is via a global summarization on collection C and then distribu-tion of selected sentences to their source dates. The other one is via an equal summarization on all local sub-collections. For baselines, we average both in-tuitions as their performance scores. For fairness we conduct the same preprocessing for all baselines.
Random: The method selects sentences ran-domly for each document collection.
Centroid: The method applies MEAD algorithm (Radev et al., 2004) to extract sentences according
to the following three parameters: centroid value, positional value, and first-sentence overlap.
GMDS: The graph-based MDS proposed by (Wan and Yang, 2008) first constructs a sentence connectivity graph based on cosine similarity and then selects important sentences based on the con-cept of eigenvector centrality.
Chieu: (Chieu and Lee, 2004) present a simi-lar timeline system with different goals and frame-works, utilizinginterest andburstinessranking but neglecting trans-temporal news evolution.
ETTS: ETTS is an algorithm with optimized combination of global/local biased summarization.
RefTL: As we have used multiple human time-lines as references, we not only provide ROUGE evaluations of the competing systems but also of the human timelines against each other, which provides a good indicator as to the upper bound ROUGE score that any system could achieve.
4.5 Overall Performance Comparison
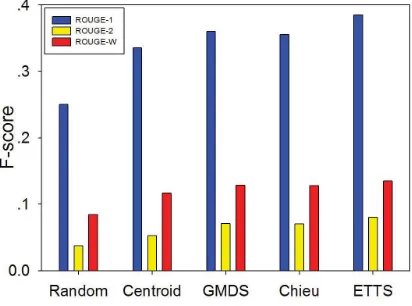
[image:7.612.323.529.475.628.2]We use across validationmanner among 6 datasets, i.e., train parameters on one subject set and exam-ine the performance on the others. After 6 training-testing processes, we take the average F-score per-formance in terms of ROUGE-1, ROUGE-2, and ROUGE-W on all sets. The overall results are shown in Figure 4 and details are listed in Tables 4∼6.
Figure 4: Overall performance on 6 datasets.
From the results, we have following observations:
•Random has the worst performance as expected.
Table 4: Overall performance comparison on Influenza A (ROI∗ category: Science) and Financial Crisis (ROI
category: Finance).α=0.4, kernel=Gaussian,σ=60.
1. Influenza A 2. Financial Crisis Systems R-1 R-2 R-W R-1 R-2 R-W
RefTL 0.491 0.114 0.161 0.458 0.112 0.159 Random 0.257 0.039 0.081 0.230 0.030 0.071 Centroid 0.331 0.050 0.114 0.305 0.041 0.108 GMDS 0.364 0.062 0.130 0.327 0.054 0.110 Chieu 0.350 0.059 0.128 0.325 0.052 0.109
[image:8.612.321.531.100.247.2]ETTS 0.375 0.071 0.132 0.339 0.058 0.112
Table 5: Overall performance comparison on BP Oil (ROI category: Accidents) and Haiti Quake (ROI cate-gory: Disasters).α=0.4, kernel=Gaussian,σ=30.
3. BP Oil 4. Haiti Quake Systems R-1 R-2 R-W R-1 R-2 R-W
RefTL 0.517 0.135 0.183 0.528 0.139 0.187 Random 0.262 0.041 0.096 0.266 0.043 0.093 Centroid 0.369 0.062 0.128 0.362 0.060 0.129 GMDS 0.389 0.084 0.139 0.380 0.106 0.137 Chieu 0.384 0.083 0.139 0.383 0.110 0.138
ETTS 0.441 0.107 0.158 0.436 0.111 0.145
Table 6: Overall performance comparison on Jackson Death (ROI category: Legal Cases) and Obama Presi-dency (ROI category: Politics).α=0.4, kernel=Gaussian,
σ=30.
5. Jackson Death 6. Obama Presidency Systems R-1 R-2 R-W R-1 R-2 R-W
RefTL 0.482 0.113 0.161 0.495 0.115 0.163 Random 0.232 0.033 0.080 0.254 0.039 0.084 Centroid 0.320 0.051 0.109 0.325 0.053 0.111 GMDS 0.341 0.059 0.127 0.359 0.061 0.129 Chieu 0.344 0.059 0.128 0.346 0.060 0.125
ETTS 0.358 0.061 0.130 0.369 0.074 0.133
∗ROI: news categorization defined by Linguistic Data Consortium.
into account positional value and first-sentence over-lap, which facilitate main aspects summarization.
•The GMDS system outperforms centroid-based summarization methods. This is due to the fact that PageRank-based framework ranks the sentence us-ing eigenvector centrality which implicitly accounts for information subsumption among all sentences.
Traditional MDS only consider sentence selection from either the global or the local scope, and hence bias occurs. Mis-selected sentences result in a low recall. Generally the performance of global priority intuition (i.e. only global summarization and then distribution to temporal subsets) is better than local priority methods (only local summarization). Proba-ble bias is enlarged by searching for worthy sentence in single dates. However, precision drops due to
ex-cessive choice of global timeline-worthy sentences.
[image:8.612.316.536.299.631.2]Figure 5:α/β: global/local combination.
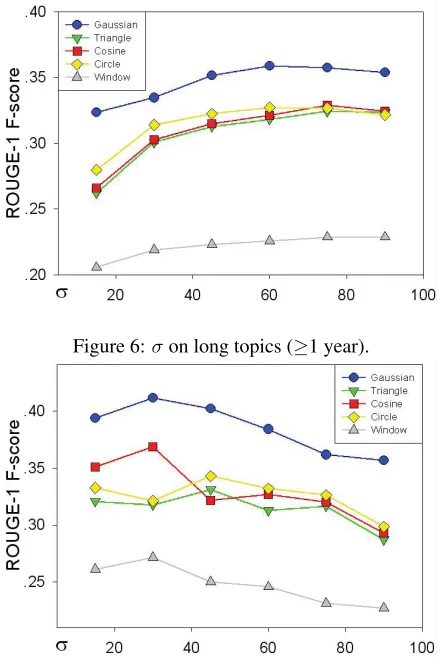
Figure 6:σon long topics (≥1 year).
Figure 7:σon short topics (<1 year).
in the algorithms actually performs flat clustering-based summarization which is proved to be less use-ful (Wang and Li, 2010). GMDS utilizes sentence linkage, and partly captures “correlativeness”.
• ETTS under our proposed framework outper-forms baselines, indicating that the properties we use for timeline generation are beneficial. We also add a direct comparison between ETTS and ETS (Yan et al., 2011b). We notice that both balanced algorithms achieve comparable performance (0.386 v.s. 0.412: a gap of 0.026 in terms of ROUGE-1), but ETTS is much faster than ETS. It is under-standable that ETS refines timelines based on neigh-boring component summaries iteratively while for ETTS neighboring information is incorporated in temporal projection and hence there is no such pro-cedure. Furthermore, ETS has 8 free parameters to tune while ETTS has only 2 parameters. In other words, ETTS is more simple to control.
• The performance on intensive focused news within short time range (|last timestamp−first
times-tamp|<1 year) is better than on long lasting news. Having proved the effectiveness of our proposed methods, we carry the next move to identity how
global−local combination ratioα/βandprojection kernelstake effects to enhance the quality of a sum-mary in parameter tuning.
4.6 Parameter Tuning
Each time we tune one parameter while others are fixed. To identify howglobalandlocalbiased sum-marization combine, we provide experiments on the performance of varyingα/βin Figure 5. Results in-dicate that a balance between global and local biased summarization is essential for timeline generation because the performance is best when α
β ∈[10,100]
and outperforms global and local summarization in isolation, i.e., whenα=0 orβ = 0in Figure 5. Inter-estingly, we conclude an opposite observation com-pared with ETS. Different approaches might lead to different optimum of global/local combination.
Another key parameter σ measures the temporal projection influence from global collection to local collection and hence the size of neighboring sen-tence set. 6 datasets are classified into two groups. Subject 1, 2, 6 are grouped as long news with a time span of more than one year and the others are short news. The effect ofσ varies on long news sets and
short news sets. In Figure 6σis best around 60 and in Figure 7 it is best at about 20∼40, indicating long news has relatively wider semantic scope.
We then examine the effect of different projection kernels. Generally, Gaussian kernel outperforms others and window kernel is the worst, probably be-cause Gaussian kernel provides the best smoothing effect with no arbitrary cutoffs. Window kernel fails to distinguish different weights of neighboring sets by temporal proximity, so its performance is as ex-pected. Other 3 kernels are comparable.
4.7 Sample Output and Case Study
Sample output is presented in Table 7 and it shares major information similarity with the human time-line in Table 1. Besides, we notice that a dynamic φi is reasonable. Important burstiness is worthy of
more attention. Fewer sentences are selected on the dates when nothing new occurs.
Interesting Findings. We notice that humans have biases to generate timelines for they have (1) pref-erence on local occurrences and (2) different writ-ing styles. For instance, news outlets from United States tend to summarize reactions by US govern-ment while UK websites tend to summarize British affairs. Some editors favor statistical reports while others prefer narrative style, and some timelines have detailed explanations while others are ex-tremely concise with no more than two sentences for each entry. Our system-generated timelines have a large variance among all golden standards. Proba-bly a new evaluation metric should be introduced to measure the quality of human generated timelines to mitigate the corresponding biases. A third in-teresting observation is that subjects have different volume patterns, e.g.,H1N1has a slow start and a bursty evolution andBP Oilhas a bursty start and a quick decay. Obamais different in nature because the report volume is temporally stable and scattered.
5 Conclusion
We present a novel solution for the important web mining problem, Evolutionary Trans-Temporal Summarization (ETTS), which generates trajectory timelines for news subjects from massive data. We formally formulate ETTS as a combination ofglobal
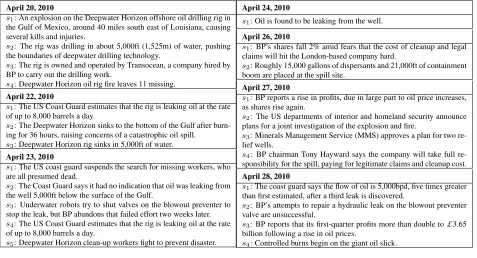
Table 7: Selected part of timeline generated by ETTS forBP Oil.
April 20, 2010
s1: An explosion on the Deepwater Horizon offshore oil drilling rig in
the Gulf of Mexico, around 40 miles south east of Louisiana, causing several kills and injuries.
s2: The rig was drilling in about 5,000ft (1,525m) of water, pushing
the boundaries of deepwater drilling technology.
s3: The rig is owned and operated by Transocean, a company hired by
BP to carry out the drilling work.
s4: Deepwater Horizon oil rig fire leaves 11 missing.
April 22, 2010
s1: The US Coast Guard estimates that the rig is leaking oil at the rate
of up to 8,000 barrels a day.
s2: The Deepwater Horizon sinks to the bottom of the Gulf after
burn-ing for 36 hours, raisburn-ing concerns of a catastrophic oil spill. s3: Deepwater Horizon rig sinks in 5,000ft of water.
April 23, 2010
s1: The US coast guard suspends the search for missing workers, who
are all presumed dead.
s2: The Coast Guard says it had no indication that oil was leaking from
the well 5,000ft below the surface of the Gulf.
s3: Underwater robots try to shut valves on the blowout preventer to
stop the leak, but BP abandons that failed effort two weeks later. s4: The US Coast Guard estimates that the rig is leaking oil at the rate
of up to 8,000 barrels a day.
s5: Deepwater Horizon clean-up workers fight to prevent disaster.
April 24, 2010
s1: Oil is found to be leaking from the well.
April 26, 2010
s1: BP’s shares fall 2% amid fears that the cost of cleanup and legal
claims will hit the London-based company hard.
s2: Roughly 15,000 gallons of dispersants and 21,000ft of containment
boom are placed at the spill site.
April 27, 2010
s1: BP reports a rise in profits, due in large part to oil price increases,
as shares rise again.
s2: The US departments of interior and homeland security announce
plans for a joint investigation of the explosion and fire.
s3: Minerals Management Service (MMS) approves a plan for two
re-lief wells.
s4: BP chairman Tony Hayward says the company will take full
re-sponsibility for the spill, paying for legitimate claims and cleanup cost.
April 28, 2010
s1: The coast guard says the flow of oil is 5,000bpd, five times greater
than first estimated, after a third leak is discovered.
s2: BP’s attempts to repair a hydraulic leak on the blowout preventer
valve are unsuccessful.
s3: BP reports that its first-quarter profits more than double to£3.65
billion following a rise in oil prices.
s4: Controlled burns begin on the giant oil slick.
diversity into a unified ranking framework. We im-plement a system under such framework for ex-periments on real web datasets to compare all ap-proaches. Through our experiment we notice that the combination plays an important role in timeline generation, and global optimization weights slightly higher (α/β ∈ [10,100]), but auxiliary local infor-mation does help to enhance performance in ETTS.
Acknowledgments
This work was partially supported by NSFC with Grant No.61073082, 60933004, 70903008 and 61073081, and Xiaojun Wan was supported by NSFC with Grant No.60873155 and Beijing Nova Program (2008B03).
References
James Allan, Rahul Gupta, and Vikas Khandelwal. 2001. Temporal summaries of new topics. InProceedings of the 24th annual international ACM SIGIR conference on Research and development in information retrieval, SIGIR ’01, pages 10–18.
Hai Leong Chieu and Yoong Keok Lee. 2004. Query based event extraction along a timeline. In Proceed-ings of the 27th annual international ACM SIGIR
con-ference on Research and development in information retrieval, SIGIR ’04, pages 425–432.
G. Erkan and D.R. Radev. 2004. Lexpagerank: Prestige in multi-document text summarization. In Proceed-ings of EMNLP, volume 4.
Jade Goldstein, Mark Kantrowitz, Vibhu Mittal, and Jaime Carbonell. 1999. Summarizing text documents: sentence selection and evaluation metrics. In Proceed-ings of the 22nd annual international ACM SIGIR con-ference on Research and development in information retrieval, pages 121–128.
Xin Jin, Scott Spangler, Rui Ma, and Jiawei Han. 2010. Topic initiator detection on the world wide web. In
Proceedings of the 19th international conference on WWW’10, pages 481–490.
Giridhar Kumaran and James Allan. 2004. Text clas-sification and named entities for new event detection. InProceedings of the 27th annual international ACM SIGIR’04, pages 297–304.
Chin-Yew Lin and Eduard Hovy. 2002. From single to multi-document summarization: a prototype system and its evaluation. In Proceedings of the 40th An-nual Meeting on Association for Computational Lin-guistics, ACL ’02, pages 457–464.
Chin-Yew Lin and Eduard Hovy. 2003. Automatic evalu-ation of summaries using n-gram co-occurrence statis-tics. InProceedings of the Human Language Technol-ogy Conference of the NAACL’03, pages 71–78.
Yuanhua Lv and ChengXiang Zhai. 2009. Positional lan-guage models for information retrieval. In Proceed-ings of the 32nd international ACM SIGIR conference on Research and development in information retrieval, SIGIR ’09, pages 299–306.
Qiaozhu Mei, Jian Guo, and Dragomir Radev. 2010. Di-vrank: the interplay of prestige and diversity in infor-mation networks. In Proceedings of the 16th ACM SIGKDD’10, pages 1009–1018.
R. Mihalcea and P. Tarau. 2005. A language indepen-dent algorithm for single and multiple document sum-marization. InProceedings of IJCNLP, volume 5. D.R. Radev, H. Jing, and M. Sty. 2004. Centroid-based
summarization of multiple documents. Information Processing and Management, 40(6):919–938. Russell Swan and James Allan. 2000. Automatic
genera-tion of overview timelines. InProceedings of the 23rd annual international ACM SIGIR’00, pages 49–56. Xiaojun Wan and Jianwu Yang. 2008. Multi-document
summarization using cluster-based link analysis. In
Proceedings of the 31st annual international ACM SI-GIR conference on Research and development in in-formation retrieval, SIGIR ’08, pages 299–306. X. Wan, J. Yang, and J. Xiao. 2007a. Manifold-ranking
based topic-focused multi-document summarization. InProceedings of IJCAI, volume 7, pages 2903–2908.
X. Wan, J. Yang, and J. Xiao. 2007b. Single document summarization with document expansion. In Proceed-ings of the 22nd AAAI’07, pages 931–936.
Dingding Wang and Tao Li. 2010. Document update summarization using incremental hierarchical cluster-ing. In Proceedings of the 19th ACM international conference on Information and knowledge manage-ment, CIKM ’10, pages 279–288.
Rui Yan, Yu Li, Yan Zhang, and Xiaoming Li. 2010. Event recognition from news webpages through latent ingredients extraction. InInformation Retrieval Tech-nology - 6th Asia Information Retrieval Societies Con-ference, AIRS 2010, pages 490–501.
Rui Yan, Liang Kong, Yu Li, Yan Zhang, and Xiaoming Li. 2011a. A fine-grained digestion of news webpages through event snippet extraction. In Proceedings of the 20th international conference companion on world wide web, WWW ’11, pages 157–158.
Rui Yan, Xiaojun Wan, Jahna Otterbacher, Liang Kong, Xiaoming Li, and Yan Zhang. 2011b. Evolution-ary timeline summarization: a balanced optimization framework via iterative substitution. InProceedings of the 34th annual international ACM SIGIR conference on Research and development in information retrieval, SIGIR ’11.