Large-Scale Hierarchical
k
-
means
for
Heterogeneous Many-Core Supercomputers
Lideng Li
∗§, Teng Yu
†, Wenlai Zhao
∗§, Haohuan Fu
∗§, Chenyu Wang
†, Li Tan
‡, Guangwen Yang
∗§, John Thomson
†∗Tsinghua University, China†University of St Andrews, UK
‡Beijing Technology and Business University, China§National Supercomputing Center in Wuxi, China
{ty33, yw87, j.thomson}@st-andrews.ac.uk{lld14, zhao-w11, haohuan, ygw}@tsinghua.edu.cn
Abstract—This paper presents a novel design and implemen-tation of k-means clustering algorithm targeting the Sunway TaihuLight supercomputer. We introduce a multi-level parallel partition approach that not only partitions by dataflow and centroid, but also by dimension. Our multi-level (nkd) approach unlocks the potential of the hierarchical parallelism in the SW26010 heterogeneous many-core processor and the system architecture of the supercomputer.
Our design is able to process large-scale clustering problems with up to 196,608 dimensions and over 160,000 targeting cen-troids, while maintaining high performance and high scalability, significantly improving the capability ofk-meansover previous approaches. The evaluation shows our implementation achieves performance of less than 18 seconds per iteration for a large-scale clustering case with 196,608 data dimensions and 2,000 centroids by applying 4,096 nodes (1,064,496 cores) in parallel, makingk-meansa more feasible solution for complex scenarios. Keywords: Supercomputer, Multi/many-core Processors, Clus-tering, Parallel Computing
I. INTRODUCTION
K-meansis a well-known clustering algorithm, used widely in many AI and data mining applications, such as bio-informatics [1], [22], image segmentation [7], [21], information retrieval [35] and remote sensing image analysis [24].
Finding the optimal solution for a generalk-meansproblem is known to be NP-hard [10]. Thus, current high-end k
-means applications are limited in terms of the number of dimensions (d), and the number of centroids (k) they can consider, leading to demand for more parallel k-means
implementations [2], [24]. Our work will allow k-means
data analysis to run at an unprecedented complexity, with significantly higher dimensionality and centroid number than before. Our method is applicable to any problem with an intrinsically high dimensional feature space where traditional dimensionality reduction techniques are commonly used. A typical example in the domain of remote sensing data analysis is shown in section IV, where we manage to process a k-means problem with 4096 dimensions and 7 centroids using 400 MPI processes.
This paper presents a novel method to map data and communication for a multi-level k-means design targeting Sunway TaihuLight, one of the world’s fastest supercomputers. This method allows k-means to scale well across a large number of computation nodes, significantly outperforming previously proposed techniques. The proposed implementation
is able to process large-scale clustering problems with up to 196,608 dimensions and 160,000 centroids, while maintaining high performance and scalability – a large improvement on previous implementations, as described in Table I. Our method greatly increases the potential scope fork-meansapplications to solve previously intractable problems.
The key to our approach is a three-level data partition strategy based on hierarchical many-core hardware support. Previous high performancek-meansimplementations, such as that for the Trinity supercomputer(NNSA) [2] have used a two-level memory approach.
Such an approach, implemented in this paper as Level 2, involves partitioning first the number of clusters centroidsk
by the number of cores in a Core Group(CG) as described in section II, and then by the dataflow n into multiple CGs. Consequently, both nand kare relatively scalable, however each centroid, k, is a d-dimensional vector. The maximum value ofk∗d is limited by the shared memory of the CG. There are two main drawbacks to this approach: firstly, only one of kor dcan be scaled to a large number, as shown in Table I, which details the limits of previous implementations. Secondly, the performance scaling ofLevel 2 is shown to be poor askordgrows towards the high end of possibility for this approach. Therefore even if the memory limits were somehow solved in some other way, the performance scaling would limit the growth ofk ord.
These difficulties show the need for a new approach if larger values of k and d are to be reasonably handled. The three-level hierarchical approach proposed in this paper asLevel 3, addresses both issues of independent growth of kandd, and of scalability.
Level 3partitions dby the number cores in a CG. The data
is further partitioned into multiple CGs byk. Sincedandk
are partitioned at different hardware levels hierarchically, the total value ofk∗dis no longer limited by the size of memory available at this level. The dataflownis then partitioned into new structures - Groups of CG, as shown in Figure 2. In this way, all n, k, dcan scale without constraints between each other.
This work makes two main contributions:
Table I: Parallelk-meansimplementations
Approaches Hardware resources Programming model Samplesn Clustersk Dimensionsd
General Parallelk-meansImplementations
B¨ohm, et al [4] Multi-core Processors MIMD/SIMD 107 40 20
Hadian and Shahrivari [17] Multi-core Processors multi-thread 109 100 68
Zechner and Granitzer [37] GPU CUDA 106 128 200
Li, et al [26] GPU CUDA 107 512 160
Haut, et al [19] Cloud OpenStack 108 8 58
Cui, et al [8] Cluster Hadoop 105 100 9
Supercomputer-Orientedk-meansImplementations
Kumar, et al [24] J aguar, Oak Ridge MPI 1010 1000 30
Cai, et al [6] Gordon, SDSC mclappy (parallel R) 106 8 8
Bender, et al [2] T rinity, NNSA OpenMP 370 18 140,256
Our approach Sunway,Wuxi DMA/MPI 106 160,000 196,608
hierarchical hardware support of the Sunway TaihuLight. The novel partition method allows us to achieve tractable scaling of bothk and dto a level higher than achieved before without any interaction constraints. This results in high performance across a wide variation of kandd, are demonstrated by experiments on multiple benchmark workloads with high-dimensional data.
• The proposed three-level partitioning implementation is the first to achieve a flexible supercomputer-based large-scalek-meansimplementation with varying values of k,
dandn. There are no artificial restrictions on small and regular workloads unlike in previous work [2].
The remainder of this paper is presented as follows: Section II describes the background and related work which includes a short description of Sunway supercomputer and the k
-means problem definition, the most popular Lloyd algorithm and general parallel implementation, and the state-of-the-art supercomputer-oriented designs in the literature. Section III discusses the three levels scalable design and implementation of k-meanson Sunway. Our experimental design and results analysis are given in section IV.
II. BACKGROUND AND RELATED WORK
A. Sunway TaihuLight and SW26010 Many-Core Processor
Sunway TaihuLight is a world-leading supercomputer, which currently ranks as the second machine in the TOP500 list [28] and achieves a peak performance of 93 petaflops [15].
The high performance and efficiency of Sunway TaihuLight is due to its use of the SW26010 many-core processor. The basic architecture of the SW26010 processor is shown in Figure 1 below. Each processor contains fourcore groups (CGs). There are 65 cores in each CG, 64 computing processing element
(CPEs) and a managing processing element (MPE), which
are organized as 8 by 8 mesh. The MPE and CPE are both complete 64-bit RISC cores, but they are assigned different tasks while computing. The main function of the MPE is to support the complete interrupt functions, memory management, super-scalar and out-of-order issue/execution, and it is designed for management, task schedule, and data communications.
Figure 1: The general architecture of the SW26010 many-core processor
The CPE is assigned to maximize the aggregated computing throughput while minimize the complexity of the micro-architecture.
The SW26010 design differs significantly from the other multi-core and many-core processors: (i) for the memory hierarchy, while the MPE applies a traditional cache hierarchy (32-KB L1 instruction cache, 32-KB L1 data cache, and a 256-KB L2 cache for both instruction and data), each CPE only supplies a 16-KB L1 instruction cache, and depends on a 64 KBLocal directive Memory (LDM)(also known asScratch
Pad Memory (SPM)) as a user-controlled fast buffer. The
user-controlled ’cache’ leads to some increasing programming difficulties for using fast buffer efficiently, at the same time, providing the opportunity to implement a defined buffering scheme which is beneficial to improve the whole performance in certain cases. (ii) As for the internal information of each CPE mesh, we have a control network, a data transfer network (connecting the CPEs to the memory interface), 8 column communication buses, and 8 row communication buses. The 8 column and row communication buses provide possibility for fast register communication channels to across the 8 by 8 CPE mesh, so users can attain a significant data sharing capability at the CPE level.
B. Related Work
In this section, we provide a formal description of the k
Lloyd algorithm. Following is a discussion of the general parallel implementations and other supercomputer-based ap-proaches.
1) Problem Definition: The purpose of thek-means
clus-tering algorithm is to find a group of clusters to minimize the mean distances between samples and their nearest centroids. Formalized, given nsamplesXd ={xd
i} ∈R
d,i∈ {1. . . n},
where each sample is a d-dimensional vector xdi = (xi1,. . . ,
xid) and we use u to index the dimensions: u ∈ {1. . . d}.
We aim to findk d-dimensional centroids Cd ={cd j} ∈ R
d,
j ∈ {1. . . k} to minimize the objectO(C):
O(C) = 1
n
n
X
i=1
dis(xdi, cda(i))
end where a(i)is the index of the nearest centroid for sample
xdi:
a(i) =arg minj∈{1...k}dis(xdi, c d j)
whiledis(xd
i, cdj)is theEuclidean distance between sample
xd
i and centroidcdj:
dis(xdi, cdj) =
d
X
u=1
(xiu−cju)2
2) Lloyd Algorithm: It is well-known thatk-means problem
is in NP-hard [31]. In the literature, several methods have been proposed to find efficient solutions [5], [9], [13], [30], [31], [34]. While the most popular baseline is still theLloyd
algorithm [29], which is composed by repeating the basic two steps below:
1.: a(i) =arg minj∈{1...k} dis(xdi, c d
j) (Assign)
2.: cdj =
P
arg a(i)=jx d i
|arg a(i) =j| (U pdate)
Note that those notations here are mainly from previous works by Hamerly [18], Newling and Fleuret [30]. We will apply customized notations only when needed. The first step above is to assign each sample into the nearest centroid according to the
Euclideandistance. The second step is to update the centroids by moving them to the mean of their assigned samples in the
d-dimensional vector space. Those two steps are repeated until each cd
j is fixed.
3) General Parallel k-means: k-means algorithm has
been widely implemented in parallel architectures with shared and distributed memory using either SIMD or MIMD model targeting on multi-core processors [4], [12], [17], GPU-based heterogeneous systems [26], [36], [37], clusters of computer/-cloud [8], [19].
In the parallel case, we use l to index the processors (computing units)P and usem to denote the total number of processors applied:
P={Pl}, l∈ {1. . . m}
The dataset Xd is partitioned uniformly into m processors.
Compared against the basic Lloydalgorithm, each processor
only assigns a subset (mn) of samples from the original setXd
before theAssignstep. Then theAssignstep is finished in parallel bym processors. To formalize the steps, we obtain:
1.1 :Pl←xdi, i∈(1 + (l−1)
n m, l
n m)
1.2 :∀l∈(1, m), Pl: a(i) =arg minj∈{1...k} dis(xdi, c d j)
To facilitate communication between computing units, the Message Passing Interface (MPI) library is mostly applied in common multi-core processor environments. Performance nearly linearly increases with the limited number of processors as the communication cost between processes can be ignored in the non-scalable cases, as demonstrated in [12]. Similarly, the U pdate steps are finished by m processors in parallel through MPI as well. ProcessorsPl should communicate with
each other before the final cd
j can be updated. CUDA is
applied for implementing those communications when targeting on GPU-based systems [37], Hadoop is used in clusters [8] and OpenStack for cloud architecture [19]. We ignore the formal description of the general reduce-based parallel updating process here because it is not applicable to the proposed methods on our targeted hierarchical many-core processors.
4) Large-scale Parallel k-means on Supercomputers: In
addition to general parallelk-meansimplementations, other customizedk-meansimplementation targeting on supercom-puters are more related to our work here.
Kumar, et al [24] implemented the dataflow-partition based parallelk-meanson theJ aguar, a Cray XT5 supercomputer at Oak Ridge National Laboratory evaluated by real-world geo-graphical datasets. Their implementation applys MPI protocols to achieve broadcasting and reducing and originally scaled the value ofk to more than 1,000s level.
Cai, et al [6] designed a similar parallel approach onGordon, a Intel XEON E5 supercomputer at San Diego Supercomputer Center for grouping game players. They applied a parallel R function,mclapply, to achieve shared-memory parallelism and test different degree of parallelism by partitioning the original data-flow into different numbers of sets. They did not focus on testing the scalability of their approach but evaluated on the quality of the cluster.
Bender, et al [2] investigated a novel parallel implementation proposed for T rinity, the latest National Nuclear Security Administration supercomputer with Intel Knight’s Landing processors and their scratchpad two-level memory model. Their approach is the most state-of-the-art comparable work against our proposed methods which can not only partition dataflow, but also partition the number of target clusters k
by their hierarchical two-level memory support - cache associated with each core and scratchpadfor share. Adapted originally from [16], their partitioning algorithm partitioned the input dataset into ndM sets, where M is the size of the
scratchpad, and then reduced kndM centroids recursively if needed. Based on this partition, their approach scaleddinto 100,000s level.
Figure 2: Three-levelk-meansdesign for data partition and parallelism on Sunway architecture
and then scale bothk anddindependently. This leads to the interaction constraint between k and das discussed in their paper:
Z < kd < M
where Z is the size of cache. This partition-based method is not efficient if all k centroids could fit into one cache. In practice, this limits the value of k to be less than 18 andd
to be greater than 152,917 in their experiments. We claim that our proposed approach with underlining data partitioning methods based on hierarchical many-core processors achieves the needed multi-level fully nkd partition with architectural support to thoroughly solve this bottleneck.
We formalize the background work of both general parallelk
-meansand supercomputer-oriented implementations as shown in Table I.
III. MULTI-LEVEL LARGE-SCALEk-meansDESIGN
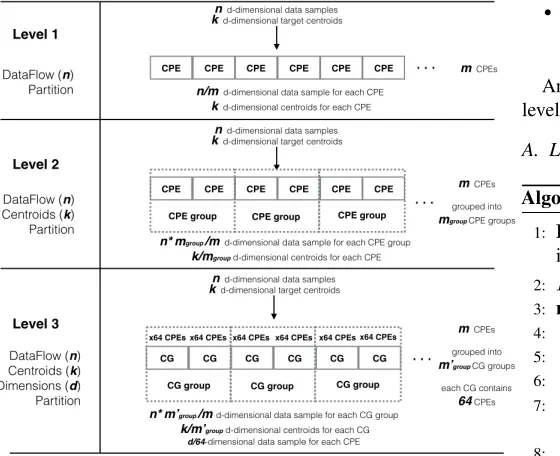
The scalability and performance of parallelk-means algo-rithm on large-scale heterogeneous systems and supercomputers are mainly bounded by the memory and bandwidth. To achieve efficient large-scalek-meanson the Sunway supercomputer, we explore the hierarchical parallelism on our heterogeneous many-core architecture. We demonstrate the proposed scalable methods on three parallelism levels by how we partition the data.
• Level 1 - DataF lowPartition: Store a whole sample and
k centroids on single-CPE
• Level 2 - DataF low and Centroids Partition: Store a whole sample on single-CPE whilstk centroids on multi-CPE
• Level 3 - DataF low, Centroids and Dimensions
Partition: Store a whole sample on multi-CPE whilstk
centroids on Multi-CG andddimensions on Multi-CPE
An abstract graph of how we partition the data into multiple levels is presented in Figure 2.
A. Level 1 - DataFlow Partition
Algorithm 1 Basic Parallelk-means
1: INPUT: Input datasetX ={xi|xi ∈Rd, i∈[1, n]}, and
initial centroid set C={cj|cj∈Rd, j∈[1, k]}
2: Pl load
←−−− C, l∈ {1. . . m} 3: repeat
4: // Parallel execution on all CPEs: 5: forl= 1 to mdo
6: Init a local centroids set Cl={cl j|c
l
j=0, j∈[1, k]}
7: Init a local counter countl = {countlj|countlj =
0, j∈[1, k]}
8: fori= (1 + (l−1)∗ n
m)to(l∗ n m)do
9: Pl
load
←−−−xi
10: a(i) =arg minj∈{1...k}dis(xi, cj)
11: cla(i)=cla(i)+xi
12: countla(i)=countla(i)+ 1
13: forj = 1 to kdo 14: AllReducecl
j andcountlj
15: cl j=
cl j
countl j
16: until Cl==C
17: OUTPUT: C
In the simple case, we run the first step, Assign, on each CPE in parallel while using multi-CPE collaboration to implement the second step,U pdate. The pseudo code of this case is shown in Algorithm 1.
TheAssignstep is implemented similarly to the traditional parallelk-meansalgorithm – (1.1) and (1.2) as above. Givenn
samples, we partition into multiple CPEs. Each CPE (Pl) firstly
reads one samplexiand finds the minimum distancesdisfrom
itself to all centroids cj to obtain a(i). Then two variables
are accumulated for each cluster centroidcj according toa(i),
shown in line 11 and 12. The first variable stores the vector sum of all the samples assigned to cj, notated ascla(i). The
second variable counts the total number of samples assigned tocj, notated ascountla(i).
In theU pdate step, we first accumulate theclj and countlj
of all CPEs by performing two AllReduce operations, so that all CPEs can obtain the assignment results of the whole input dataset. We useregister communication [14] to implement intra-CG AllReduce operation and use MPI AllReduce for inter-CG AllReduce. After the accumulation, theU pdate step is performed to calculate new centroids, as shown in line 15.
Analysis: Considering a one-CG task, we analyse the
accumulated vector sumCl andkcentroids’ counters countl.
Considering that each CPE has a limited size of LDM, we obtain the constraint (C1) below:
C1: d(1 +k+k) +k≤LDM
Since both the number of centroids k and the dimension d
for each sample xi should at least be 1, we obtain two more
boundary constraints (C2) and (C3) below, separately:
C2: 3d+ 1≤LDM
C3: 3k+ 1≤LDM
Now we analyse the performance under bandwidth bounds. Note that the Assignstep of computinga(i)for each sample
xi is completed fully in parallel on the m CPEs. Given the
bandwidth of multi-CPE architecture to beB, the DMA time of reading data from main memory can be simply formalized as:
Tread: (
n∗d
m +k∗d)/B
Theoretically, a linear speedup for computing time to at most
n times against the serial implementation can be obtained for the Assignstep if we can apply m=nCPEs in total.
The two AllReduce operations are the bottleneck process in the U pdate step. The register communication technique for internal multi-CPE communication guarantees a high-performance with a normally 3x to 4x speedup than other on-chip and Internet communication techniques (such as DMA and MPI) for this bottleneck process (referring to the experimental configuration section for detailed quantitative values). Given the bandwidth ofregister communicationto beR, the time for the AllReduce process can be formalized as:
Tcomm:
n
m((1 +k)∗d)/R
B. Level 2 - DataFlow and Centroids Partition
To scale the number of k for cluster centroids C, we use multiple (up to 64) CPEs in one CG to partition the set of centroids. The number of CPEs grouped to partition the centroids is denoted by mgroup. For illustration, we usel0 to
index the CPE groups {P}. Then we have:
{P}l0 :={Pl}, l∈(1 + (l0−1)∗mgroup, l0∗mgroup) The pseudo code of this case is shown in Algorithm 2. To partitionk centroids on mgroup CPEs, we need to do a new
sub-step against the previous case as shown in line 2. Then different from theAssignstep in above case, we partition each data sample xi in each CPE group as shown in line 8. After
that, similar to (1.2), all Plin each {P}l0 can still compute a partial value ofa(i)(named asa(i)0) fully in parallel without communication. Note that the domain of j in line 11 is only a subset of (1, . . . , k)as presented above in line 2, so we need to do one more step by data communication between CPEs in each CPE group to obtain the final a(i) as shown in line 10.
Then the U pdatestep is similar to previous case. We just view one CPE group as one basic computing unit, which
Algorithm 2 Parallelk-means fork-scale
1: INPUT: Input datasetX ={xi|xi ∈Rd, i∈[1, n]}, and
initial centroid set C={cj|cj∈Rd, j∈[1, k]}
2: Pl
load
←−−− cj j ∈ (1 + mod(mlgroup−1 ) ∗
k
mgroup, (mod(
l−1
mgroup) + 1)∗
k
mgroup)
3: repeat
4: // Parallel execution on each CPE group{P}l0: 5: forl0= 1 to mm
group do
6: Init a local centroids setCl0 and countercountl0
7: fori =(1 + (l0−1)n∗mgroup
m )to(l
0n∗mgroup
m ) do
8: {P}l0 ←load−−−xi
9: a(i)0=arg minj dis(xi, cj)
10: a(i) =min. a(i)0
11: cla0(i)=cla0(i)+xi
12: countl0
a(i)=count
l0 a(i)+ 1
13: for j = (1 + mod(ml−1
group) ∗
k
mgroup) to
((mod(ml−1
group) + 1)∗
k
mgroup)do
14: AllReducecl0
j andcountl
0
j
15: cl0 j =
clj0 countl0
j
16: until ∪ Cl0 ==C
17: OUTPUT: C
conducts what a CPE did in the previous case. Each CPE only computes values of subset of centroidsC and does not need further communications in this step as it only needs to store this subset.
Analysis: To analyse the scalability ofk in this case, the
amount of original k centroids distributed in mgroup CPEs
leads to a easier constraint of kagainst the (C3) above:
C03: 3k+ 1≤mgroup ∗LDM (mgroup≤64)
Based on this, we can also easily scale the (C1) as follow:
C01: d(1 +k+k) +k≤mgroup ∗LDM (mgroup ≤64)
Note that we still need to accommodate at least one d -dimensional sample in one CPE, so the (C2) should be kept as before:C02:=C2
As for performance, sincemgroupCPEs in one group should
read the same sample simultaneously, the processors need more time to read the input data samples than the first case, but only partial cluster centroids need to be read by each CPE:
T0read: (
n∗d∗mgroup
m +
k mgroup
∗d)/B
As for the data communication needed, there is one more bottleneck process (line 12) than before. Comparing against the above cases, multiple CPE groups can be allocated in different processors. Those communication need to be done through MPI which is much slower than internal processor multi-CPEs
register communication. Given the bandwidth of network communication through MPI to beM, we obtain:
T0comm:
k mgroup
/R+n∗mgroup
C. Level 3 - DataFlow and Centroids and Dimensions Partition
Algorithm 3 Parallel k-meansfor k-scale andd-scale
1: INPUT: Input datasetX ={xi|xi∈Rd, i∈[1, n]}, and
initial centroid setC={cj|cj∈Rd, j∈[1, k]}
2: CGl00 ←load−−−cdj, l00∈ {1. . . m
64}, j∈(1 +mod(
l00−1
m0
group
)∗
k m0
group
, (mod( l00−1
m0
group
) + 1)∗ k
m0
group
)
3: repeat
4: // Parallel execution on each CG group{CG}l00: 5: forl00= 1 to 64m do
6: Init a local centroids setCl00 and countercountl00
7: fori = (1 + (l00−1)n∗m
0
group
m )to(l
00n∗m0group
m ) do
8: foru =(1+mod(l64−1)∗ d
64 to(mod(
l−1 64)+1)∗
d
64)
do
9: CGl00 ←xi (Pl←xui) 10: a(i)0 =arg minj dis(xi, cj)
11: a(i) =min. a(i)0
12: cl 00
a(i)=c
l00 a(i)+xi
13: countl00
a(i)=count
l00 a(i)+ 1
14: for j = (1 + mod(ml000−1
group) ∗
k m0
group) to
((mod(ml000−1
group) + 1)∗
k m0
group)do
15: AllReduceclj00 andcountlj00
16: cl 00
j = clj00 countl00
j
17: until∪ Cl00==C
18: OUTPUT:C
To scale the number of dimension d for each sample xi
and further scale k, we store and partition oned-dimensional sample by one CG with 64 CPEs and then implement the algorithm on multiple CGs. The pseudo code of this case is shown in Algorithm 3.
Recall we use uto index the data dimension:u∈(1. . . d); Now we use l00 to index the CGs andm0group to denote the number of CGs grouped together to partition k centroids. Consider that we applymCPEs in total and each CG contains 64 CPEs, then we havel00∈(1, . . . ,64m),m0group≤ m
64 and:
CGl00:={Pl}, l∈(1 + 64(l00−1), 64l00)
To partitionkcentroids on multiple CGs, we obtain an updated step against the previous case as shown in line 2. To partition each d-dimensional sample xd
i on 64 CPEs in one CG, we
obtain the following step as shown in line 9.
Similar to the above case, all CGl00 in each CG group compute the partial value a(i)0 fully in parallel and then communicate to obtain the finala(i). Multi-CG communication in multiple many-core processors (nodes) is implemented through MPI interface. Then the U pdatestep is also similar to the previous case. Now we view one CG as one basic computing unit which conducts what one CPE did before and we view what a CG group does as what a CPE group did before.
Analysis: In this case, each CG with 64 CPEs accommodates
oned-dimensional sample xi. Then we can scale the previous
(C2) as follow:
C002: 3d+ 1≤64∗LDM
Consider we use totally m0group CGs to accommodate k
centroids in this case, then (C3) will scale as follow:
C003: 3k+ 1≤m0group∗64∗LDM
Note that the domain of m0group seems limited by the total number of CPEs applied,m. But in fact, this number can be large-scale as we target on the supercomputer with tens of millions of cores. Finally, (C1) will scale as follow:
C001: d(1 +k+k) +k≤64∗m0group∗LDM
which is equal to:
C001: d(1 +k+k) +k≤m∗LDM
C001is the breakthrough contribution over other state-of-the-art
work [2]: the total amount ofd∗kis not limited by a single or shared memory size any more. It is fully scalable by the total number of processors applied (m). In a modern supercomputer, this value can be large-scaled up-to tens of millions when needed.
Considering performance, note thatm0groupCGs (64 CPEs in each) in one group should read the same sample simultaneously. In another aspect, each CPE only needs to read a partial of the given d-dimension of original data sample together with a partial of kcentroids similarly as before, then we obtain a similar reading time:
T00read: (
n∗d∗m0group
m +
k m0
group
∗ d
64)/B
Comparing against the above cases, multiple CGs in CG groups allocated in different many-core processors need commu-nication to update centroids through MPI. Given the bandwidth of network communication through MPI to be M, the cost between multiple CG groups can be formalized as:
T00comm: (
k m0
group
+n∗m
0
group
m ((1 +k)∗d))/M
The network architecture of Sunway TaihuLight is a two-level fat tree. 256 computing nodes are connected via a customized inter-connection board, forming asuper-node. All super-nodes are connected with a central routing server. The intra super-node communication is more efficient than the inter super-node communication. Therefore, in order to improve the overall communication efficiency of our design, we should make a CG group located within a super-node if possible.
D. Impact of Multi-level Large-scale Design
Table II: Benchmarks from UCI and ImgNet
Data Set n k d
Kegg Network 6.5E4 256 28
Road Network 4.3E5 10,000 4 US Census 1990 2.5E6 10,000 68
ILSVRC2012 (ImgNet)
1.3E6 160,000 196,608
number of dimensions.Level 2provides similar functionality to Bender et al. [2] approach targeting onT rinity, implementing both dataflow and centroids partition (nk-partition) to success-fully handle big dataset with large-scale dimensions.Level 3is our original first ever approach to finally achieve all dataflow, centroids and data samples (nkd-partition) simultaneously to successfully handle big dataset with both large-scale dimensions and large-scale centroids achieving high performance.
The multi-level large-scale approaches together also give us the needed flexibility to handle both high dimensional and low dimensional dataset efficiently on supercomputer, which also breaks the limitation in current state-of-the-art design by Bender et al. [2] which claims only efficient for dataset with larger than 100,000 dimensions.
IV. EXPERIMENTALEVALUATION
We describe our experimental evaluation in this section. We run our proposed methods on Sunway TaihuLight, with a hierarchical SW26010 many-core processor as the main processor. architecture.
This section is structured as follows: we first describe the datasets applied and then discuss the experimental metrics. The experimental strategy is presented followed by the results on the three scalable levels, a comparison between partitioning strategies, and analysis.
A. Experimental Datasets
The datasets we applied in experiments come from well-known benchmark suites including UCI Machine Learning Repository [32] and ImgNet [20]. We briefly present the datasets in Table II, where the first three normal size bench-marks (Kegg Network, Road Network, US Census 1990) are from UCI and the final high-dimensional benchmarks
(ILSVRC2012) are from ImgNet.
We do not describe the more detailed technical and back-ground descriptions of those benchmarks as they are well-known and commonly applied in the literature.
B. Experimental Design and Metrics
The experiments have been conducted to demonstrate scalability, high performance and flexibility by increasing the number of centroidskand number of dimensionsdon multiple benchmarks with vary data size n. The three-level designs are tested targeting different sizes and types of benchmarks. Different hardware setup will be provided for testing different scalable levels:
• Level 1 - One SW26010 many-core processor is applied,
which contains 256 64-bit RISC CPEs running at 1.45
4 8 16 32 64
0 0.05
0.1 US Census 1990
64 128 256 512 1,024
0 0.05 0.1
Road Network
16 32 64 128 256
Number of centroids 0
0.01
One iteration completion time (s)
[image:7.612.48.296.66.134.2]Kegg Network
Figure 3: Level 1 - dataflow partition
GHz, grouped in 4 CGs in total. As 64 KB LDM buffer is associated with each CPE and 32 GB DDR3 memory is shared for the 4 CGs, we setup 16 MB LDM and 32 GB DDR3 memory support in total. The theoretical memory bandwidth for register communication is 46.4 GB/s and for DMA is 32 GB/s.
• Level 2 - Up-to 256 SW26010 many-core processors
are applied, which contains 65,536 64-bit RISC CPEs running at 1.45 GHz, grouped in 1,024 CGs in total. We setup 4 GB LDM and 8 TB DDR3 memory support in total. The theoretical memory bandwidth for register communication is 46.4 GB/s and for DMA is 32 GB/s. The bidirectional peak bandwidth of the network between multiple processors is 16 GB/s.
• Level 3 - Up-to 4,096 SW26010 many-core processors
are applied, which contains 1,064,496 64-bit RISC cores running at 1.45 GHz, grouped in 16,384 CGs in total. In this setup, 64 GB LDM and 128 TB DDR3 memory are supported in total. The bidirectional peak bandwidth of the network between multiple processors is 16 GB/s.
The main performance metric we are concerned with here is
one iteration completion time. Note that the total number of
iterations needed and the quality of the solution (precision) are not considered in our experiments as our work does not relate to the optimization of the underlining Lloyd algorithm or the solution ofk-meansalgorithm.
C. Experimental Results and Analysis
We report the results of three different partition strategies:
Level 1– a baseline single-level partition strategy,Level 2– an
implementation of a state-of-the-art two-level partition strategy used in recent supercomputer implementations [2], andLevel 3 – our novel three-level partition strategy.
256 512 1,024 2,048 4,096 0
5 US Census 1990
6,2500 12,500 25,000 50,000 100,000
5
10 Road Network
512 1,024 2,048 4,096 8,192 Number of centroids
0 0.1 0.2
One iteration completion time (s)
[image:8.612.75.272.50.203.2]Kegg Network
Figure 4: Level 2 - dataflow and centroids partition
show how each performs in the range for which they are most suited. The second part of our evaluation compares the partition strategies directly on benchmarks where the possible range of
kanddoverlap. This shows how our proposedLevel 3strategy scales significantly better than Level 2over varying k,d, and number of computational nodes.
1) Level 1 - dataflow partition: TheLevel 1(n-partition)
parallel design is applied to three UCI datasets (US Census
1990, Road Network, Kegg Network) with their original
sizes (n = 2,458,285, 434,874 and 65,554 separately) and data dimensions (d = 68, 4 and 28) for cross number of target centroids (k). The purpose of these experiments is to demonstrate the efficiency and flexibility of this approach on datasets with relatively low size, dimensions and centroid values. Figure 3 shows theone iteration completion time for those datasets over increasing number of clusters, k. As the number ofk increases, the completion time on this approach grows linearly.
2) Level 2 - dataflow and centroids partition: The level
2 (nk-partition) parallel design is applied to same three UCI datasets as above, but for a large range of target centroids (k). The purpose of these experiments is to demonstrate the efficiency and flexibility of the proposed approaches on datasets with large-scale target centroids (less than 100,000). Figure 4 shows theone iteration completion timeof the three datasets of increasing number of clusters,k. As the number ofkincreasing, the completion time from this approach grows linearly. We conclude that this approach works well when one dimension is varied up to the limits previously published.
3) Level 3 - dataflow, centroids and dimensions partition:
The Level 3 (nkd-partition) parallel design is applied to a
[image:8.612.360.514.51.292.2]subset of ImgNet datasets (ILSVRC2012) with its original size (n = 1,265,723). The results are presented with varying number of target centroids (k) and data dimension size (d) with an extremely large domain. We also test the scalability varying the number of computational nodes. The purpose of these experiments is to demonstrate the high performance and scalability of the proposed approaches on datasets with large size, extremely high dimensions and target centroids. Figure 5
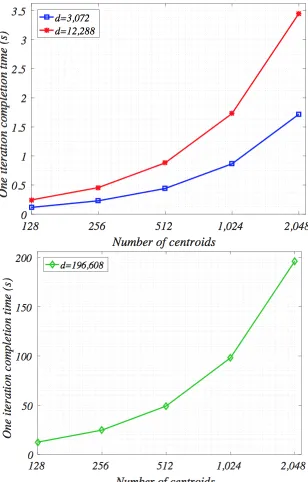
Figure 5: Level 3 - dataflow, centroids and data-sample partition
shows the completion time of the dataset of increasing number of clusters,k= 128, 256, 512, 1024 and 2,048 with increasing number of dimensions,d= 3,072 (32*32*3), 12,288 (64*64*3) and 196,608 (256*256*3).
To further investigate the scalability of our approach, we test two more cases by either further scaling centroids by certain number of data dimensions (d = 3,072) and number of nodes (nodes= 128) or further scaling nodes applied by certain number of data dimensions (d= 196,608) and number of centroids (k = 2,000). The results of those two tests are shown in Figure 6.
As both k and d increase, the completion time from our approach continues to scale well, demonstrating our claimed high performance and breakthrough large scalability.
4) Comparison of partition levels: In this section we
experimentally compare theLevel 2approach with ourLevel 3 approach.
Figure 7 shows how one iteration completion time grows as the number of dimensions increases. The Level 2 approach outperforms Level 3 when the number of dimensions is rela-tively small. However, the Level 3 approach scales significantly better with growing dimensionality, outperforming Level 2 for all d greater than 2560. The Level 2 approach cannot run with d greater than 4096 in this scenario due to memory constraints. However, it is clear that, even if this problem were solved, the poor scaling would still limit this approach. The completion time for Level 2 falls twice unexpectedly between 1536 and 2048, and between 2560 and 3072. This is due to the crossing of communication boundaries in the architecture of the supercomputer – the trend remains clear however.
Figure 6: Level 3 - large-scale on centroids and nodes
512
1,024 1,536 2,048 2,560 3,072 3,584 4,096 4,608 5,120 5,632 6,144 6,566 7,168 7,680 8,192
Number of dimensions
0 0.5 1 1.5 2 2.5 3
One iteration completion time (s)
[image:9.612.98.255.55.301.2]Level 2 Level 3
Figure 7: Comparison: varying d with 2,000 centroids and 1,265,723 data samples tested on 128 nodes
256 512
1,024 2,048 4,096 8,192 16,384 32,768 65,536 131,072
Number of centroids
0 50 100 150 200
One iteration completion time (s)
Level 2 Level 3
256 512 1,024 2,048 4,096 0
2 4 6
Figure 8: Comparison test: varying k with 4,096 dimensions and 1,265,723 data samples tested on 128 nodes
2 4 8 16 32 64 128 256
Number of nodes
0 50 100 150 200
One iteration completion time (s)
Level 2 Level 3
64 128 256 0
2 4 6
Figure 9: Comparison test: varying number of nodes used with a fixed 4,096 dimension, 2,000 centroids and 1,265,723 data samples
ofd is fixed at 4096, the Level 3 approach actually always outperforms Level 2, with the gap increasing askincreases. This scaling trend is replicated at lower levels ofdtoo, though Level 2 initially outperforming Level 3 at lower values of k.
Figure 9 shows how both Level 2 and Level 3 scale across an increasing number of computation nodes. Level 3 clearly outperforms Level 2 in all scenarios. The values of kand d
are fixed, as described in the graph caption, at levels which Level 2 can operate. The performance gap narrows as more nodes are added, but remains significant. Clearly the exact performance numbers will vary with other valuesk andd, as can be inferred from other results, but the main conclusion we draw here is that Level 3 generally scales well.
5) Comparison with other architectures: As discussed in the
background section, state-of-the-art supercomputing-oriented approaches are tested either on their specific datasets [6], [24] or publish only their relative speedups [2] instead of execution times. It is not possible to compare our actual execution time with these supercomputing-oriented approaches directly. Additionally, wallclock execution times are problematic to compare across vastly differing architectures with different budgets.
To give some insight into the performance we obtain, we compare execution time with other architectures directly where this is possible. We present five comparable results from published literature in Table III. Based on the differing workload sizes presented in these papers, we adjust the hardware configuration for Sunway TaihuLight, changing the number of nodes utilized. This is determined by the size of the task in terms of k and d where no further performance gains are possible by adding more nodes. The number of nodes varies from just one node for a single processing unit [23], [27] to 128 nodes in [33].
[image:9.612.91.260.348.484.2] [image:9.612.91.260.541.677.2]Table III: Execution time comparison with other architectures
Approaches Hardware Resources n k d Execution time per iteration (sec.)
Execution time per iteration by Sunway TaihuLight (sec.)
Speedup
Rossbach, et al [33] 10x NVIDIA Tesla K20M + 20x Intel Xeon E5-2620
1.0E9 120 40 49.4 0.468635 (128 nodes) 105x
[image:10.612.46.314.82.303.2]Bhimani, et al [3] NVIDIA Tesla K20M 1.4E6 240 5 1.77 0.025336 (4 nodes) 70x Jin, et al [23] NVIDIA Tesla K20c 1.4E5 500 90 5.407 0.110191 (1 node) 49x Li, et al [27] Xilinx ZC706 2.1E6 4 4 0.0085 0.002839 (1 node) 3x Ding, et al [13] Intel i7-3770K 2.5E6 10,000 68 75.976 2.424517 (16 nodes) 31x
Figure 10: Remote Sensing Image Classification: The left hand side is the result from baseline approach provided by [11], the middle is the corresponding original image and the right hand side is our classification result. We apply different colors to identify different region classes as used in [11].
and an NVIDIA Tesla K20c GPU respectively [3], [23], an FPGA based approach running a custom parallel k-means implementation on Xilinx ZC706 FPGA [27], and a multi-core processor based approach running a custom implementation of parallel k-means on 8-core Intel i7-3770k processor [13].
The proposed approach running on the Sunway TaihuLight supercomputer achieves more than100x speedup over the high-performance heterogeneous nodes based approach, between
50x-70x speedup than those single GPU based approaches, and
31x speedup over multi-core CPU based approach on their largest solvable workload sizes.
Although we are able to show substantial improvement against these architectures, the approach presented in this paper is principally designed for, and performs best on higher dimensionality and higher numbers of centroids than is possible on such small systems.
D. Impact on Applications
As a widely used clustering algorithm, a highly efficient and scalablek-meansimplementation is important to support applications with increasingly large problem sizes and data processing requirements. To demonstrate the efficacy of our design on a real application, we report results for the land
cover classification application. This is a popular remote
sensing problem, requiring unsupervised methods to handle high numbers of unlabeled remote sensing images [25].
K-means has already been used for regional land cover classification with small number of targeted classes. For
example, Figure 10 shows our result of classifying a remote sensing image (from a public dataset called Deep Globe 2018 [11]) into 7 classes, representing the urban, the agriculture, the rangeland, the forest, the water, the barren and unknown. There are 803 images in the Deep Globe 2018 dataset, and each image has about 2k×2k pixels. The resolution of the image is 50cm/pixel. In this problem definition, we cluster on one image, wherenis 5838480, kis 7 and dis 4096, which can be done with 400 SW26010 many-core processors. Our Level 3 design can process the clustering dataset efficiently. In recent years, high-resolution remote sensing images have become more common in land cover classification problems. The problem definition on high-resolution images is more complex as the classification sample can be a block of pixels instead of one pixel, which means thedcan be even larger.
Real world research of high-resolution land cover classifi-cation and other similar problems are currently in progress on the Sunway TaihuLight supercomputer, using the method proposed in this paper. Further significant applications with intrinsic high dimensionality are potentially supported.
V. CONCLUSIONS
This paper presents the first ever fully data partitioned (nkd -partition) approach for parallel k-means implementation to achieve scalability and high performance at large numbers of centroids and high data dimensionality simultaneously. Running on the Sunway TaihuLight supercomputer, it breaks previous limitations for high performance parallel k-means, allowing data scientists a new powerful tool with great potential.
The proposed multi-level approach also achieves greater flexibility on general workloads with varying data size, tar-get centroids and data dimensions compared with previous supercomputer-specific approaches. The novel design unlocks the potential of hierarchical hardware support of the Sunway TaihuLight fork-means, and shows how to optimize this and potentially similar algorithms for a cutting edge heterogeneous many-core supercomputer design.
REFERENCES
[1] Amir Ben-Dor, Ron Shamir, and Zohar Yakhini. Clustering gene expression patterns. Journal of computational biology, 6(3-4):281–297, 1999.
[3] Janki Bhimani, Miriam Leeser, and Ningfang Mi. Accelerating k-means clustering with parallel implementations and gpu computing. InHigh Performance Extreme Computing Conference (HPEC), 2015 IEEE, pages 1–6. IEEE, 2015.
[4] Christian B¨ohm, Martin Perdacher, and Claudia Plant. Multi-core k-means. InProceedings of the 2017 SIAM International Conference on Data Mining, pages 273–281. SIAM, 2017.
[5] Thomas Bottesch, Thomas B¨uhler, and Markus K¨achele. Speeding up k-means by approximating euclidean distances via block vectors. In International Conference on Machine Learning, pages 2578–2586, 2016. [6] Y Dora Cai, Rabindra Robby Ratan, Cuihua Shen, and Jay Alameda. Grouping game players using parallelized k-means on supercomputers. InProceedings of the 2015 XSEDE Conference: Scientific Advancements Enabled by Enhanced Cyberinfrastructure, page 10. ACM, 2015. [7] Guy Barrett Coleman and Harry C Andrews. Image segmentation by
clustering.Proceedings of the IEEE, 67(5):773–785, 1979.
[8] Xiaoli Cui, Pingfei Zhu, Xin Yang, Keqiu Li, and Changqing Ji. Optimized big data k-means clustering using mapreduce.The Journal of Supercomputing, 70(3):1249–1259, 2014.
[9] Ryan R Curtin. A dual-tree algorithm for fast k-means clustering with large k. InProceedings of the 2017 SIAM International Conference on Data Mining, pages 300–308. SIAM, 2017.
[10] Sanjoy Dasgupta. The hardness of k-means clustering. Department of Computer Science and Engineering, University of California, San Diego, 2008.
[11] Ilke Demir, Krzysztof Koperski, David Lindenbaum, Guan Pang, Jing Huang, Saikat Basu, Forest Hughes, Devis Tuia, and Ramesh Raskar. Deepglobe 2018: A challenge to parse the earth through satellite images. ArXiv e-prints, 2018.
[12] Inderjit S Dhillon and Dharmendra S Modha. A data-clustering algorithm on distributed memory multiprocessors. InLarge-scale parallel data mining, pages 245–260. Springer, 2002.
[13] Yufei Ding, Yue Zhao, Xipeng Shen, Madanlal Musuvathi, and Todd Mytkowicz. Yinyang means: A drop-in replacement of the classic k-means with consistent speedup. InInternational Conference on Machine Learning, pages 579–587, 2015.
[14] Jiarui Fang, Haohuan Fu, Wenlai Zhao, Bingwei Chen, Weijie Zheng, and Guangwen Yang. swdnn: A library for accelerating deep learning applications on sunway taihulight. InParallel and Distributed Processing Symposium (IPDPS), 2017 IEEE International, pages 615–624. IEEE, 2017.
[15] Haohuan Fu, Junfeng Liao, Jinzhe Yang, Lanning Wang, Zhenya Song, Xiaomeng Huang, Chao Yang, Wei Xue, Fangfang Liu, Fangli Qiao, et al. The sunway taihulight supercomputer: system and applications. Science China Information Sciences, 59(7):072001, 2016.
[16] Sudipto Guha, Adam Meyerson, Nina Mishra, Rajeev Motwani, and Liadan O’Callaghan. Clustering data streams: Theory and practice.IEEE transactions on knowledge and data engineering, 15(3):515–528, 2003. [17] Ali Hadian and Saeed Shahrivari. High performance parallel k-means clustering for disk-resident datasets on multi-core cpus. The Journal of Supercomputing, 69(2):845–863, 2014.
[18] Greg Hamerly. Making k-means even faster. InProceedings of the 2010 SIAM international conference on data mining, pages 130–140. SIAM, 2010.
[19] Juan Mario Haut, Mercedes Paoletti, Javier Plaza, and Antonio Plaza. Cloud implementation of the k-means algorithm for hyperspectral image analysis.The Journal of Supercomputing, 73(1):514–529, 2017. [20] ImgNet ILSVRC2012. http://www.image-net.org/challenges/lsvrc/2012/. [21] Anil K Jain and Richard C Dubes. Algorithms for clustering data.
Prentice-Hall, Inc., 1988.
[22] Daxin Jiang, Chun Tang, and Aidong Zhang. Cluster analysis for gene expression data: a survey. IEEE Transactions on knowledge and data engineering, 16(11):1370–1386, 2004.
[23] Yu Jin and Joseph F Jaja. A high performance implementation of spectral clustering on cpu-gpu platforms.arXiv preprint arXiv:1802.04450, 2018. [24] Jitendra Kumar, Richard T Mills, Forrest M Hoffman, and William W Hargrove. Parallel k-means clustering for quantitative ecoregion delin-eation using large data sets. Procedia Computer Science, 4:1602–1611, 2011.
[25] Weijia Li, Haohuan Fu, Le Yu, Peng Gong, Duole Feng, Congcong Li, and Nicholas Clinton. Stacked autoencoder-based deep learning for remote-sensing image classification: a case study of african land-cover mapping.International Journal of Remote Sensing, 37(23):5632–5646, 2016.
[26] You Li, Kaiyong Zhao, Xiaowen Chu, and Jiming Liu. Speeding up k-means algorithm by gpus. InComputer and Information Technology (CIT), 2010 IEEE 10th International Conference on, pages 115–122. IEEE, 2010.
[27] Zhehao Li, Jifang Jin, and Lingli Wang. High-performance k-means implementation based on a simplified map-reduce architecture. arXiv preprint arXiv:1610.05601, 2016.
[28] Top500 list. https://www.top500.org/lists/2018/06/.
[29] Stuart Lloyd. Least squares quantization in pcm. IEEE transactions on information theory, 28(2):129–137, 1982.
[30] James Newling and Franc¸ois Fleuret. Fast k-means with accurate bounds. InInternational Conference on Machine Learning, pages 936–944, 2016. [31] James Newling and Franc¸ois Fleuret. Nested mini-batch k-means. In Advances in Neural Information Processing Systems, pages 1352–1360, 2016.
[32] UCI Machine Learning Repository. http://archive.ics.uci.edu/ml/datasets.html.
[33] Christopher J Rossbach, Yuan Yu, Jon Currey, Jean-Philippe Martin, and Dennis Fetterly. Dandelion: a compiler and runtime for heterogeneous systems. InProceedings of the Twenty-Fourth ACM Symposium on Operating Systems Principles, pages 49–68. ACM, 2013.
[34] Xiao-Bo Shen, Weiwei Liu, Ivor W Tsang, Fumin Shen, and Quan-Sen Sun. Compressed k-means for large-scale clustering. InAAAI, pages 2527–2533, 2017.
[35] Michael Steinbach, George Karypis, Vipin Kumar, et al. A comparison of document clustering techniques. InKDD workshop on text mining, volume 400, pages 525–526. Boston, 2000.
[36] Leonardo Torok, Panos Liatsis, Jos Viterbo, Aura Conci, et al. k-ms. Pattern Recognition, 66(C):392–403, 2017.


![Figure 10: Remote Sensing Image Classification: The left handside is the result from baseline approach provided by [11], themiddle is the corresponding original image and the right handside is our classification result](https://thumb-us.123doks.com/thumbv2/123dok_us/8758224.390684/10.612.46.314.82.303/sensing-classication-handside-approach-themiddle-corresponding-handside-classication.webp)
